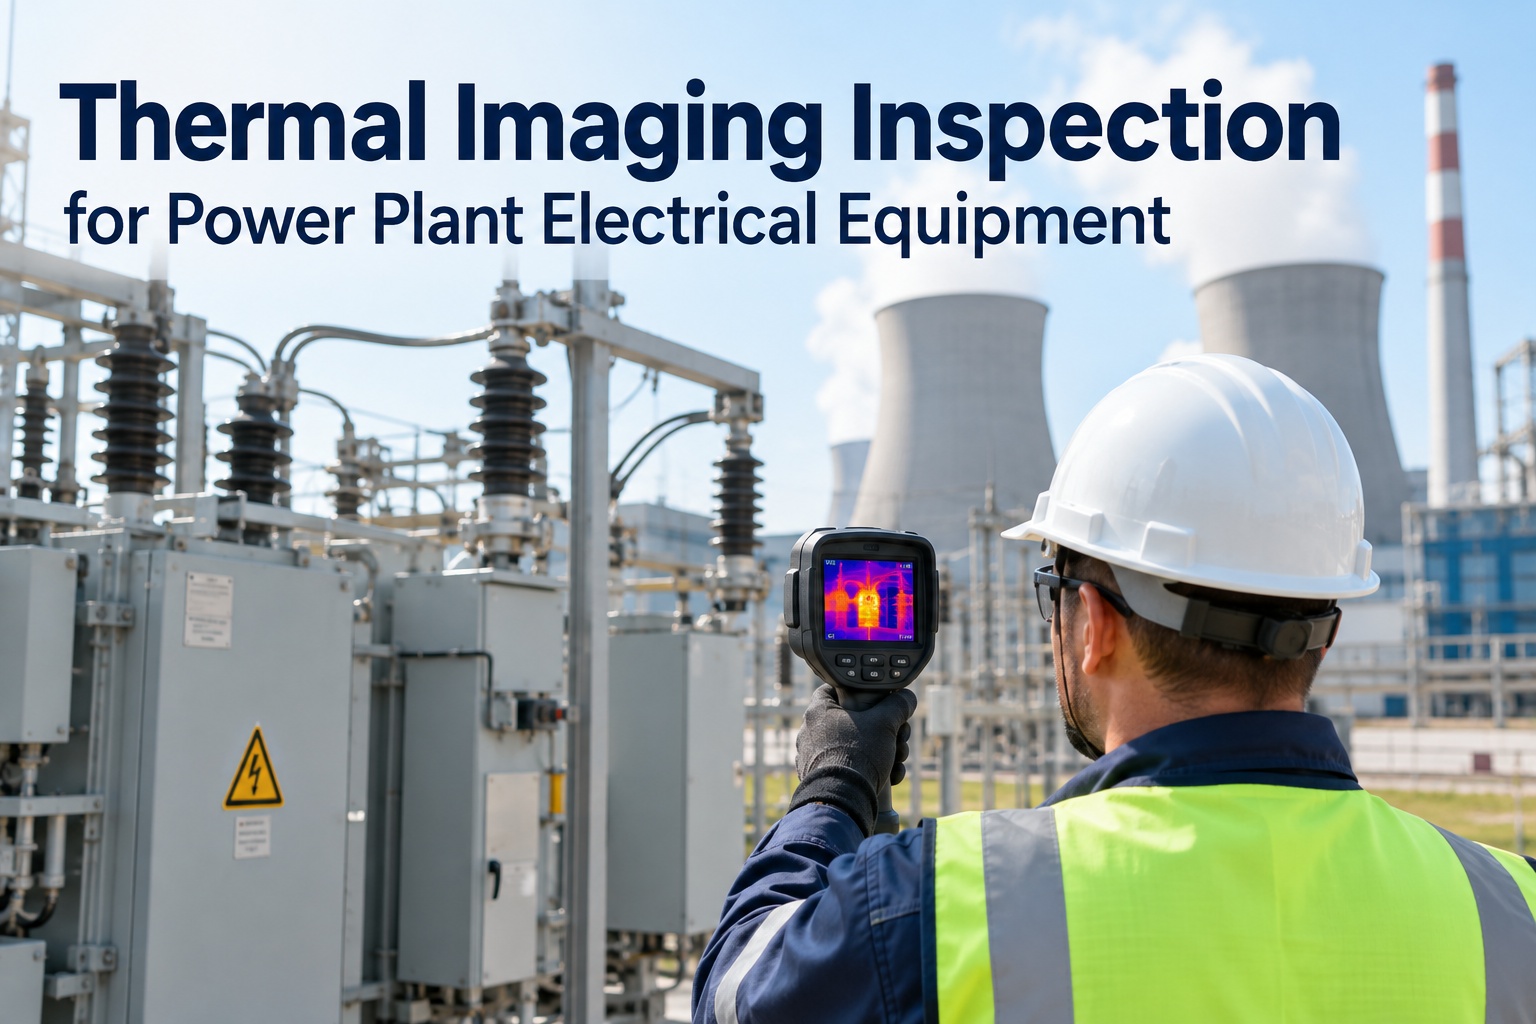
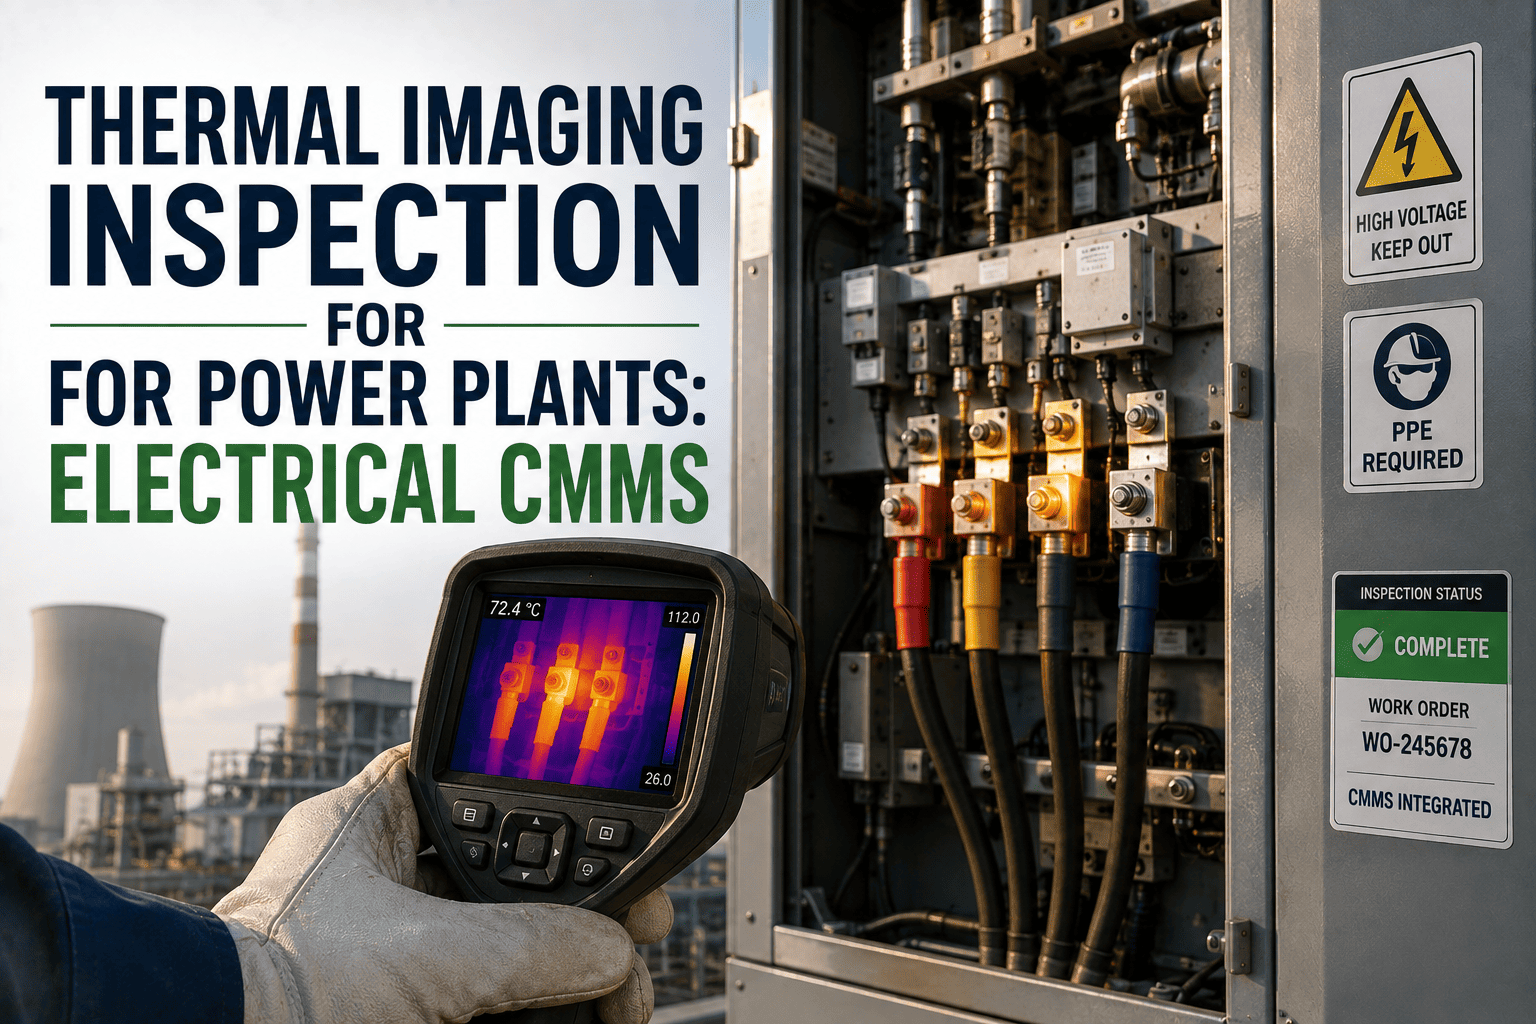
Every electrical fault in a power plant produces heat before it produces a failure — and until recently, that heat was invisible to maintenance teams until a breaker tripped or a cable burned. AI-powered thermal imaging changes that entirely: infrared cameras paired with machine learning now scan thousands of components per inspection, flag temperature anomalies against learned baselines, and feed prioritized fault alerts directly into your maintenance workflow — automatically, without requiring a thermography specialist on every walkdown. If your plant is still relying on annual IR surveys to catch hotspots, you are missing faults that develop and escalate in weeks, not months.
85%
of electrical faults give thermal warning days or weeks before failure
10×
more components scanned per hour with AI vs manual thermography
$4M+
average cost of a transformer fire caused by undetected electrical fault
3 wks
average thermal warning lead time before catastrophic electrical failure
How AI Thermal Imaging Works in Power Plant Maintenance
Traditional thermography required a trained thermographer to walk through the plant, capture IR images manually, and spend hours reviewing footage to identify anomalies — a process done once or twice a year at best. AI-powered thermal imaging transforms that into a continuous, automated process.
Infrared Camera Captures
Fixed or drone-mounted IR cameras scan electrical panels, cable trays, motor terminals, transformer bushings, and switchgear continuously or on programmed inspection cycles — without requiring technician presence in front of live equipment.
AI Engine Analyzes
Machine learning models compare each thermal frame against component-specific baselines and ambient-corrected thresholds. The AI distinguishes harmless thermal patterns from genuine fault signatures — eliminating false positives that plague threshold-only alert systems.
Severity Classified
Each detected anomaly is classified by severity — Advisory, Warning, or Critical — based on temperature differential above baseline, rate of change, and component criticality. Classification drives the priority and timeline of the resulting maintenance action.
Work Order Auto-Generated
A condition-based work order is created automatically in the maintenance platform — pre-populated with the thermal image, GPS location, severity classification, component ID, and recommended corrective action. The crew receives a ready-to-act task, not a raw data file to interpret.
Thermal Severity Classification
Advisory
+5°C to +15°C above baseline
Monitor — schedule inspection within 90 days
Warning
+15°C to +40°C above baseline
Investigate — inspect and repair within 30 days
Critical
+40°C or more above baseline
Immediate — isolate and repair before next operation
Temperature differentials referenced to IEC 60076 and NETA MTS standards for electrical asset thermography classification
What Thermal Imaging Detects in Power Plant Systems
The value of thermal inspection lies in the breadth of failure modes it can catch across both electrical and mechanical systems — many of which produce no visible, audible, or vibration-based signals until the fault is already severe.
Loose or corroded connections
Localized hotspot at terminal · differential vs adjacent phases
Overloaded conductors or cables
Elevated temperature across cable length · exceeds derating threshold
Failing circuit breakers
Hot contact or arcing point visible · asymmetric phase temperature
Transformer insulation degradation
Bushing hotspot · winding temperature asymmetry · radiator blockage
Partial discharge in MV switchgear
Localized heating in insulation zones · consistent with discharge path
Capacitor bank anomalies
Individual cell overheating · uneven load distribution across bank
Bearing overheating in motors and pumps
Elevated housing temperature · 15°C+ above adjacent bearing
Blocked or fouled heat exchangers
Non-uniform temperature pattern · inlet/outlet differential shift
Steam trap failure (bypass)
Downstream pipe at steam temperature instead of condensate temperature
Refractory or insulation breakdown
Hot surface on boiler or duct casing · loss of insulation integrity
Cooling system blockage
Hot zones in cooler headers · abnormal gradient across cooling circuit
Misaligned or overloaded couplings
Elevated coupling temperature · asymmetric with load vs no-load comparison
Integrate AI Thermal Inspection Into Your Maintenance Workflow
Oxmaint connects thermal imaging fault alerts directly to condition-based work orders — so every hotspot detected becomes a tracked, assigned, and resolved maintenance task with full audit documentation. No manual hand-off. No lost findings.
AI Thermography vs. Traditional Manual IR Surveys
Comparison Point
Traditional IR Survey
AI Thermal Monitoring
Inspection frequency
Annual or biannual — faults develop undetected between surveys
Continuous or daily — every scan cycle covers the full asset set
Specialist dependency
Certified thermographer required for each survey — high cost, scheduling constraints
AI analysis replaces expert review — field crews execute, platform interprets
Component coverage
200–400 components per day per thermographer
2,000–5,000 components per hour with fixed or drone-mounted cameras
False positive rate
High — ambient temperature, emissivity errors, and angle variation cause misclassification
Low — AI corrects for ambient, emissivity, and loading variations before classification
Finding documentation
PDF report delivered days after survey — no direct maintenance system link
Automatic work order creation with thermal image, location, and severity embedded
Trend tracking
No baseline comparison — each survey is a standalone snapshot
Every scan compared to asset-specific baseline — rate-of-change alerts trigger early
Live equipment access
Thermographer stands in front of energized panels — arc flash exposure risk
Fixed cameras or drones eliminate personnel exposure to live electrical equipment
Thermal Imaging Coverage Across Power Plant Asset Zones
Zone 01
High Voltage Switchyard
Transformer bushings · disconnect switches · current transformers · surge arresters · bus connections
Highest consequence zone — faults here cause full station outage and potential arc flash incident
Zone 02
Main Generator & Excitation
Stator winding connections · exciter rectifiers · collector rings · cooling air filters · terminal box connections
Winding connection hotspots precede ground faults — early detection avoids $1M+ stator rewinds
Zone 03
MV & LV Switchgear Rooms
Breaker contact faces · bus bar connections · cable terminations · relay panels · MCC starter contacts
Loose terminations are the most common finding — detected 3–8 weeks before contact failure or fire
Zone 04
Turbine & Auxiliary Systems
Bearing housings · lube oil coolers · steam seals · exhaust casing joints · auxiliary motor terminals
Bearing thermal trends provide 2–6 week lead time on failures that would otherwise cause catastrophic rotor damage
Zone 05
Boiler & Steam Systems
Refractory casing · steam trap lines · header welds · sootblower seals · furnace wall tubes
Refractory hotspots indicate casing burnout risk — early identification prevents unplanned boiler outages worth $200K+ per day
Zone 06
Cooling & Balance of Plant
Cooling tower fans · heat exchanger faces · condenser tube zones · compressed air distribution · pump motor housings
Fouled heat exchangers reduce thermal efficiency before process symptoms appear — thermal imaging quantifies degradation in real time
What Thermal Imaging Delivers to Your Maintenance Program
3 weeks
Average lead time before electrical failure — time to plan a repair instead of scramble for one
10×
More components inspected per hour with AI vs manual thermographer-led survey
Zero
Arc flash exposures — fixed cameras inspect live equipment without personnel in front of open panels
75%
Reduction in undetected electrical faults vs annual IR survey program
$4M+
Transformer fire cost avoided by detecting bushing hotspot before failure
60%
Faster fault-to-repair cycle when thermal data is linked directly to work orders
100%
Thermal inspection records audit-ready with timestamp, image, location, and severity — no manual compilation
Frequently Asked Questions
QHow accurate is AI thermal imaging compared to a certified thermographer?
Modern AI thermography models, when trained on plant-specific baselines, match or exceed certified thermographer accuracy for standard fault classification — and significantly outperform manual surveys on consistency and coverage. Human analysts are subject to fatigue, angle variation, and ambient-temperature errors that AI systems correct automatically using ambient compensation algorithms. For complex or ambiguous findings, AI flags for human review rather than auto-classifying — combining the speed of automation with specialist judgment where it matters.
Sign up to see how thermal findings are classified and routed in Oxmaint.
QWhat infrastructure does AI thermal imaging require in a power plant?
The hardware requirement depends on the monitoring approach. Fixed cameras installed at panel fronts or cable trays need power and network connectivity; periodic drone-based surveys need a flight path plan and docking station. For integration with Oxmaint, thermal data is ingested via API or direct image upload — no proprietary hardware lock-in. Existing handheld IR cameras used by inspection crews can also feed findings into the platform through the mobile app.
Book a session to review integration options for your existing camera infrastructure.
QHow does thermal imaging help with electrical safety and arc flash risk?
Fixed or drone-mounted thermal cameras inspect energized electrical equipment without requiring a technician to stand in front of open switchgear or panels — eliminating the arc flash exposure associated with traditional IR surveys. When a fault is detected and classified as Critical, crews are dispatched with full fault context and can plan the safest isolation and repair sequence before touching the equipment. This shifts the safety posture from reactive risk exposure to informed, planned intervention.
Start a free trial to explore how thermal fault alerts drive safer maintenance workflows.
QCan thermal imaging findings be used as compliance documentation?
Yes — when thermal inspection data flows through Oxmaint, every finding is automatically recorded with a timestamp, camera location, thermal image, severity classification, and the work order it generated. This creates a complete, auditor-ready inspection history for NETA, NERC, OSHA, and insurance audit requirements — without any manual documentation effort from the maintenance team.
Book a demo to see the compliance export format for your regulatory requirements.
Turn Every Thermal Anomaly Into a Resolved Maintenance Task
AI thermal imaging finds the faults. Oxmaint makes sure every one of them becomes a tracked work order, assigned to the right crew, completed on time, and documented for compliance — closing the loop from detection to resolution automatically.