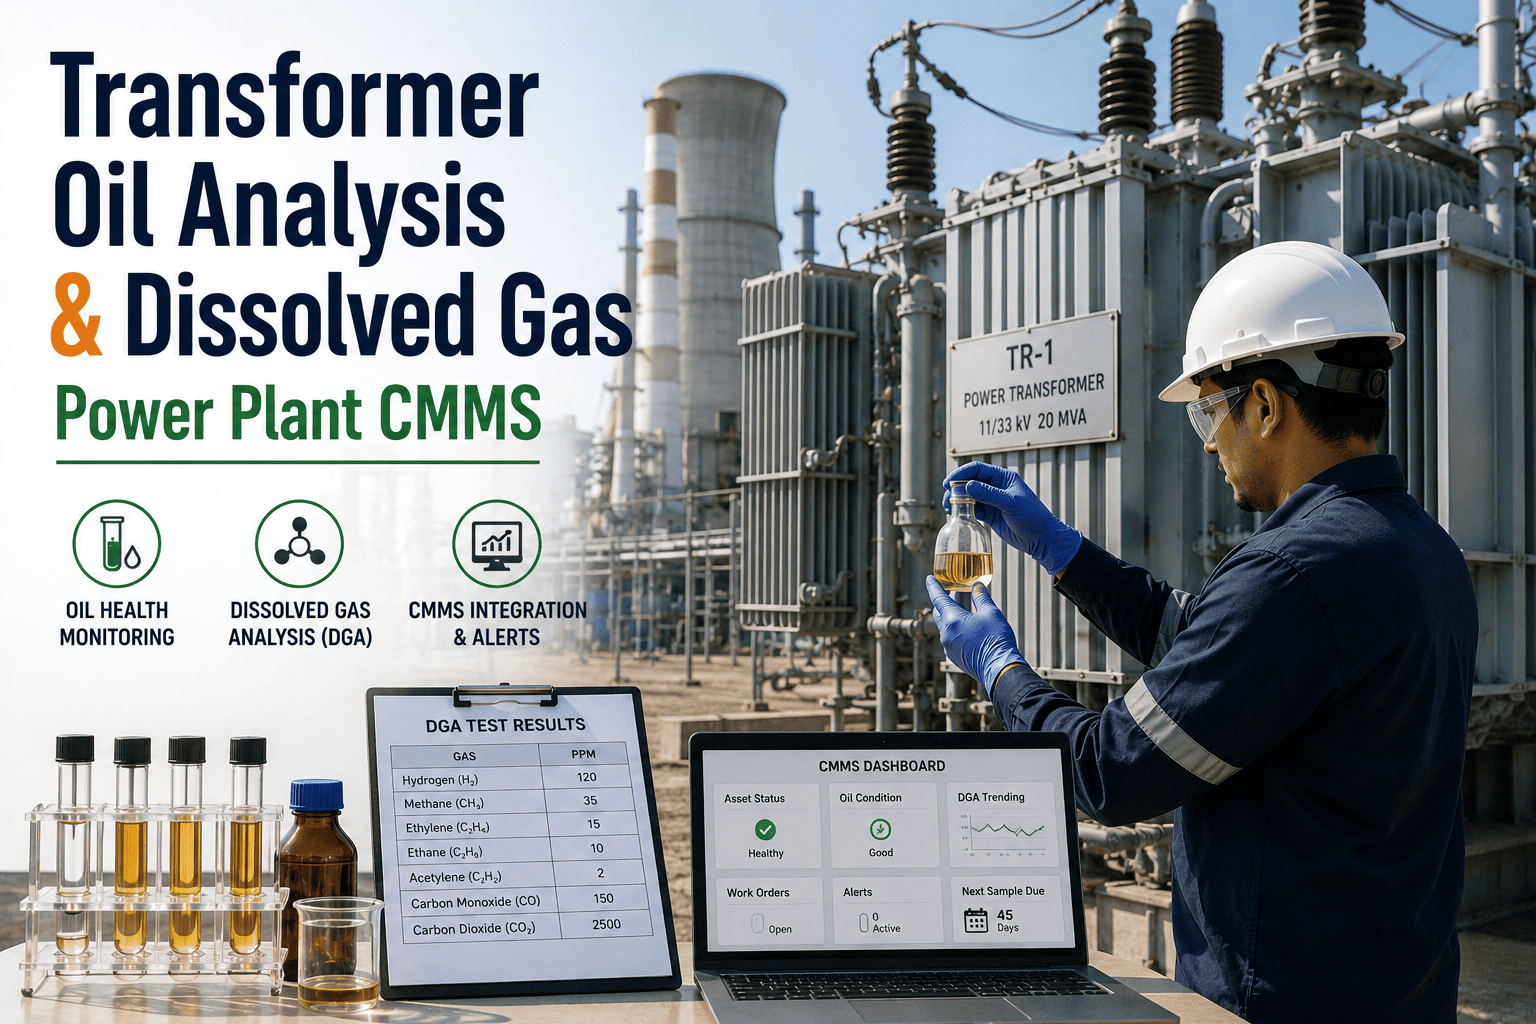
A transformer that is about to fail rarely makes any noise. Internal arcing, partial discharge, slow thermal degradation of cellulose insulation, and incipient winding hot spots all happen silently inside a sealed tank of mineral oil. What they all leave behind is gas — hydrogen, methane, ethylene, acetylene, carbon monoxide — dissolved in that oil, in concentrations and ratios that tell you exactly what is going wrong months before the breaker trips. A quarterly Dissolved Gas Analysis route turns those invisible gases into a hard fault diagnosis: same sampling point, same syringe procedure, same lab, same interpretation method, every 90 days. This page is the working checklist your maintenance team carries — sample point selection, ASTM-compliant sampling steps, IEEE C57.104 status levels, Duval Triangle fault zones, and the CMMS record that keeps the trend alive across years.
7 gases
H₂, CH₄, C₂H₆, C₂H₄, C₂H₂, CO, CO₂ — each a different fault story
3 status
IEEE C57.104-2019 simplified to three condition levels
7 zones
Duval Triangle fault classification — PD, T1–T3, D1, D2, DT
50 ml
Standard gas-tight syringe volume per ASTM D3613
Why Quarterly — and Not Annual or Reactive
Annual sampling is what insurers ask for as a minimum. Reactive sampling — only when something looks wrong — is what costs plants their critical transformers. Quarterly cadence sits in the right operational zone: frequent enough to catch gas generation rate changes that signal an active fault developing, infrequent enough to fit a real maintenance budget. IEEE C57.104-2019 explicitly bases its condition assessment on both absolute concentration and the rate of change between samples — and rate of change is invisible if you only sample once a year.
Rate Matters
Gas generation rate above the 95th percentile per IEEE C57.104-2019 triggers status escalation regardless of absolute level. Four samples per year reveal rate; one cannot.
Fault Velocity
A partial discharge condition can progress to high-energy arcing in weeks. Quarterly catches it in the PD or T1 phase when the transformer is still recoverable.
Cellulose Aging
CO and CO₂ trends show paper insulation degradation. Quarterly lets you separate normal aging from accelerated thermal damage — a critical distinction for life extension decisions.
Audit & Warranty
Quarterly DGA records support insurance claims, OEM warranty extensions, and end-of-life decisions. Annual data is rarely sufficient to defend a multi-million-dollar capital decision.
The Seven Key Gases — What Each One Tells You
Every fault inside a transformer produces a specific gas signature. The chemistry is well documented: oil decomposing under arcing produces different molecules than oil overheating, and both differ from cellulose breaking down. Reading the gas profile is reading the failure mode — and that reading is what separates routine condition monitoring from the high-value diagnosis that prevents a forced outage.
H₂
Hydrogen
Partial discharge, corona activity, low-energy arcing inside the tank or bushings
CH₄
Methane
Low-temperature oil overheating, typically below 300 °C — hot spots, circulating currents
C₂H₆
Ethane
Lower-temperature thermal faults — appears alongside methane in early thermal events
C₂H₄
Ethylene
High-temperature thermal fault above 300 °C — winding hot spot, severe overload, blocked oil flow
C₂H₂
Acetylene
High-energy arcing above 700 °C — the most serious gas. Even small concentrations demand investigation.
CO
Carbon Monoxide
Cellulose paper insulation degradation — accelerated thermal aging of winding insulation
CO₂
Carbon Dioxide
Normal cellulose aging — but CO/CO₂ ratio change signals abnormal paper breakdown
IEEE C57.104-2019 Status Levels at a Glance
The 2019 revision of IEEE C57.104 replaced the older four-condition table with a simplified three-status framework based on statistical analysis of a much larger dataset than the original 1978 standard. Each gas has 90th-percentile and 95th-percentile concentration limits, plus rate-of-change limits between samples. The lab returns the gas concentrations; the CMMS assigns the status; the engineer plans the response.
Status 1
Normal Operation
All key gases below the 90th percentile. No indication of active gassing. Continue routine quarterly sampling.
Action: Maintain quarterly cadence — no intervention needed
Status 2
Elevated Concern
One or more gases between 90th and 95th percentile, or rate-of-change crossing the threshold. Active gassing possible.
Action: Increase sampling to monthly, apply Duval Triangle
Status 3
Active Fault Likely
Gas levels above 95th percentile or rate of change above threshold. Probable active fault inside the unit.
Action: Weekly sampling, plan inspection, prepare load reduction
The Duval Triangle — Seven Fault Zones
The Duval Triangle is the most widely used graphical interpretation method in DGA. It uses just three gases — methane, ethylene, and acetylene — converted to relative percentages and plotted on a ternary triangle divided into seven fault zones. The zone where the point lands tells you the fault type: partial discharge, low-energy discharge, high-energy discharge, low-temperature thermal, mid-temperature thermal, high-temperature thermal, or a mixed thermal-electrical fault.
PD
Partial Discharge
Corona, low-energy electrical discharge inside oil or paper insulation. Often the earliest electrical fault indicator.
D1
Low-Energy Discharge
Sparking and tracking — typically in tap changer, between turns, or along insulation creep paths.
D2
High-Energy Discharge
Power arcing — fault current flowing through oil. Most severe electrical event; usually triggers protection.
T1
Thermal Fault < 300 °C
Low-temperature overheating — typically poor connections, circulating currents in core or tank.
T2
Thermal Fault 300 – 700 °C
Mid-temperature thermal — overloaded winding sections, blocked oil ducts, loose contacts.
T3
Thermal Fault > 700 °C
High-temperature thermal — severe local hot spot, oil flash, lead failure inside the tank.
DT
Mixed Thermal & Electrical
Combined fault signature — usually a thermal event evolving into discharge or vice versa.
Stop Filing DGA Reports in a Spreadsheet
OxMaint logs every quarterly sample against the transformer, the sample valve, the lab, the seven gases, the IEEE C57.104 status, and the Duval Triangle fault zone — and trends them across years so a developing fault jumps off the screen before it crosses Status 3.
The Sampling Procedure — Step by Step
A bad sample produces worse-than-useless data: it generates false alarms, masks real faults, and undermines the credibility of the entire DGA program. ASTM D3613 specifies gas-tight syringes and glass containers for a reason — hydrogen and carbon monoxide have low solubility in oil and escape easily into atmosphere if the sampling chain is imperfect. This sequence is the working order every certified sampler follows in the field.
01
Safety & Permits
Lockout/tagout per OSHA 29 CFR 1910.147 where applicable. NFPA 70E PPE for the voltage class. Confirm transformer is energised under stable load — DGA on an unloaded unit gives misleading equilibrium readings.
02
Verify Positive Pressure
Never sample a unit under vacuum — drawing oil from a unit in negative pressure can pull air in through the same valve. Confirm positive pressure on the gauge, not just by visual inspection. Use ASTM D1933 Type III nitrogen to repressurise if needed.
03
Clean the Sample Valve
Wipe down the drain valve externally and, where possible, internally. Loose contamination from the valve body is the most common source of misleading DGA results. Use lint-free wipes and approved solvent.
04
Flush the Valve Line
Open the valve and flush 2 – 3 litres of oil into a waste container before taking the sample. This clears stagnant oil from the valve dead leg and ensures the sample represents the bulk oil inside the tank.
05
Fill the Gas-Tight Syringe
Attach the 50 ml gas-tight glass syringe via Luer-lock to clean tubing. Open the bleeder valve, draw oil slowly to avoid bubble formation. Fill above the 50 ml mark, then expel air and surplus oil until exactly 50 ml remains with no headspace.
06
Seal, Label, and Log
Close the syringe stopcock to the syringe-side position. Label with asset ID, sample point, date, time, oil temperature, top oil temperature, load at sample time, and sampler name. Photograph the labelled syringe and log directly into the CMMS at the asset record.
07
Ship to Accredited Lab
Ship within 48 hours in protective packaging away from temperature extremes and direct sunlight. Use an ISO/IEC 17025-accredited lab running ASTM D3612 or IEC 60567 gas extraction methods for results that hold up in audit and warranty disputes.
The CMMS Record — What Every Sample Must Capture
The lab returns ppm values. The CMMS turns those values into a decision. Every quarterly DGA sample needs the same field set captured against the transformer — and missing fields are the reason most plants cannot trend their own DGA data across years. This is the minimum capture set every OxMaint DGA work order enforces by default.
Sample Metadata
Date, time, sampler name, sample valve identifier, oil temperature at sampling, top oil temperature reading, load in MVA at the time of sampling, ambient temperature.
Lab & Method
Lab name, ISO/IEC 17025 accreditation number, extraction method used (ASTM D3612A / B / C), instrument and calibration date, certificate of analysis reference number.
Seven Gas Concentrations
H₂, CH₄, C₂H₆, C₂H₄, C₂H₂, CO, CO₂ each in ppm. Plus oxygen and nitrogen for sealing-system integrity verification.
Interpretation Outputs
IEEE C57.104-2019 status (1, 2, or 3), Duval Triangle 1 fault zone, Rogers Ratio result if applied, rate-of-change versus previous sample for each gas.
Action & Sign-Off
Recommended next action (continue quarterly, increase to monthly, weekly, plan inspection, derate, isolate). Reliability engineer countersign with timestamp.
Status-to-Action Decision Map
The point of the program is not the data — it is the decision that follows the data. Each IEEE status level maps to a concrete response window and follow-up action. OxMaint codifies this map into the workflow so every transformer is responded to consistently, regardless of which planner the work order lands on.
Spreadsheet DGA vs. CMMS-Tracked DGA
Every plant has DGA results somewhere — on an email thread, a shared drive, a binder in the substation office. The question is whether that data is doing any work. A CMMS-tracked DGA program turns the lab certificates into a decision engine: every sample binds to the asset record, every gas concentration trends automatically, every status escalation generates the corrective work order at the right priority, and every quarter the audit-ready export is one click away.
Frequently Asked Questions
How often should DGA samples actually be taken?
Quarterly is the practical standard for critical and large power transformers (GSU, station service, unit auxiliary). Annual is the minimum for smaller distribution and auxiliary transformers. Frequency escalates automatically when status moves to 2 or 3 — monthly at Status 2, weekly at Status 3. Configure asset-specific cadence in
OxMaint PM scheduling.
What is the difference between IEEE C57.104-2019 and the 2008 version?
The 2019 revision simplified the four-condition table to three statuses, replaced absolute-only thresholds with statistical 90th and 95th percentiles, and added explicit rate-of-change limits. The new approach is grounded in a much larger dataset and more accurately reflects how real transformer faults develop over time.
Why is acetylene treated so differently from the other gases?
Acetylene (C₂H₂) only forms at temperatures above 700 °C — well above any normal transformer thermal condition. Any meaningful acetylene reading is direct evidence of arcing or extreme thermal damage inside the tank. Even a few ppm warrants immediate investigation; sustained or rising acetylene calls for outage planning.
Can we rely on the Duval Triangle alone for fault diagnosis?
No single method is reliable in isolation. IEEE C57.104-2019 explicitly recommends combining methods — Duval Triangle plus Rogers Ratio plus Key Gas plus rate-of-change — with operational context. The Duval Triangle is the strongest single visual tool, but interpretation near zone boundaries requires the other methods to confirm.
How does OxMaint handle Status 2 and Status 3 DGA results?
Any lab result loaded into OxMaint that triggers Status 2 or Status 3 against the IEEE C57.104-2019 table auto-generates a corrective work order at matching priority, schedules the increased sampling cadence automatically, attaches the lab certificate and Duval Triangle plot to the asset record, and routes notification to the responsible engineer. To see the workflow live,
book a 30-minute walkthrough.
Run Your DGA Program on a CMMS Built for Power Plants
OxMaint ships with pre-built sampling-point templates for GSU, unit auxiliary, station service, and station auxiliary transformers. IEEE C57.104-2019 status thresholds, rate-of-change limits, and Duval Triangle fault zones are pre-loaded. Lab certificates attach directly to the asset record, status escalations auto-create work orders, and your quarterly DGA program becomes a living asset-health system rather than a folder of orphan PDFs.