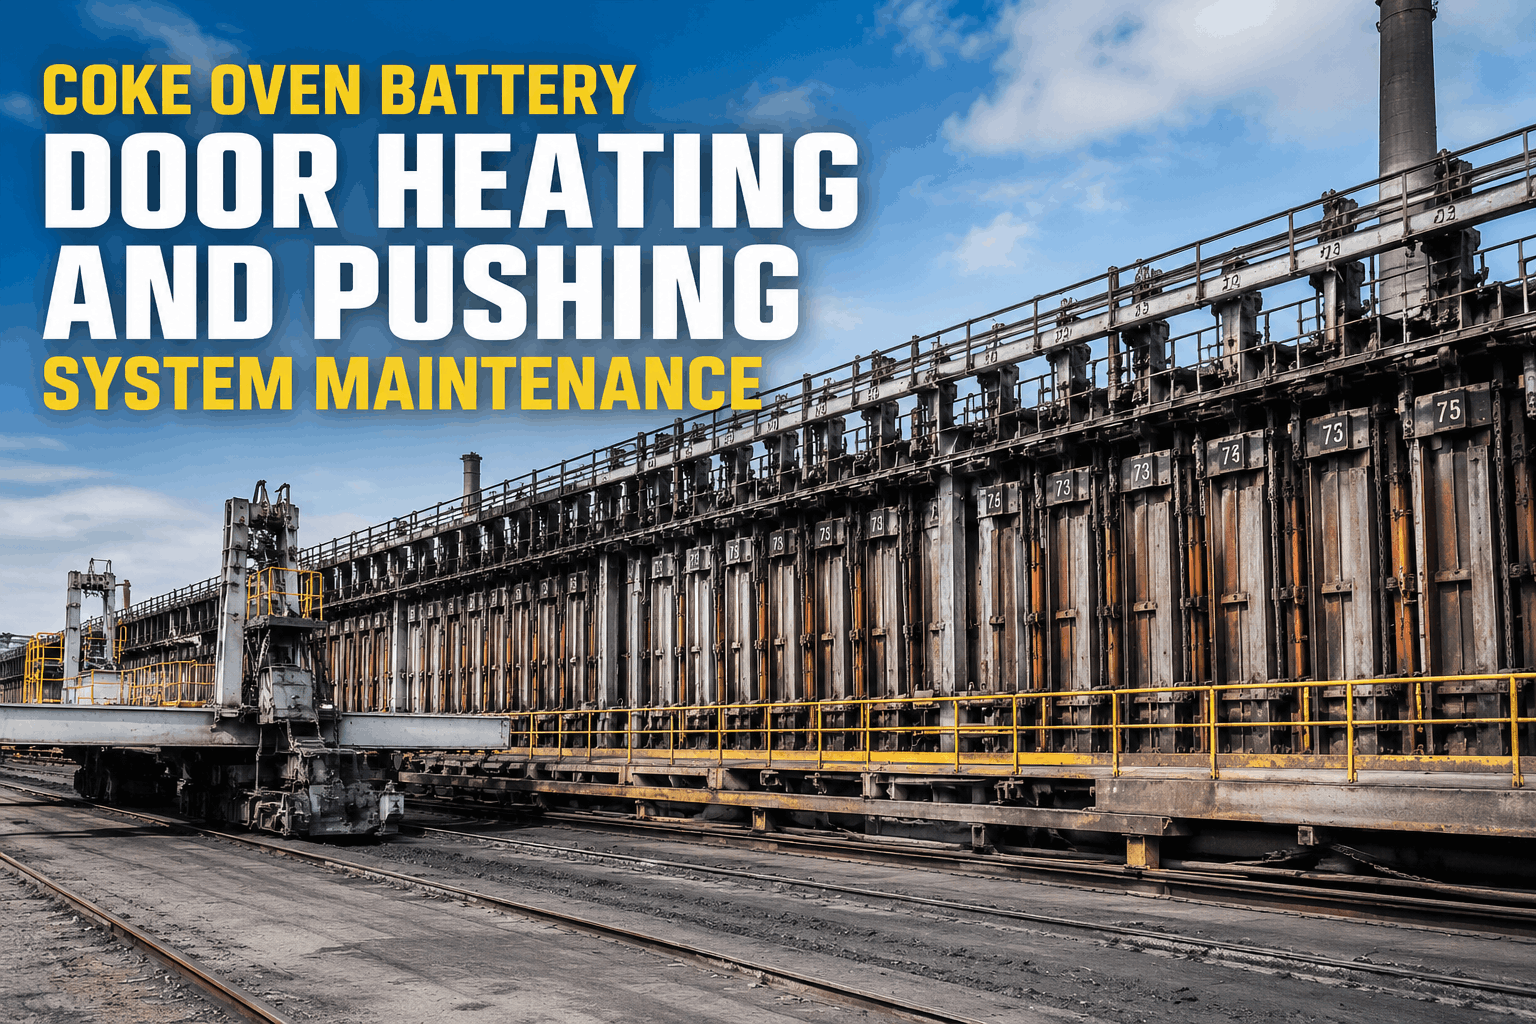
A coke oven battery is one of the most capital-intensive and operationally demanding assets in an integrated steel plant. A battery of 60–80 ovens, each operating continuously at temperatures above 1,000°C, pushing carbon-laden gases through a refractory structure that must remain gas-tight, structurally sound, and thermally balanced simultaneously — for a campaign life measured in decades, not years. The consequence of battery failure is not a maintenance event — it is a production catastrophe. An unplanned battery shutdown can halt blast furnace operations within days, triggering a cascade of production losses across the entire integrated plant that can reach £1M–£5M per day before any recovery begins. Traditional coke oven battery maintenance — monthly refractory inspections, calendar-based door servicing, reactive leak repair, and subjective visual assessment of carbonisation uniformity — was the standard for decades because no better alternative existed. That alternative now exists. Predictive analytics platforms that integrate pyrometer data, combustion gas analysis, structural health monitoring, and operational production data are enabling integrated steel plants to extend battery campaign life by 15–30%, reduce refractory repair costs by 20–35%, and convert unplanned outages into planned interventions with sufficient lead time for engineering preparation. Schedule a free coke oven battery maintenance assessment with our team and find out where predictive analytics can deliver the fastest returns in your battery operation.
The Campaign Life Challenge: Why Batteries Fail Before Their Time
Coke oven battery campaigns are designed to last 20–30 years. In practice, many batteries are shut down 5–10 years before their design campaign life — not because the refractory has exhausted its structural capacity, but because maintenance programs failed to detect and arrest the deterioration mechanisms early enough to allow economic repair. Understanding these mechanisms is the prerequisite for designing a predictive maintenance program that catches them in time.
Silica Refractory Creep and Spalling
The primary structural failure mode for silica brick batteries. Thermal cycling during abnormal operations — cold pushes, flooding incidents, extended idle periods — initiates micro-cracking that progresses to spalling and structural instability over months to years. Predictive detection of abnormal thermal profiles 4–8 weeks before visible spalling enables targeted bricking repairs that arrest the progression rather than treating only the symptoms.
Key Data Signal
Wall temperature deviation from battery average — consistent cold zones indicate progressive refractory damage
Oven Wall Gas Leakage and Overheating
Cracks in oven walls allow raw coke oven gas to leak into the heating flues, creating uncontrolled combustion zones that overheat the brick locally — often exceeding safe operating temperatures by 200–400°C. These hotspots accelerate refractory deterioration at a rate that can condemn an oven within weeks if undetected. Continuous pyrometry and gas analysis identify hotspots within hours of initiation.
Key Data Signal
Flue temperature spike above zone average combined with CO₂ ratio anomaly in adjacent flues
Door Frame Sealing Failure
Oven door frames that lose their sealing integrity allow coke oven gas to escape at the door face — a direct atmospheric emissions violation and an accelerant of refractory damage at the door jamb area. Door sealing failures that are tracked through leak count trending and repaired proactively cost a fraction of the emissions penalty and jamb brick replacement that reactive management generates.
Key Data Signal
Door leak inspection count per oven — trending increase indicates framework distortion or sealing material failure
Buckstay and Binder Structural Distortion
The steel buckstay framework that holds the battery structure under controlled compression is a critical structural component whose condition determines battery geometry. Buckstay distortion — from thermal cycling, corrosion, or inadequate tensioning — allows oven walls to move laterally, creating taper conditions that cause stuck pushes, oven wall damage, and accelerated door leakage. Laser-based geometric monitoring detects these movements before they cause operational incidents.
Key Data Signal
Pushing force trend per oven — rising push force indicates progressive oven taper from buckstay movement
Predictive Analytics Data Sources for Coke Oven Batteries
A complete coke oven battery predictive maintenance program integrates data from multiple operational and sensor sources that most batteries already generate — but rarely analyse together for maintenance intelligence. The value is in the integrated analysis, not in any single data stream.
Continuous Pyrometry — Flue and Wall Temperatures
Data frequency: Every 2–4 hours per full battery survey; real-time on instrumented flues
Temperature measurements across all heating flues and, where available, through wall pyrometry provide the most direct indication of battery thermal balance and refractory integrity. AI models trained on battery-specific temperature patterns identify cold zones (potential refractory damage), hot zones (gas leakage), and asymmetric heating profiles (combustion system deterioration) weeks before these conditions produce visible structural damage.
Flue-to-flue temperature variance
Battery average vs design temperature
Longitudinal temperature gradient
Temperature trend velocity per zone
Combustion Gas Composition Analysis
Data frequency: Per-flue sampling on rotation; automated CEMS continuous on waste gas
Flue gas CO₂, CO, and O₂ ratios indicate combustion efficiency and, crucially, leakage between the coking chamber and the heating system. Elevated CO₂ ratios in heating flues adjacent to a specific oven indicate gas leakage through cracks in that oven wall. Trending these ratios over time provides early warning of developing wall cracks that will eventually require emergency hot bricking repair if not detected.
CO₂/CO ratio per flue section
O₂ deficit — combustion completeness
Leakage indicator ratio trends
Pushing Force and Carbonisation Data
Data frequency: Every push — 20–40 data points per day per battery
The force required to push each oven is recorded by the pusher machine and carries a rich predictive signal. Rising push force for a specific oven over successive coking cycles indicates progressive oven wall convergence — the early stage of taper development from buckstay movement. Push force combined with coking time and coal moisture creates the carbonisation quality model that predicts optimal coking time for current battery thermal state.
Push force per oven — 30-day rolling average
Peak force vs duration profile
Difficult push frequency per oven
Push force trend velocity
Door and Standpipe Leak Inspection Data
Data frequency: Per-shift inspection — 3 datasets per day per battery
Regulatory emission inspections count visible door leaks, standpipe leaks, and charging lid emissions per battery per shift. While primarily a compliance metric, this data carries maintenance intelligence when analysed per oven — specific ovens with persistently high leak rates indicate framework or sealing material conditions requiring targeted maintenance intervention rather than blanket door maintenance.
Leaks per oven — 7-day rolling average
Persistent high-leak oven identification
Post-maintenance regression tracking
Structured Visual Inspection Records
Data frequency: Monthly full battery walkdown + daily condition observations
Structured digital inspection records — replacing paper-based inspection forms — capture refractory crack mapping, brick surface condition, buckstay condition, door equipment condition, and gas collection system status in a consistent, searchable format. When entered digitally in the field, this data feeds directly into the analytics platform and is compared against the inspection history for each oven and each structural zone to identify deterioration trends.
Crack density index per oven section
Repair effectiveness — post-repair condition vs pre
Inspection coverage — all ovens per cycle
Connect Every Data Stream Your Battery Already Generates to a Predictive Maintenance Engine
Oxmaint integrates pyrometry data, pushing records, gas analysis, door inspection results, and structured refractory assessments into a unified platform that automatically identifies deterioration patterns, generates prioritised maintenance work orders, and maintains the complete repair history that campaign life management requires.
Campaign Life Extension: The Maintenance Interventions That Matter Most
Battery campaign life is not a fixed engineering parameter — it is a maintenance outcome. The difference between a battery that achieves its design campaign life and one that is shut down 8 years early is almost always traceable to specific maintenance intervention decisions made or missed at specific points in the battery's history. The following interventions, executed at the right time based on predictive analytics, deliver the highest campaign life extension value.
Targeted application of plastic refractory or silica brick replacement in localised wall damage zones while the battery remains in operation (hot repair). When executed within the window identified by predictive pyrometry analysis — before the cold zone has expanded to involve more than 3–4 flue sections — hot zone grouting arrests the deterioration mechanism at minimal cost. When executed reactively after the zone has extended, the repair volume and cost multiply by a factor of 5–10 and the campaign life benefit is correspondingly reduced.
Maintaining correct buckstay tension — within 10% of design compression load — prevents the oven wall geometry drift that causes taper development, stuck pushes, and accelerated refractory damage. Predictive monitoring of pushing force trends per oven identifies individual ovens where geometry has already drifted, allowing targeted re-tensioning before the taper progresses to a level that forces oven retirement. A buckstay programme without push force analytics is calibrating without feedback.
Thermal non-uniformity within and across ovens is the single largest accelerant of refractory deterioration in a coke oven battery. AI-driven combustion optimisation — adjusting gas and air flow to each flue section based on continuous pyrometry — maintains the thermal uniformity that silica refractory requires for stable expansion behaviour. Batteries with analytics-driven combustion management achieve temperature standard deviations of ±15°C versus ±40–80°C for manually managed batteries.
Under-coking — pushing ovens before the coal mass is fully carbonised — is a major cause of difficult pushes and the wall damage they cause. Predictive coking time models that account for battery temperature, coal blend moisture, coal particle size, and charge weight calculate the actual minimum coking time required for each charge rather than applying a fixed schedule. Reducing difficult pushes by 30–50% has a measurable campaign life benefit across a battery operating 24 ovens over a 20-year campaign.
The Predictive Analytics Business Case for Battery Operators
Coke oven battery investment decisions — whether to continue a campaign, execute a major battery rebuild, or commission a new battery — are among the largest capital allocation decisions in an integrated steel plant. Predictive analytics changes the economics of all three options by providing accurate condition intelligence that reduces the uncertainty driving conservative capital decisions.
£15–45M
Average cost of a full battery rebuild — the investment that predictive analytics helps justify, defer, or avoid
£1–5M/day
Production loss cost from an unplanned battery shutdown — the primary risk that predictive monitoring mitigates
15–30%
Campaign life extension achievable from Year 1 of systematic predictive maintenance program implementation
Capital Deferral — Rebuild Postponement
Every year of campaign life extension achieved through predictive maintenance defers the £15–45M battery rebuild investment. For a battery approaching year 22 of a 25-year campaign, demonstrating through condition data that the battery can safely continue for 3–5 additional years represents a capital deferral with a net present value that typically exceeds the total cost of the predictive monitoring program many times over.
Refractory Cost Reduction
Hot zone repairs executed at the predictive trigger point — when damage is localised to 2–4 flue sections — cost £15,000–£80,000. The same repair executed reactively after the damage has extended to 10–15 flue sections costs £200,000–£600,000 and may require partial battery shutdown. Multiply this difference across 3–5 major zone repairs per decade and the predictive maintenance cost advantage reaches £2M–£4M per battery per decade.
Emissions Compliance Cost Avoidance
EPA and EU Industrial Emissions Directive penalties for visible emission exceedances — door leaks, standpipe leaks, and charging emissions — are substantial. Predictive door maintenance programs that identify high-risk doors before they fail inspection generate a compliance cost avoidance that contributes meaningfully to the business case, particularly for facilities operating near permit threshold levels.
Production Yield Improvement
Combustion optimisation enabled by continuous pyrometry analytics improves coke quality consistency — reducing the yield variance that causes blast furnace operating adjustments and associated production inefficiencies. AI-driven coking time optimisation reduces the proportion of under- and over-coked product across the charge mix, with coke quality improvements translating directly into blast furnace productivity and BF fuel rate reduction.
Key Performance Indicators for Coke Oven Battery Maintenance
Measuring battery maintenance programme effectiveness requires KPIs that capture both the operational condition of the battery and the predictive programme's contribution to campaign life management. These indicators provide the decision-support data that plant management needs for capital and operational planning.
±15°C
Target Flue Temperature Standard Deviation
Battery-wide flue temperature variance — the primary indicator of combustion system health and thermal balance. World-class batteries achieve ±15°C; batteries in deteriorating thermal condition show ±40–80°C. Every 10°C increase in standard deviation accelerates refractory creep rates measurably.
< 3%
Difficult Push Rate
Percentage of pushes requiring elevated force or operator intervention — the most direct operational indicator of oven geometry condition. Rising difficult push rate on specific ovens predicts buckstay and taper problems before they become emergency oven retirements. Industry best practice is below 3% across the battery.
< 2%
Door Leak Rate (Regulatory)
Visible door leaks as a percentage of total doors observed per shift — the primary regulatory compliance metric. Predictive door maintenance targeting high-risk doors identified from trending inspection data maintains compliance at lowest intervention cost rather than conducting blanket door maintenance on fixed schedules.
Hot Zone Repairs — Planned vs Emergency
> 85% planned
Share of refractory repairs executed as planned interventions versus emergency responses — programme maturity indicator
Average Coking Time vs Design
Within ±4%
Actual coking time versus model-calculated optimum — wide deviation indicates combustion system or coal blend problem requiring investigation
Ovens Retired (Campaign)
Declining trend
Cumulative oven retirements per campaign year — rising retirement rate indicates programme is not catching deterioration early enough
Inspection Coverage Rate
100% per cycle
All ovens inspected within the scheduled inspection cycle — missed inspections create blind spots that allow deterioration to progress undetected
Every Data Point Your Battery Generates Is a Maintenance Decision Waiting to Be Made
Oxmaint gives coke oven battery operators the maintenance platform to connect pyrometry records, pushing data, gas analysis, and inspection findings into a single view of each oven's condition — generating predictive maintenance work orders, tracking repair histories, and providing the campaign life intelligence that capital planning decisions require.
Frequently Asked Questions
01
How much campaign life extension is realistically achievable from predictive analytics on an existing battery?
The extension achievable depends critically on the starting condition of the battery and when predictive analytics is implemented relative to the deterioration cycle. For a battery in the first 15 years of its campaign, implementing predictive analytics at that point and executing all maintenance interventions at the optimal timing identified by the analytics typically delivers campaign life extensions of 15–30% relative to industry-average outcomes — equating to 4–8 additional years on a 25-year design campaign. For a battery that has already experienced significant reactive deterioration — where multiple major zones have been allowed to progress beyond optimal repair timing — predictive analytics can still arrest further deterioration and extend the remaining campaign life by 3–6 years, but it cannot reverse damage already done. The most important finding from operator experience is that predictive analytics implemented early in the campaign delivers compounding returns — each timely repair prevents the accelerating deterioration that makes subsequent repairs more expensive and less effective. Starting the predictive programme at year 5–8 of a battery's campaign, rather than year 18–20, is the decision that delivers the maximum campaign life and cost benefit.
02
What data does a coke oven battery need to support a predictive maintenance program?
Most operating coke oven batteries already generate the primary data streams required for predictive analytics — the gap is typically in how that data is collected, stored, and analysed rather than in data availability. The minimum viable dataset for a meaningful predictive program includes: flue temperature measurements (manual or automated pyrometry) recorded per oven and per flue group with timestamps; pushing force records from the pusher machine (many modern pusher machines already log this data electronically); door leak inspection records captured per oven per shift; and a structured refractory inspection record updated at minimum monthly. With these four data streams, an analytics platform can identify most of the high-value predictive signals — cold zone development, push force trends, door condition deterioration, and refractory progression patterns. Gas composition analysis per flue section, automated continuous pyrometry, and pusher machine data integration add significantly to the predictive capability but are not prerequisites for beginning a programme. The principle is to start with the data available and build capability progressively rather than waiting for complete sensor instrumentation before beginning analysis.
03
How does a CMMS support coke oven battery maintenance and campaign life management?
A maintenance management system plays several distinct roles in a coke oven battery programme that go beyond basic work order management. It maintains the oven-level maintenance history — every hot bricking repair, grouting operation, buckstay adjustment, door replacement, and standpipe repair — in a structured format that allows the analytics engine to correlate maintenance actions with subsequent condition trends. This correlation is what makes the predictive model progressively more accurate: if grouting in zone 14 of oven 42 resulted in temperature recovery within 3 weeks, that outcome is recorded and informs how the model interprets future zone 14 temperature trends. It manages the inspection schedule — ensuring that no oven misses its scheduled inspection within the cycle, with overdue alerts that prevent the accumulation of inspection gaps that allow deterioration to go undetected. It generates and tracks work orders for predicted interventions with sufficient lead time — typically 2–6 weeks — for the refractory engineering team to procure materials and schedule the repair during an appropriate production window. And it provides the campaign life management reporting that plant management, corporate engineering, and financial planning need: cumulative oven retirements, maintenance cost trend per oven, repair effectiveness metrics, and the condition-based campaign life forecast that determines whether a battery rebuild or continuation is the optimal capital decision.
04
What are the most common reasons coke oven battery predictive maintenance programs fail to deliver expected results?
The most common failure mode is not technical — it is organisational. Predictive analytics programs that generate accurate predictions but where the maintenance team does not act on them within the required intervention window deliver no campaign life benefit, regardless of how sophisticated the analytics are. This typically occurs when there is no governance framework defining who is responsible for reviewing predictive alerts, what authority they have to prioritise predicted interventions over routine planned work, and what the escalation path is when predicted interventions are deferred. The second most common failure is data quality degradation over time — inspection records become less detailed, pyrometry measurements are taken less rigorously, and pushing force data is not captured consistently. Predictive models trained on high-quality data produce degraded outputs when fed inconsistent or incomplete data, which then erodes confidence in the system and further reduces data quality in a deteriorating cycle. The third failure mode is insufficient integration between the predictive analytics platform and the maintenance management system — predictions sit in a separate dashboard that is consulted occasionally rather than automatically generating work orders in the system that maintenance teams use daily. Preventing these failure modes requires: a defined governance framework for alert review and response, data quality monitoring with alerts for missing or inconsistent inputs, and direct integration between the analytics platform and the CMMS work order system.