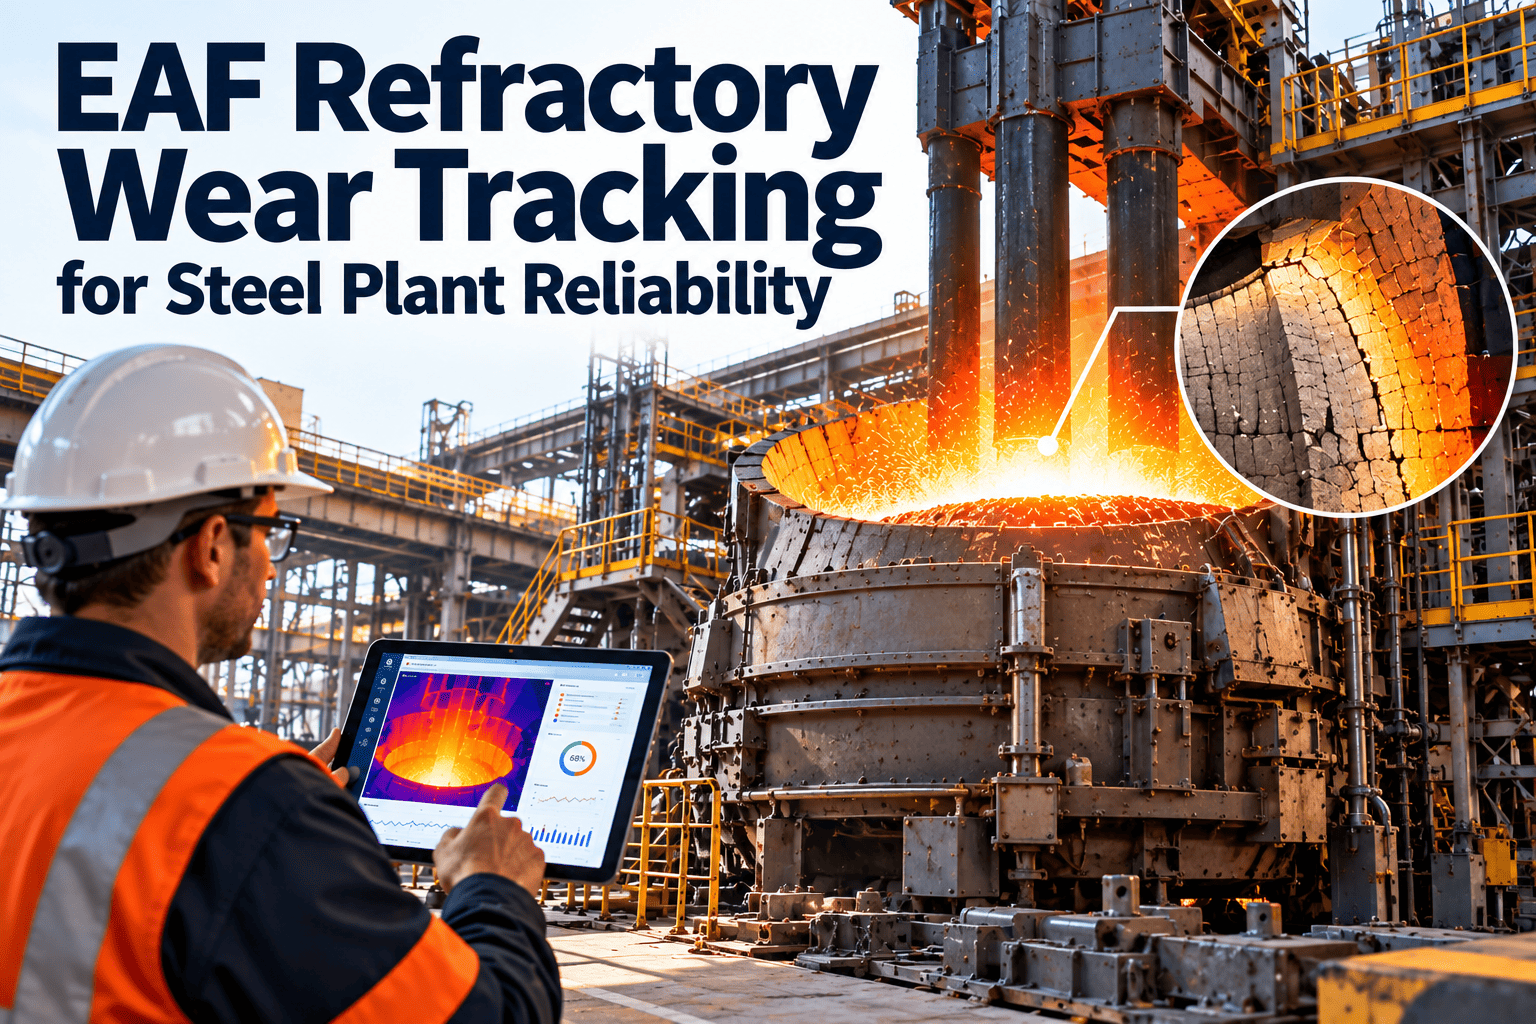
An electric arc furnace lining does not wear evenly. The slag line takes chemical attack from molten slag at roughly 1,600°C plus mechanical erosion from bath agitation, while the hearth and roof degrade on entirely different curves driven by different mechanisms. A plant that tracks refractory life as a single heat counter for the whole vessel is making a decision it does not realize it is making — reline the entire lining early and waste good sidewall or hearth life, or run the fastest-wearing zone to failure and risk a shell breach. Zone-level tracking that ties heat count, inspection findings, and thermal condition to a specific location inside the furnace is what turns that guesswork into a planned campaign, using data most EAF operations already collect in some form. The record below explains how to build that tracking discipline, and how a CMMS such as OxMaint keeps it running without relying on a whiteboard tally or a paper hot-spot log that only one shift ever reliably updates.
EAF Refractory Wear Tracking by Zone, Heat Count, and Thermal Condition
Turn a single-counter lining record into a zone-by-zone campaign plan that catches slag line, taphole, and roof wear before it becomes an emergency reline.
One Heat Count for the Whole Lining Hides Where the Wear Actually Is
A whiteboard or spreadsheet heat counter treats the entire EAF lining as one component. In practice, the slag line can reach a critical thickness at heat 500 while the hearth and lower sidewall still have hundreds of heats of usable life left. Without a zone breakdown, the maintenance team has only two options — reline the whole furnace early and waste the zones that were still fine, or run the fastest-wearing zone until it becomes an emergency.
Zone-level tracking removes that binary choice by giving each wear zone its own wear rate, its own inspection cadence, and its own projected end-of-life, so gunning and patching can be targeted to exactly where the furnace needs it. It also changes how a reline decision gets made in the first place — instead of a single yes-or-no question of whether the furnace is due, the question becomes a set of independent yes-or-no questions, one per zone, each backed by its own measurement history rather than a shared guess.
This distinction matters most during the transition from a paper-based or spreadsheet tracking method to a digital one, since that transition is where most programs stall out before ever producing a usable wear-rate trend. Many plants already have most of the raw data — hot spot walk logs, gunning material usage records, and periodic thickness checks — scattered across shift logs, maintenance notebooks, and refractory vendor reports. The work of building a zone-level program is less about collecting new information than about consolidating what already exists into a single, consistently structured record tied to a fixed zone map, so that a wear-rate trend can actually be calculated instead of reconstructed by memory at the next reline planning meeting.
Where an EAF Lining Actually Wears
Matching Measurement Frequency to Actual Wear Behavior
| Zone | Typical Wear Rate | Measurement Method | Inspection Cadence |
|---|---|---|---|
| Slag Line / Sidewall | 0.8–1.5 mm per heat | Gunning thickness check, laser profile scan | Every 25–50 heats |
| Taphole / EBT | 1.2–2.5 mm per heat | Sleeve OD measurement, visual after tap | Every tap cycle |
| Hearth / Bottom | Slow, campaign-scale | Visual and thickness probe at cold inspection | Every 100+ heats or scheduled outage |
| Roof / Delta Section | Spalling and crack-driven | Visual inspection, crack mapping | Every planned cold inspection |
| Water-Cooled Panels | Not applicable (monitored) | Infrared shell temperature scan | Every 20–50 heats |
Any shell zone reading above roughly 450°C on the external surface should trigger an immediate cooling flow check and internal inspection, regardless of where that zone sits in its scheduled cadence. Cadence should also flex with campaign stage rather than staying fixed for the whole campaign life — a zone in its first quarter of heats can usually tolerate the standard interval, but the same zone approaching its projected end-of-life window benefits from tighter measurement spacing so a sudden acceleration in wear rate is caught within days rather than at the next regularly scheduled round.
From Hot Spot Observation to Targeted Gunning
Give Every EAF Zone Its Own Wear Curve
OxMaint logs thermal scans, thickness measurements, and gunning repairs against a zone map for every furnace, so the reliability team sees remaining life per zone instead of one heat count for the whole vessel.
What a Zone-Level Repair Record Needs to Capture
A gunning or patching event that is not logged with enough detail resets the wear curve without anyone knowing how much life was actually restored. Each entry should carry the fields below, and every field matters for a different reason — the material and quantity feed cost-per-heat calculations, the pre-repair thickness anchors the next wear-rate trend line, and the technician and shift fields make it possible to trace back and ask a follow-up question if a repair does not hold up as expected.
The Five Phases a Campaign Register Should Track
Why Wear Rate Varies So Much Even Within One Zone
Two furnaces of identical design can produce very different slag line wear rates depending on operating practice, and even within a single furnace, wear rarely progresses evenly around the circumference. Understanding what drives that variation is what separates a wear-rate number that helps plan repairs from one that is simply a rough average with no diagnostic value.
Slag chemistry is usually the single largest factor at the slag line. A slag running low in basicity or high in iron oxide content is chemically more aggressive toward the lining, and a plant that trends slag chemistry alongside wear-rate data will often find that the campaigns with the fastest wear correspond directly to periods of off-target slag practice — a correlation that points maintenance toward a process fix rather than only a refractory-grade fix.
Electrode positioning and arc flare pattern explain much of the circumferential unevenness. Zones directly opposite the electrode pitch circle absorb more radiant and arc-flare heat than zones offset from it, which is why a single average thickness reading for the whole slag line so often hides a badly thinned quadrant sitting right next to material that still has plenty of life left. Scrap charging practice contributes as well — heavy or poorly distributed scrap drops can mechanically damage a freshly gunned area before the repair has had a chance to sinter properly into the working lining. Power input profile and foaming slag practice round out the main drivers, since a longer arc time at a given zone or an inconsistent foaming slag depth both change how much heat that section of lining absorbs over a given number of heats, independent of heat count alone.
Making Zone Tracking a Shared Responsibility, Not One Technician's Habit
A refractory tracking program that depends on one experienced furnace operator's personal knowledge of "how this furnace usually wears" is one shift change away from losing that knowledge entirely. Building the zone map, the wear-rate history, and the gunning log into the CMMS rather than into an individual's head is what makes the program survive staff turnover, vacation coverage, and shift rotation without a gap in continuity.
This also changes how a new hire ramps up on the furnace. Instead of learning wear patterns anecdotally over a year or more of shift experience, a new operator or technician can open the zone map on a tablet and see exactly which quadrant runs hot, how the current campaign compares to the previous one at the same heat count, and where the last three gunning repairs were applied — turning tribal knowledge into a documented, transferable record from day one.
What Zone-Level Tracking Is Actually Worth
The financial case for zone-level tracking rests on two separate savings that a single-counter approach cannot capture at the same time. The first is avoided waste — a furnace relined on a fixed calendar schedule regardless of measured condition routinely leaves usable refractory life on the table in the slower-wearing zones, because the schedule has to be set conservatively enough to cover the fastest-wearing zone's worst case. Extending campaign life even modestly by targeting gunning to where it is actually needed, rather than applying it uniformly, directly reduces refractory material consumption per ton of steel produced.
The second saving is the far larger one — avoided emergency events. An unplanned reline triggered by a shell hot spot that was not caught in time costs far more than a scheduled reline, both in direct repair cost and in the unplanned production loss of an emergency shutdown that was not built into the production schedule. A zone map that flags a quadrant approaching its minimum safe thickness weeks ahead of that point is what converts what would have been an emergency into a planned outage window, coordinated with production scheduling instead of forced on it.
Neither saving requires new capital equipment in most plants — thermal cameras, thickness gauges, and mobile devices for inspection rounds are already common on an EAF floor. The investment is in the discipline of logging every reading against a defined zone map inside a CMMS, and in the workflow that turns a threshold breach into an automatic work order instead of relying on someone to notice and remember to act on it.
Frequently Asked Questions
How many zones should an EAF campaign register track?
Can OxMaint calculate remaining life per zone automatically?
What shell temperature should trigger an inspection?
Does gunning repair reset the wear-rate calculation?
Can this same approach cover BOF, ladle, and tundish linings?
Stop Relining the Whole Furnace to Fix One Zone
Zone-level thickness tracking, thermal scan logging, gunning repair history, and campaign-phase planning — in one CMMS built to give every wear zone its own accurate remaining-life picture.