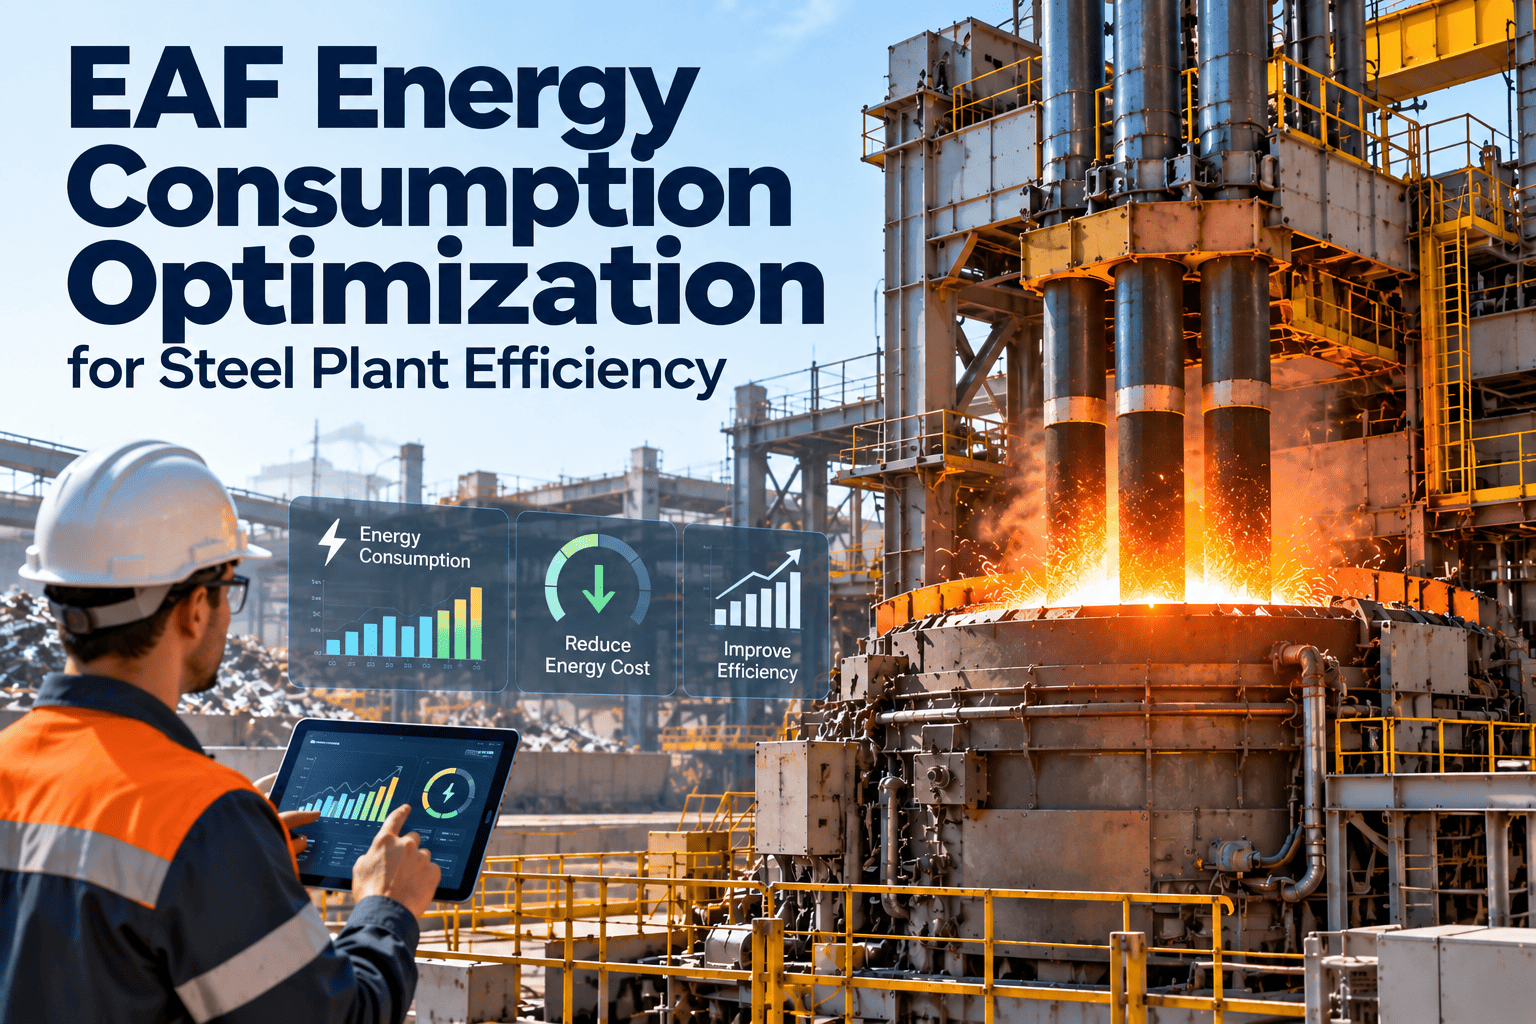
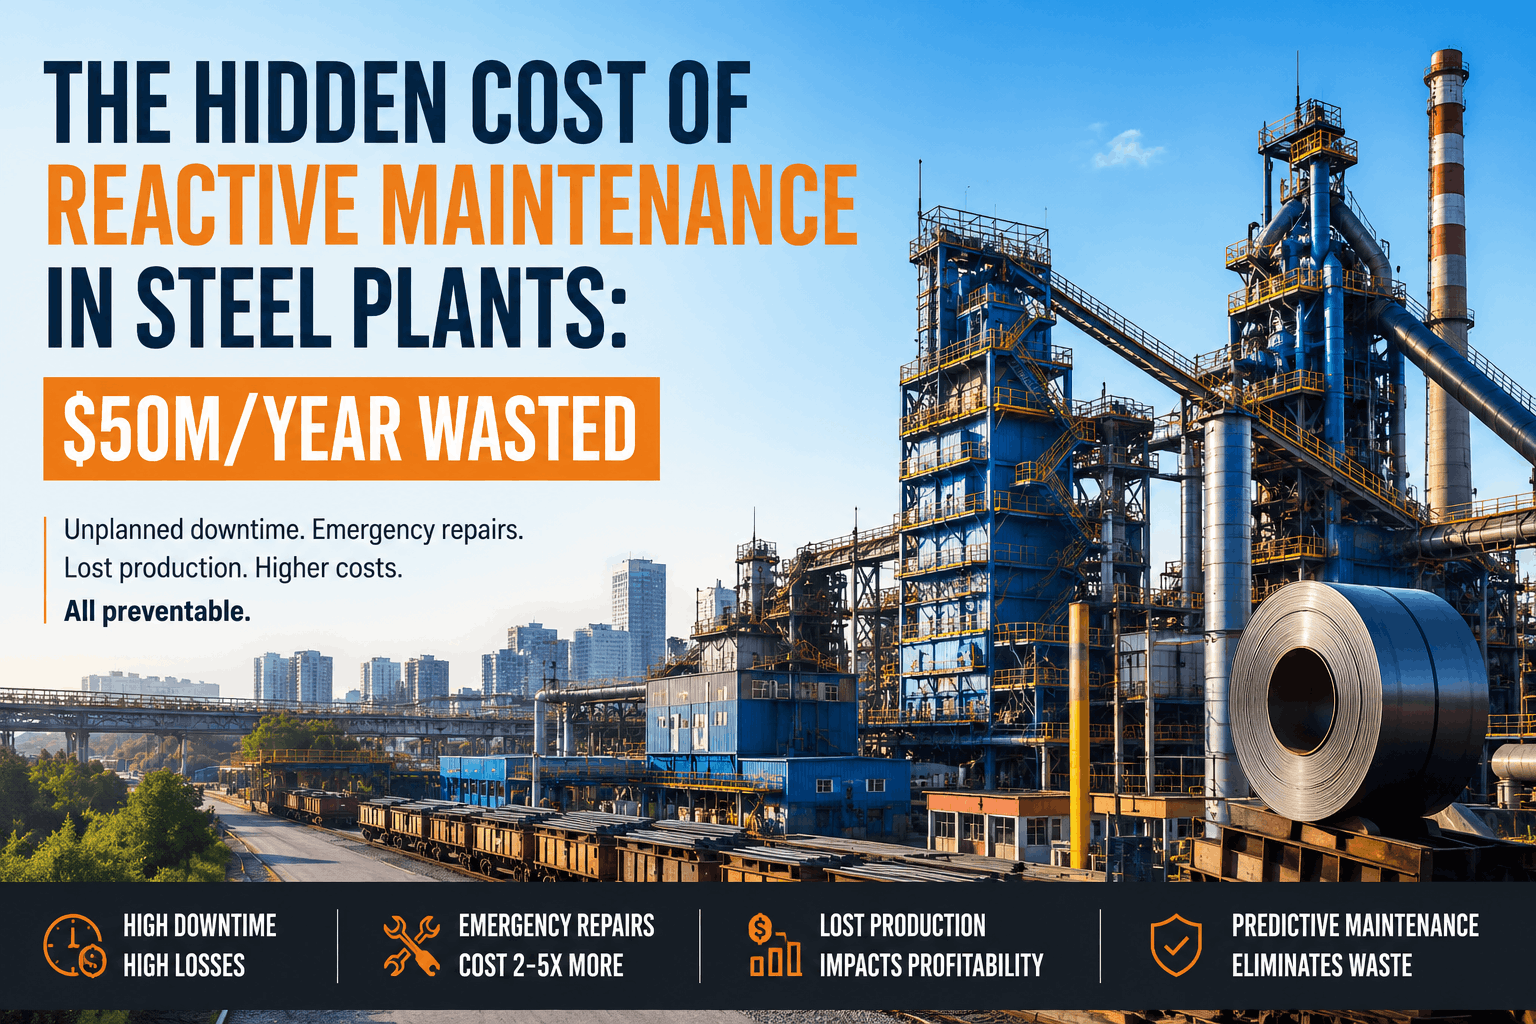
Energy is the single largest operating cost in any steel plant — typically accounting for 20–40% of total production cost depending on the process route. Yet in most facilities, energy waste is invisible until it appears on a monthly utility invoice, long after the inefficiency occurred. Poor maintenance directly drives energy overconsumption: a blast furnace with degraded refractory loses heat efficiency week by week, a rolling mill with misaligned drives wastes electrical energy every ton it processes, and a reheating furnace with clogged burners burns more fuel per tonne than it should. OxMaint's Energy and ESG Reporting platform connects maintenance records directly to energy consumption data — so every efficiency loss has a maintenance root cause, a work order, and a corrective action attached to it.
Blog · Green Steel & ESG · Energy Reporting
Energy Consumption in Steel Plants Explained
Where energy is consumed, how maintenance quality drives efficiency losses, and how modern steel plants are connecting maintenance records to energy performance monitoring.
20–40%
of total steel production cost is energy
18–25%
energy waste attributable to poor maintenance practices
$1.4M
average annual energy savings in a 1.2 MTPA plant after maintenance-linked monitoring
What This Guide Covers
01 · Major Energy Consumers
02 · Maintenance-Driven Waste
03 · Energy by Process Route
04 · Real-Time Monitoring
05 · Before vs After
06 · Expert Review
07 · FAQs
01 — Major Energy Consumers in a Steel Plant
Energy consumption in a steel plant is not evenly distributed. The blast furnace, electric arc furnace, and reheating furnaces dominate total energy draw — and they are also the assets where poor maintenance has the fastest and largest energy impact. Understanding which asset class consumes what share of plant energy is the starting point for any energy reduction programme.
01
Blast Furnace / EAF
40–55% of total plant energy
Coke rate (BF) and specific energy per heat (EAF) are the primary efficiency KPIs. Each 1% degradation in BF thermal efficiency adds ~$180K/year in fuel cost at 1 MTPA scale.
02
Reheating Furnaces
15–25% of total plant energy
Specific fuel consumption (GJ/t) is the key metric. Burner misalignment, refractory degradation, and scale buildup each independently increase fuel consumption by 5–12%.
03
Rolling Mills
10–18% of total plant energy
Drive motor energy dominates. Misaligned rolls, worn bearings, and inadequate lubrication each increase specific electrical energy per ton by 3–9%. Detectable from drive current monitoring.
04
Compressors & Utilities
8–15% of total plant energy
Compressed air leaks, pump inefficiency from worn impellers, and cooling tower fan degradation. Often overlooked but individually significant — a 1-inch compressed air leak costs $8,000–$14,000/year.
05
Oxygen & Gas Plants
5–10% of total plant energy
ASU (air separation unit) efficiency is sensitive to heat exchanger fouling. A 3°C approach temperature increase in the ASU cold box raises power consumption by 4–7%.
02 — How Maintenance Failures Drive Energy Waste
Every maintenance failure that is not caught early creates an energy waste event that compounds for days or weeks before detection. The direct link between equipment condition and energy consumption is measurable — and increasingly, it is being tracked in real time by connecting CMMS work order data to energy metering systems.
| Maintenance Failure |
Affected Asset |
Energy Impact |
Detection Method |
OxMaint Action |
| Refractory degradation |
Blast Furnace / RHF |
+8–18% fuel consumption |
Thermal imaging, shell temperature rise |
Auto PM work order — shell scan triggered |
| Burner misalignment / fouling |
Reheating Furnace |
+5–12% gas consumption |
Combustion analyzer, air-fuel ratio drift |
Burner inspection WO generated on deviation |
| Roll misalignment / bearing wear |
Rolling Mill |
+3–9% electrical energy/ton |
Drive motor current trending |
Alignment check WO on current anomaly |
| Cooling water scale buildup |
Heat Exchangers |
+6–15% pump energy |
Approach temperature, pressure differential |
Descaling PM scheduled from delta-T alert |
| Compressed air leaks |
Distribution Network |
$8K–$14K/year per leak |
Ultrasonic leak detector, flow metering |
Leak repair WO with location tagged in CMMS |
| ASU heat exchanger fouling |
Oxygen Plant |
+4–7% ASU power draw |
Approach temperature monitoring |
Heat exchanger clean WO auto-triggered |
OxMaint links every energy anomaly to a maintenance root cause and auto-generates the corrective work order — so energy waste is measured, assigned, and resolved rather than just reported. Start free or book a demo to see the energy-maintenance dashboard live.
03 — Energy Intensity by Steel Process Route
Process route is the dominant determinant of absolute energy intensity. BF-BOF (blast furnace / basic oxygen furnace) is fuel-intensive; EAF (electric arc furnace) is electricity-intensive. Maintenance quality affects energy intensity within each route — it does not determine which route consumes more, but it determines how far a plant drifts from its theoretical minimum.
BF-BOF Integrated Route
17–21
GJ / tonne of crude steel
World Best: 17 GJ/t · Industry Avg: 21 GJ/t
Blast furnace: 70–75% of route energy
BOF steelmaking: net energy recovery possible
Reheating: 1.0–1.6 GJ/t depending on RHF condition
Energy gap (maintenance): up to 4 GJ/t from best practice
EAF Mini-Mill Route
3–8
GJ / tonne of crude steel (electricity dominant)
World Best: 340 kWh/t · Industry Avg: 440 kWh/t EAF
EAF furnace: 340–440 kWh per tonne of steel
Electrode consumption: 1.2–2.0 kg/t (condition dependent)
Reheating: 0.9–1.4 GJ/t rolling reheat
Energy gap (maintenance): up to 80 kWh/t from electrode and cooling condition
04 — Live Energy Monitoring Dashboard
OxMaint's Energy and ESG Reporting module displays live energy consumption against production benchmarks for each major asset — flagging deviations that indicate maintenance-driven inefficiency before they accumulate into large losses.
Plant Energy Status — Real-Time Simulation
Reheating Furnace 1
1.08 GJ/t
Baseline: 0.95 GJ/t
+13.7% above baseline · Burner inspection due
Hot Rolling Mill
48.2 kWh/t
Baseline: 46.0 kWh/t
+4.8% — within acceptable range · PM current
Blast Furnace
490 kg coke/tHM
Baseline: 460 kg coke/tHM
+6.5% coke rate · Refractory inspection alert
Oxygen Plant (ASU)
310 kWh/t O₂
Baseline: 295 kWh/t O₂
+5.1% — heat exchanger cleaning scheduled
BF Coke Rate Alert — +30 kg/tHM above target — Refractory shell scan work order WO#4821 generated · 18 min ago
RHF-1 Fuel Efficiency — Burner block 3 air-fuel ratio deviation detected · Inspection WO#4822 assigned · 42 min ago
Rolling Mill PM Completed — Drive alignment verified · Energy draw returned to baseline · WO#4798 closed · 2 hrs ago
05 — Before vs After — Maintenance-Linked Energy Monitoring
A 1.2 MTPA integrated steel plant deployed OxMaint's energy-maintenance correlation monitoring across its reheating furnaces, blast furnace, and rolling mills. The results at 12 months show how closing the gap between energy data and maintenance action reduces specific energy consumption measurably.
RHF Specific Fuel Consumption (GJ/t)
BF Coke Rate Deviation from Target (kg/tHM)
After
+9 kg/tHM avg (−76%)
Rolling Mill Electrical Energy (kWh/t)
CO₂ Intensity (t CO₂/t crude steel)
After
1.48 t CO₂/t (−23%)
Your Steel Plant's Energy Waste Has a Maintenance Root Cause — OxMaint Finds It Automatically
OxMaint connects energy metering data to CMMS asset records, identifies which assets are consuming above their efficiency baseline, and auto-generates the maintenance work order that addresses the root cause. The result is measurable energy cost reduction with a full audit trail for ESG reporting.
Expert Review
SK
Suresh Krishnaswamy
Chief Energy Officer — Integrated Flat Products, 21 years · IIT Bombay, Chemical Engineering · Certified Energy Auditor (Bureau of Energy Efficiency, India)
The conversation about energy efficiency in steel plants almost always focuses on process technology — PCI rates, oxygen enrichment, waste heat recovery. What gets far less attention is the maintenance gap: the difference between a blast furnace running at its design thermal efficiency and one running 6% above target coke rate because the stave cooler inspection was skipped two quarters ago. In my experience, 15–20% of the energy gap between a plant's actual and theoretical minimum performance is attributable to maintenance-driven degradation that nobody has linked to the energy meter. Platforms like OxMaint that connect the CMMS work order record to the energy consumption trend are doing something genuinely new — they make the maintenance-energy linkage visible and correctable instead of invisible and accumulating.
Frequently Asked Questions
What is the typical specific energy consumption for a modern BF-BOF steel plant?
World-class BF-BOF integrated steel plants operate at 17–19 GJ per tonne of crude steel. Industry average in developing markets is 20–24 GJ/t, with poorly maintained plants exceeding 26 GJ/t. The gap between world-best and industry average represents a fuel cost difference of $40–$80 per tonne of steel at current natural gas and coking coal prices. A significant portion of this gap — typically 15–20% — is addressable through maintenance-linked energy monitoring rather than capital investment in new technology.
OxMaint's Energy Reporting module tracks your plant's GJ/t trend in real time against configurable baselines.
How does burner maintenance affect reheating furnace fuel consumption?
Burner condition directly determines combustion efficiency in a reheating furnace. An air-fuel ratio drift of just 3–5% above stoichiometric increases gas consumption by 8–12% per heat cycle — a loss that is invisible until the monthly gas invoice arrives. Nozzle fouling reduces flame temperature uniformity, forcing longer soak times to achieve target temperature and increasing specific fuel consumption by 5–8%. OxMaint auto-generates burner inspection work orders when combustion analyser data shows air-fuel deviation — typically recovering 10–18% of excess fuel consumption within weeks of corrective action.
Book a demo to see the burner monitoring workflow.
Can OxMaint connect to existing energy metering systems in a steel plant?
Yes. OxMaint connects to existing energy metering infrastructure via OPC-UA, MQTT, Modbus TCP, and direct historian connectors for OSIsoft PI and Wonderware. Gas flow meters, electricity meters, and thermal measurement points feed directly into OxMaint's Energy Reporting module without requiring hardware replacement. The system compares live consumption readings against production-normalised baselines (GJ/t, kWh/t) and flags deviations that exceed configurable thresholds — automatically linking anomalies to the relevant asset record and generating a maintenance investigation work order.
Start a free trial to connect your first energy data source.
How does OxMaint support ESG and carbon reporting for steel plants?
OxMaint's Energy and ESG Reporting module calculates Scope 1 CO₂ intensity (tonne CO₂ per tonne of crude steel) from live energy consumption data — using configurable emission factors for natural gas, coking coal, electricity, and process gases. Every corrective maintenance action that reduces energy consumption is automatically linked to its CO₂ impact, creating an auditable record of emissions reductions by asset and time period. This documentation supports ISO 50001 compliance, CBAM (Carbon Border Adjustment Mechanism) declarations, and corporate ESG disclosures without manual data assembly.
Book a demo to see the ESG reporting module.
Every GJ/t Above Your Target Is a Maintenance Problem Waiting to Be Found
OxMaint's Energy and ESG Reporting platform connects your steel plant's energy meters to its maintenance records — making efficiency losses visible, attributable, and correctable before they accumulate into quarterly fuel cost overruns. Start with a free account or book a 30-minute walkthrough configured for your process route.