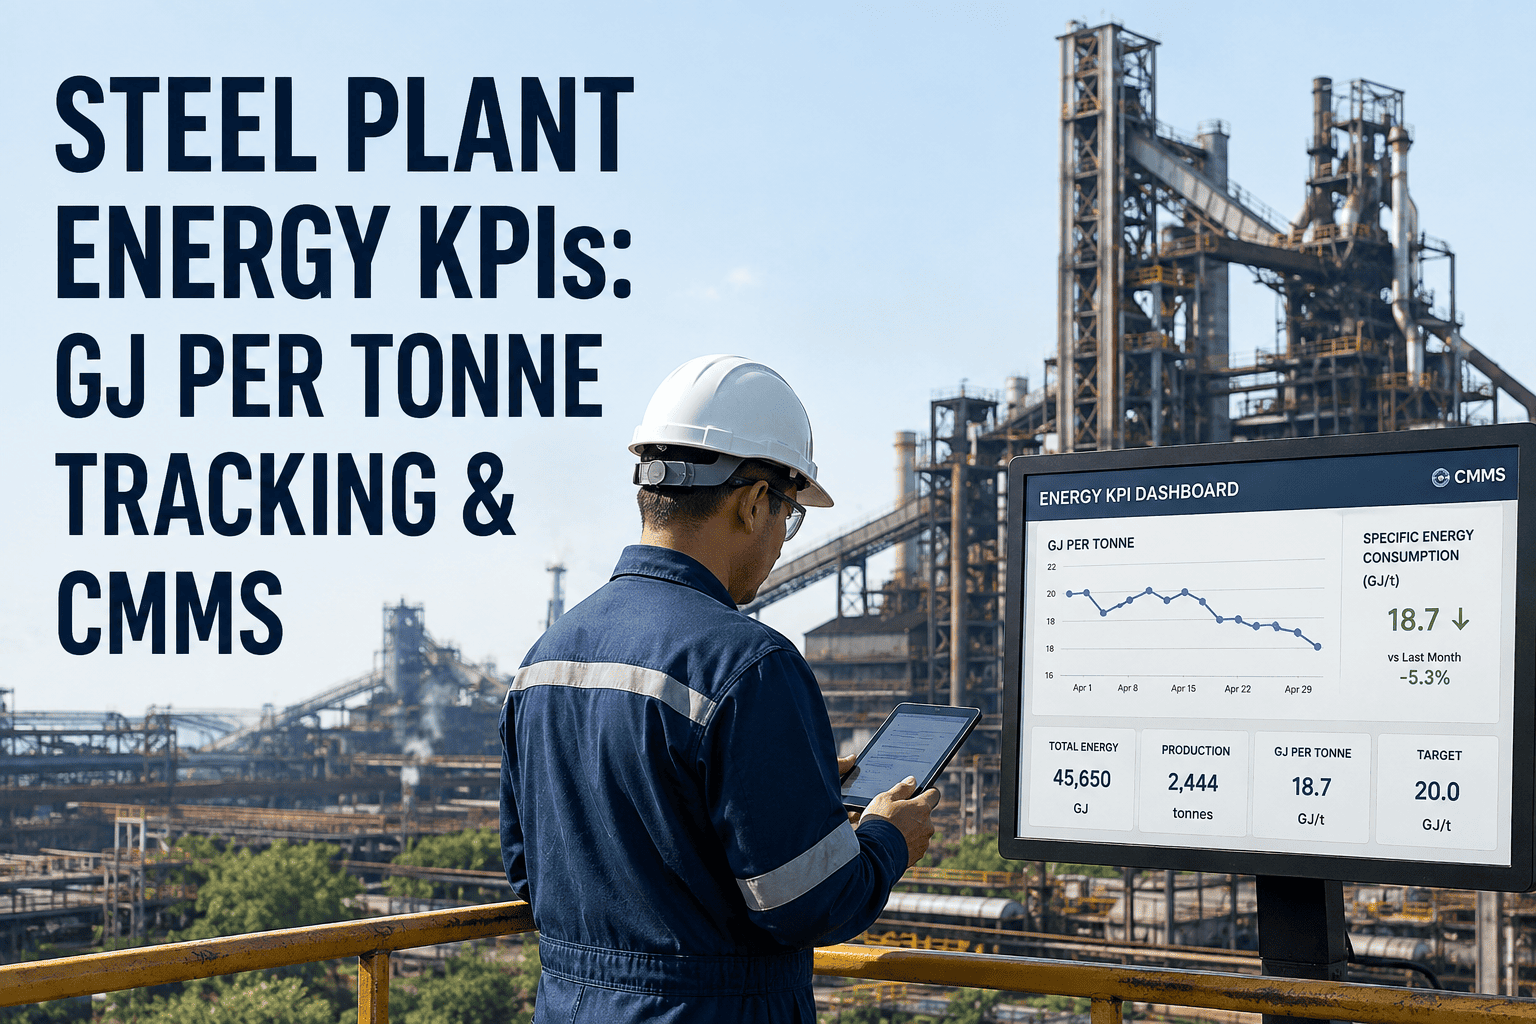
Electricity is one of the largest controllable costs in an electric arc furnace shop, yet energy per tonne is often reviewed as a finance number rather than a maintenance signal. A worn cooling circuit, an air leak in the off-gas duct, a slow regulator or an hour of avoidable power-off all show up in the same kilowatt-hour total. This article explains how to optimize EAF energy consumption by connecting electricity data with output, downtime and equipment condition, and how OXMAINT AI turns those findings into scheduled work.
EAF Energy Consumption Optimization for Steel Plant Efficiency
Every kilowatt-hour that does not become melted steel is a loss with a cause. Find the causes in maintenance records, fix them on schedule, and watch energy per tonne respond.
Where EAF Energy Actually Goes
| Loss path | What drives it | Maintenance link | Signal to watch |
|---|---|---|---|
| Power-off time | Waiting on repairs, charging delays, electrode events | Breakdowns and slow corrective work | Minutes of delay per heat by cause |
| Cooling water heat | Panels, roof and cables absorb heat continuously | Scaling, poor flow, panel leaks | Water temperature rise per circuit |
| Off-gas heat | Hot gas leaves through the duct system | Duct leaks, damper faults, false air ingress | Off-gas temperature and fan load trend |
| Electrical losses | Cables, bus, transformer and reactor performance | Loose connections, degraded contacts, cooling faults | Thermal readings, power factor, current imbalance |
| Radiation and door losses | Open slag door, damaged roof, refractory wear | Refractory inspection and repair timing | Shell temperature, door open time |
| Auxiliary consumption | Fans, pumps, compressors, hydraulics | Leaks, fouled filters, worn motors | Specific power of each auxiliary system |
Why Energy Losses Hide in Maintenance Records
- Energy teams see the total but rarely the equipment condition behind a change
- Maintenance teams see the repair but rarely the kilowatt-hours it affected
- Operators note delays in shift logs that are not searchable by asset
- Small, chronic faults such as a leaking damper or a fouled cooling circuit never trigger an alarm, so they persist for months
- Seasonal effects, such as warmer cooling water in summer, blur the trend unless conditions are recorded
Measure Energy per Tonne So It Can Be Trusted
Use one clock
Separate power-on and power-off
Normalize the inputs
Tie readings to assets
See Which Maintenance Condition Is Costing You Energy
Bring energy readings, downtime causes and work orders into one clear view for your melt shop team.
The Tap-to-Tap Sequence and Its Energy Risks
Why the Turnaround Matters
- The furnace loses heat while it waits, so each avoidable pause raises energy for the next heat
- Delays caused by equipment faults are recorded in different places depending on the crew
- Consistent delay coding turns anecdotes into a ranked list of maintenance priorities
- Planned repairs done during an existing stop cost less energy than a mid-heat failure
Six Equipment Areas to Inspect for Energy Waste
Electrodes and regulation
Cooling water circuits
Off-gas and fume extraction
Refractory and shell
Electrical path
Compressed air and utilities
Metering and Data Quality Checklist
Common Mistakes in EAF Energy Programs
Analysis mistakes
- Comparing months with different scrap mixes as if they were equal
- Ignoring power-off energy in the headline figure
- Using averages that hide poor shifts
- Treating a one-time improvement as a trend
Maintenance mistakes
- Fixing symptoms without recording the cause
- Leaving energy-related tasks outside the PM schedule
- Skipping follow-up checks after a repair
- Deferring cooling and duct work because no alarm sounded
Maintenance Conditions That Inflate Energy Use
| Symptom | Likely maintenance cause | First check |
|---|---|---|
| Energy per tonne rises, no obvious delays | Cooling circuit fouling, refractory wear, false air in the duct | Water temperature rise, shell temperature survey, duct inspection |
| Current swings and unstable arc | Slow regulator, electrode or joint problems | Regulator response test, column and joint inspection |
| High power factor penalty or poor power quality | Compensation or reactor equipment problems | Thermal scan, capacitor and reactor status |
| Fan power up with no change in output | Blocked filters, damper faults, leakage | Differential pressure and damper position checks |
| Compressor energy up on quiet shifts | Air leaks or poor load control | Leak survey and load profile review |
| Long turnarounds | Tap-hole, tilt or fettling equipment faults | Delay codes and repair history |
Auxiliary Loads Belong in the Same Report
Furnace-side energy
- Main transformer and reactor
- Electrode regulation and positioning
- Burners, lances and injection systems
- Water-cooled panels and roof
Auxiliary energy
- Fume extraction fans and filters
- Cooling water pumps and towers
- Compressed air systems
- Hydraulic power units and ladle heating
Turning Findings Into Preventive Tasks
| Finding | Preventive task | Suggested basis for interval |
|---|---|---|
| Recurring duct leak | Seal and damper inspection | Leak history and shutdown windows |
| Cooling temperature rise trend | Circuit flushing and flow verification | Water quality and scaling history |
| Repeated hot connection | Thermal scan and tightening | Load level and past failures |
| Compressed air leaks | Scheduled leak survey and repair | Leak count from earlier surveys |
| Long tap-hole repair times | Tap-hole equipment inspection | Operating hours and delay history |
Link Downtime, Output and Energy
- Energy analyzed monthly by the energy team
- Downtime coded loosely by operators
- Maintenance work tracked by another group
- Causes debated without shared facts
- Energy compared by shift, crew and grade
- Delay causes chosen from a fixed list
- Work orders attached to the delaying asset
- Actions reviewed against the next energy trend
A Weekly Energy and Reliability Review
Monitoring and Analytics Trends in Steel Energy Management
- Plant historians and level 2 systems increasingly feed energy data to reporting tools, which shortens the time from reading to review
- Sub-metering of auxiliary systems shows waste that a single main meter hides
- Condition-based maintenance triggers can prompt an inspection when a fan, pump or compressor drifts from its normal power draw
- Digital work management makes it easier to prove that an energy action was completed and measured
- Plants that report under energy management standards benefit from consistent, traceable records
Energy KPI Scorecard for Maintenance and Operations
| KPI | Definition | Owner |
|---|---|---|
| Energy per tonne | Electrical energy divided by tonnes tapped | Melt shop and energy team |
| Power-off minutes per heat | Delay time between power-on periods | Operations |
| Delay minutes by asset | Delay time coded to a specific machine | Maintenance |
| Auxiliary energy per tonne | Fans, pumps and compressors divided by tonnes tapped | Utilities |
| Planned versus reactive hours | Scheduled work compared with breakdown work | Maintenance planning |
| Energy action closure rate | Energy-related work orders closed on time | Reliability |
Energy Management Standards and Reporting
Who Owns Which Part of the Energy Result
| Role | Contribution | Record kept |
|---|---|---|
| Melt shop operators | Charging practice, power steps, delay coding | Heat log and delay reasons |
| Maintenance technicians | Inspections, repairs, leak and thermal surveys | Work orders with findings and photos |
| Reliability engineers | Failure analysis, interval changes, spares strategy | Repeat failure reports and action plans |
| Energy and utilities team | Metering, baselines, auxiliary system performance | Energy indicators and calibration records |
| Plant management | Priorities, budgets, downtime windows | Review notes and approved actions |
A 30-60-90 Day Plan
What a Steel Plant CMMS Adds to Energy Work
- Asset registers connect meters, motors, fans and cooling circuits to their maintenance history
- Preventive maintenance covers leak surveys, filter changes, thermal scans and cooling checks
- Work orders capture delay causes and the corrective work that follows
- Dashboards and reports show planned versus reactive work beside energy trends
- Mobile inspections let technicians record readings and photos where the equipment sits
- Inventory tracking keeps the parts needed for energy-critical repairs on the shelf
OXMAINT AI does not replace the energy meter or the furnace controls. It keeps the maintenance side of the energy story organized, so findings become tasks and tasks become results.
Frequently Asked Questions
Make Energy Efficiency a Maintenance Routine
Connect readings, downtime and repairs in one place so your team fixes the causes of energy loss, not only the symptoms.