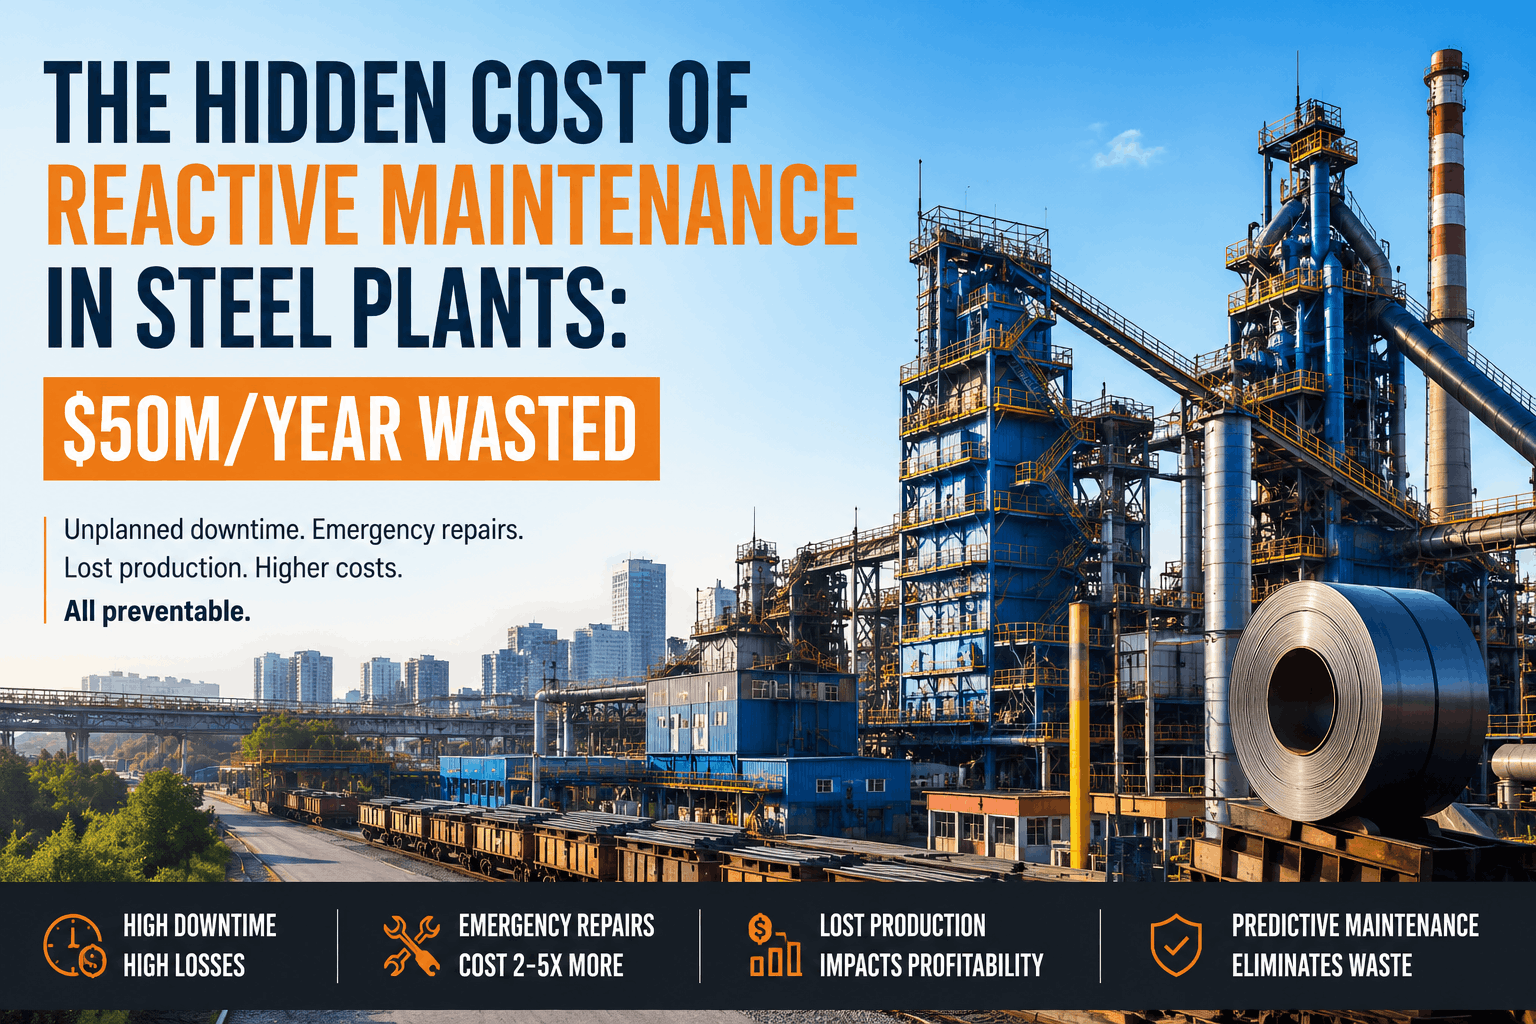
The Hidden Cost of Reactive Maintenance in Steel Plants: $50M/Year Wasted
By Alex Jordan on June 26, 2026
Reactive maintenance — the cost of waiting for failure — consumes $1.2 million or more per day in unplanned downtime at a typical 3.5 MTPA integrated U.S. steel mill. Emergency repairs cost 3–5× more than the same work performed on a preventive schedule, and when combined with production losses, the financial impact is catastrophic. Yet across North America, 55–65% of all maintenance work at average steel plants remains reactive, waiting for equipment to fail rather than predicting degradation. This article reveals the true cost structure of reactive maintenance in steel operations — from emergency premium labor and expedited parts procurement to the production losses that dwarf repair bills themselves — and demonstrates why top-tier mills have shifted to predictive strategies that detect failures 30–90 days in advance.
Steel Industry · Article · 2026
The Hidden Cost of Reactive Maintenance in Steel Plants: $50M/Year Wasted
Calculate your plant's true reactive maintenance cost, understand the cascade of emergency repair premiums, and discover why predictive maintenance strategies deliver 5–10× ROI in year one across U.S. integrated mills.
$1.2MUnplanned downtime cost per day at 3.5 MTPA mill
3–5×Cost multiplier: emergency vs. planned repair
55–65%Reactive work percentage at average North American mill
$50M+Annual wasted spend on reactive strategies vs. predictive
The Cost Cascade: How One Unplanned Failure Inflates Across the Production System
Reactive maintenance cost never appears as a single line item. It materializes as a cascade of compounding expenses — emergency labor premiums, expedited parts procurement, lost production during the repair window, overtime costs to recover schedule, energy inefficiencies while equipment degrades, and the deferred maintenance burden carried forward. A single unplanned bearing failure on a critical rolling mill drive costs $260,000–$500,000 in immediate repair and expedited parts. Add in the 18–36 hours of production stoppage during emergency replacement and diagnosis, and the true cost reaches $2–8 million in lost revenue. Top-quartile steel facilities in the U.S. — those operating with <20% reactive maintenance ratios — structure their preventive programs to eliminate this cascade entirely.
Cost Category
Reactive (Failed Equipment)
Preventive (Scheduled Work)
Emergency labor premium
Overtime @ 1.5–2× rate, 24/7 crew mobilization
Standard shift labor, planned scheduling at regular rates
Parts procurement
Expedited air freight, rush supplier surcharges, 40–60% markup
Planned inventory, standard lead times, no premiums
Downtime/production loss
18–72 hours unplanned shutdown = $50K–$350K/hour loss
Scheduled maintenance window, no production impact
$3–8 million (labor + parts + downtime + recovery)
$80K–$200K (planned PM + controlled maintenance)
Five Cost Drivers That Explode Under Reactive Conditions
Understanding the mechanics of reactive maintenance cost requires examining five specific levers that inflate during unplanned work. Each one compounds the others, and each one disappears when a steel plant transitions to preventive and predictive strategies backed by continuous condition monitoring. The cost data below reflects U.S.-based integrated mills and hot-rolling operations, documented through industry benchmarking.
Emergency Labor Multiplication
Trigger: Unplanned equipment failure during production run
Cost Impact
Overtime premiums (1.5–2× wages), rapid crew assembly, 24/7 mobilization costs. One critical gearbox failure = $40K–$80K in emergency labor alone over 48–72 hours of repair.
Expedited Parts Procurement
Trigger: Critical component unavailable in local inventory
Cost Impact
Air freight surcharges (40–60% markup), emergency supplier markups, rush manufacturing fees. Replacement bearing sourced on emergency timeline costs 2.5–3× normal procurement price.
Production Loss During Downtime
Trigger: Critical asset offline, no backup capacity available
Cost Impact
$50K–$350K per hour in lost revenue (varies by mill capacity and product mix). A 24-hour unplanned outage on a blast furnace represents $1.2–8.4 million in lost production revenue before repair costs are considered.
Cascading Secondary Failures
Trigger: Primary component failure stresses adjacent systems
Cost Impact
A failed gearbox generates misalignment forces on connected shafts, causing bearing seizure in coupled motors. One failure triggers 3–5 secondary repairs, inflating total incident cost 4–6×.
Energy Inefficiency & Degraded Performance
Trigger: Bearing wear, misalignment, increased drag during operation
Cost Impact
Energy costs account for 30–40% of steel production spend. Degraded bearings increase motor load by 8–15%, adding $50K–$150K/month in excess energy consumption on a single production line.
The Maintenance/Asset Value (RAV) Ratio: How Much Your Steel Plant Is Actually Spending
The Maintenance to Replacement Asset Value ratio measures annual maintenance spend as a percentage of total plant asset value. World-class U.S. steel facilities maintain a Maintenance/RAV ratio of 2–3%, meaning they spend $2–$3 for every $100 of asset value annually. The industry average sits at 4–5%. Reactive-dominant facilities — those with 55–65% unplanned work — exceed 6–8% Maintenance/RAV, meaning they're spending 200–400% more on maintenance than necessary. The gap isn't due to having more equipment; it's the cost multiplier on every unplanned work event.
Bottom Quartile
Maintenance/RAV 6–8%
Reactive-dominant plants, 55–65% unplanned work
Spending 3–4× more than necessary due to emergency repair premiums, expedited parts procurement, and cascading failure costs. Equivalent to wasting $20–$50M annually at a mid-size integrated mill.
Mid-Tier
Maintenance/RAV 4–5%
Mixed preventive + reactive, 40–45% unplanned work
Still above world-class benchmarks. Transition to 70%+ planned work through predictive condition monitoring typically reduces Maintenance/RAV to 3–4% within 18 months, saving $8–$15M annually.
World-Class
Maintenance/RAV 2–3%
Predictive-dominant, <20% reactive work
Continuous condition monitoring detects degradation before failures. Top U.S. mills in this tier — Gary Works (United States Steel), Nippon Steel operations — operate 88–92% planned maintenance, experiencing 1–2 unplanned downtime events per year.
Cost Opportunity
30–40% spend reduction possible
Move from reactive to predictive strategies
A $50M annual maintenance budget at a reactive-heavy mill can be reduced to $30–$35M while simultaneously improving reliability and extending asset life through preventive and predictive intelligence.
"
We were experiencing 8–12 unplanned downtime events per year — each one costing $1.2–$3M in combined labor, parts, and production loss. Within 18 months of deploying vibration monitoring and integrating predictive work orders into our CMMS, unplanned events dropped to one per year. Our maintenance/RAV ratio fell from 6.8% to 3.1%, and we've captured over $18M in avoided downtime costs while reducing maintenance headcount by 12% through elimination of reactive firefighting.
Operations Director — Integrated Steel Mill, USA, 2.1 MTPA capacity
How U.S. Steel Plants Calculate True Reactive Maintenance Cost
The formula for calculating reactive maintenance cost is straightforward but revealing. Identify all unplanned maintenance events from your work order history over a 12-month period. For each event, multiply repair cost (labor + parts) by the emergency premium factor (2.5–4× depending on whether expedited parts were required and how quickly crews were mobilized). Add production loss cost (downtime hours × your configured production loss rate per hour). Sum across all events. The result is the true annual cost of reactive maintenance at your facility — a figure that typically exceeds the budgeted maintenance spend by 40–80% and is often invisible until calculated systematically.
Reactive Cost Calculation Framework
Apply to your last 12 months of unplanned maintenance events
1
Identify All Unplanned Events (Last 12 Months)
Extract from CMMS or work order history: event date, asset, failure type, duration, and total repair cost (labor + materials + contractor fees if applicable).
Action: Export your work order data filtered for 'Unplanned' or 'Emergency' classification. Most U.S. mills average 8–15 critical unplanned events annually.
2
Apply Emergency Repair Cost Multiplier
Multiply base repair cost by 2.5–4.0× depending on emergency premium factor (expedited labor, parts, and mobilization surcharges).
Benchmark: Base multiplier 2.5× for events within 200-mile radius of mill; 3.5–4.0× for specialized repairs or remote component sourcing.
3
Calculate Production Loss Cost
Downtime hours × your facility's production loss rate per hour. For a 3.5 MTPA mill, production loss ranges $50K–$350K/hour depending on which production line failed.
Calculation: Use capacity, operating margin, and product mix. A blast furnace failure costs more ($200K–$350K/hour) than a rolling mill drive ($50K–$150K/hour).
4
Add Secondary & Cascading Costs
Secondary failures triggered by primary event, recovery labor (schedule catch-up), and customer delay penalties for late deliveries.
Adjustment: Increase total by 15–25% to account for cascading failures and recovery inefficiencies not directly attributed to primary repair.
5
Sum Annual Reactive Maintenance Cost
Total of all unplanned events with multipliers and production loss. This is your true reactive maintenance spend — often 40–80% higher than budgeted maintenance spend.
Benchmark: Reactive cost as % of total maintenance budget. U.S. mills averaging 40–60% reactive work typically find true reactive cost equals 50–75% of total annual maintenance spend.
Transition Path: Moving from Reactive to Predictive Within 18 Months
The transition from reactive to predictive maintenance is not instantaneous but follows a proven progression across U.S. steel facilities. Phase 1 (Months 1–3) focuses on deploying condition monitoring on highest-criticality assets — rolling mill drives, blast furnace blowers, continuous caster withdrawal units. Phase 2 (Months 4–9) expands monitoring coverage and integrates alerts into CMMS workflows, converting reactive alerts into scheduled preventive tasks. Phase 3 (Months 10–18) establishes predictive work order automation — degradation detected by condition monitoring automatically generates PM work orders 30–60 days before failure threshold. The cumulative result: planned maintenance ratio increases from 40–50% to 80%+, unplanned downtime drops 50–70%, and maintenance cost per tonne falls 20–35%.
Frequently Asked Questions
What is the actual cost multiplier between reactive and preventive repair?
Emergency repairs cost 3–5× base repair cost due to overtime labor premiums, expedited parts surcharges, and mobilization fees. A $100K planned bearing replacement becomes $250K–$500K when reactive, before production loss is factored in.
How much does unplanned downtime typically cost at a U.S. integrated steel mill?
$50K–$350K per hour depending on which production line failed and current product mix. A blast furnace shutdown costs $200K–$350K/hour; a rolling mill drive costs $50K–$150K/hour. A 24-hour event = $1.2M–$8.4M in direct production loss.
What is a healthy Maintenance/RAV ratio for a U.S. steel plant?
World-class U.S. mills operate at 2–3% Maintenance/RAV (spending $2–$3 per $100 of asset value annually). Industry average is 4–5%; reactive-dominant facilities exceed 6–8%, indicating waste and inefficiency in maintenance execution.
How do cascading failures inflate reactive maintenance costs?
A single gearbox failure generates misalignment forces on connected shafts, causing secondary bearing seizures and motor damage. One initial failure triggers 3–5 secondary repairs, inflating total incident cost 4–6× beyond the primary repair estimate.
What percentage of maintenance budget typically goes to reactive work in average U.S. mills?
Average North American steel plants allocate 40–60% of maintenance spend to unplanned reactive work, despite budgeting for planned preventive programs. Top-quartile mills keep reactive spend below 10–12% of total maintenance budget.
How does energy consumption increase when equipment degrades under reactive conditions?
Degraded bearings and misalignment increase motor load 8–15%, adding $50K–$150K per month in excess energy costs on a single production line. Energy accounts for 30–40% of steel production costs, making equipment condition directly tied to energy efficiency.
What is typical ROI for transitioning from reactive to predictive maintenance?
Documented ROI for predictive maintenance programs at U.S. steel plants ranges 5–10× in Year 1, climbing to 10–25× by Year 2. A $250K–$500K annual investment in condition monitoring delivers $2M–$8M in avoided downtime and cost reduction benefits within 12 months.
How does Oxmaint track and calculate avoided reactive maintenance costs?
Oxmaint's ROI dashboard tracks prevented failures in real time — each condition-based work order completed before failure is tagged as avoided downtime and repair cost is calculated versus reactive scenario, building proof of ROI automatically.
Calculate Your Plant's True Reactive Maintenance Cost Today.
Oxmaint integrates condition monitoring directly into your CMMS, converting reactive cost into predictive ROI. Free to start — see your cost savings automatically tracked.

.png)


