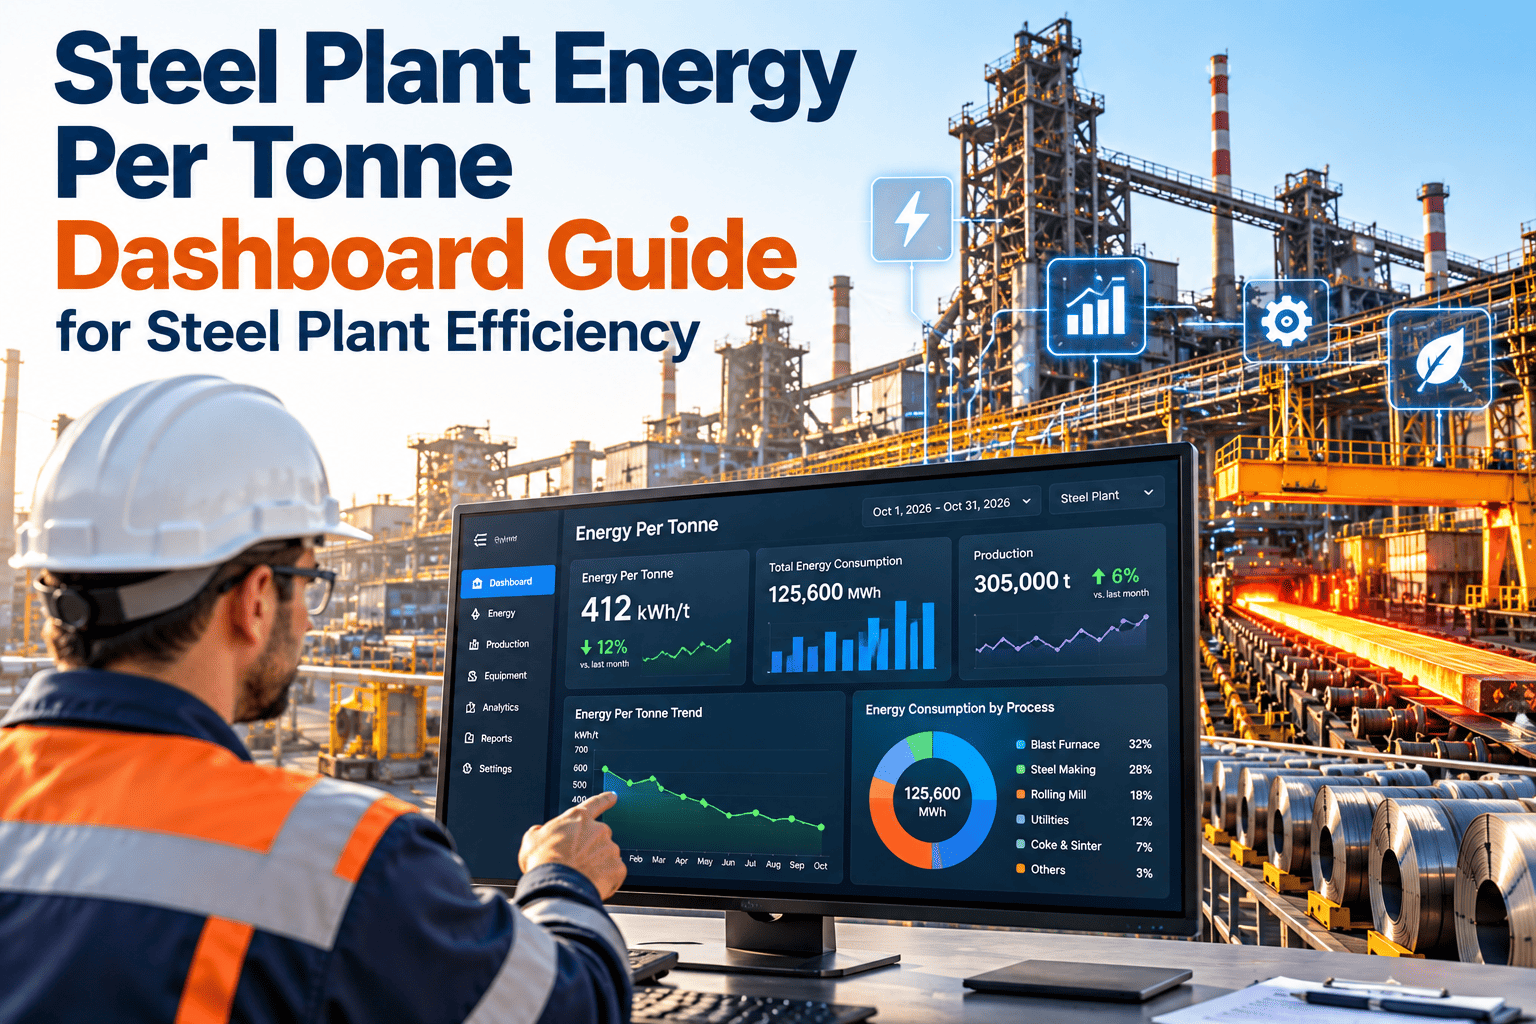
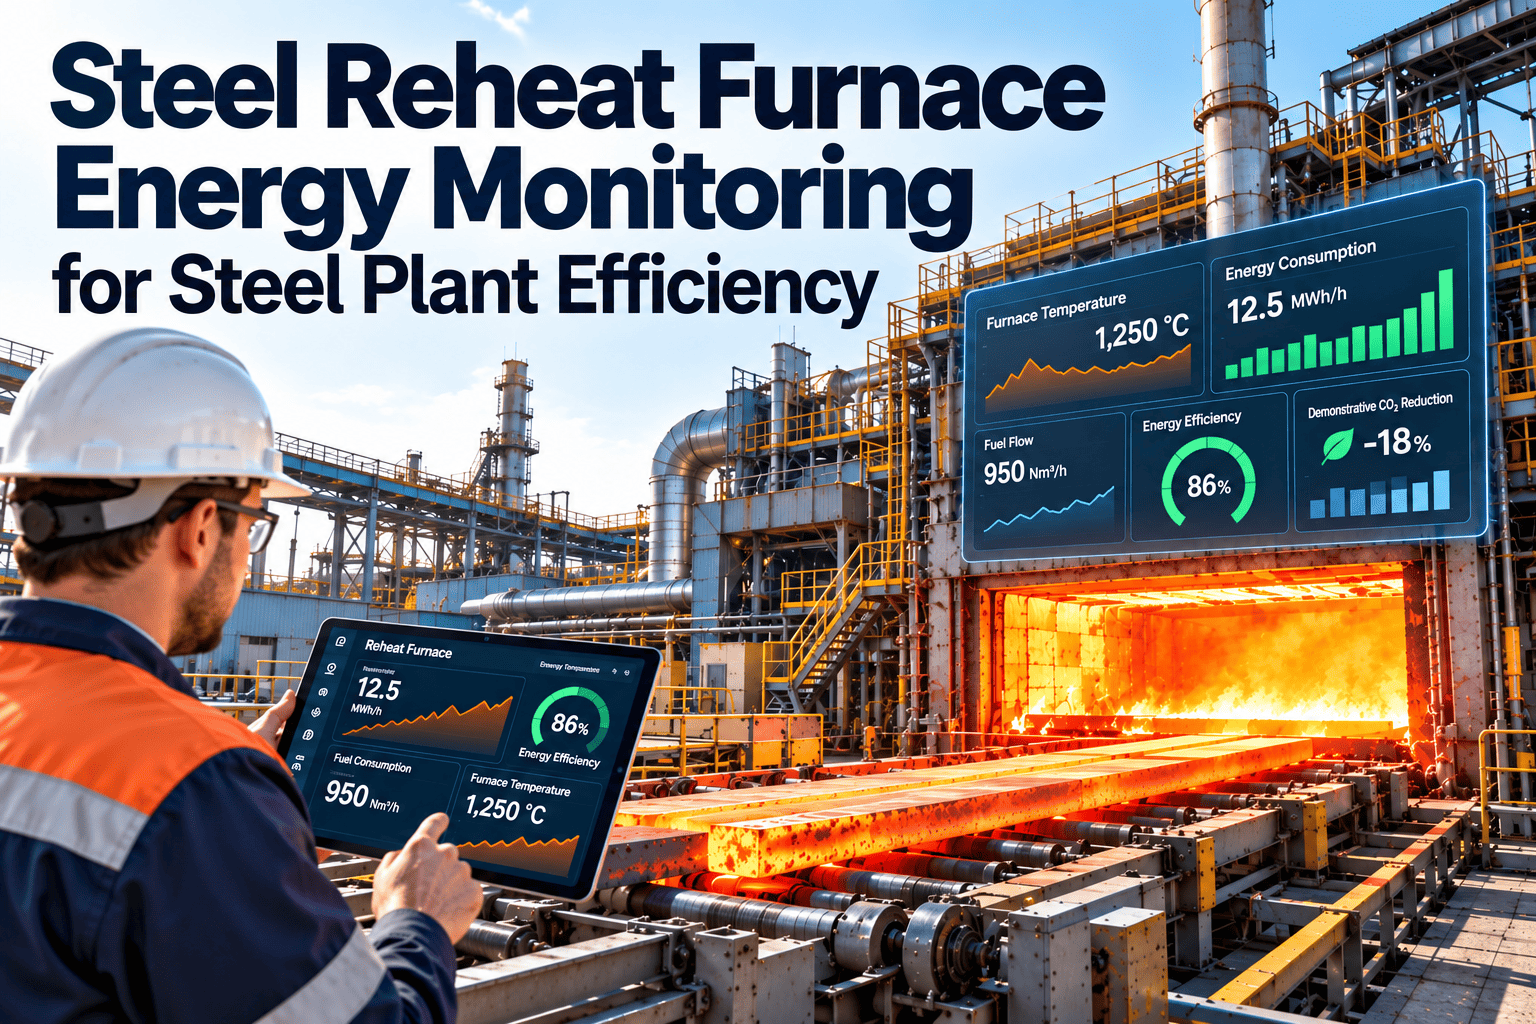
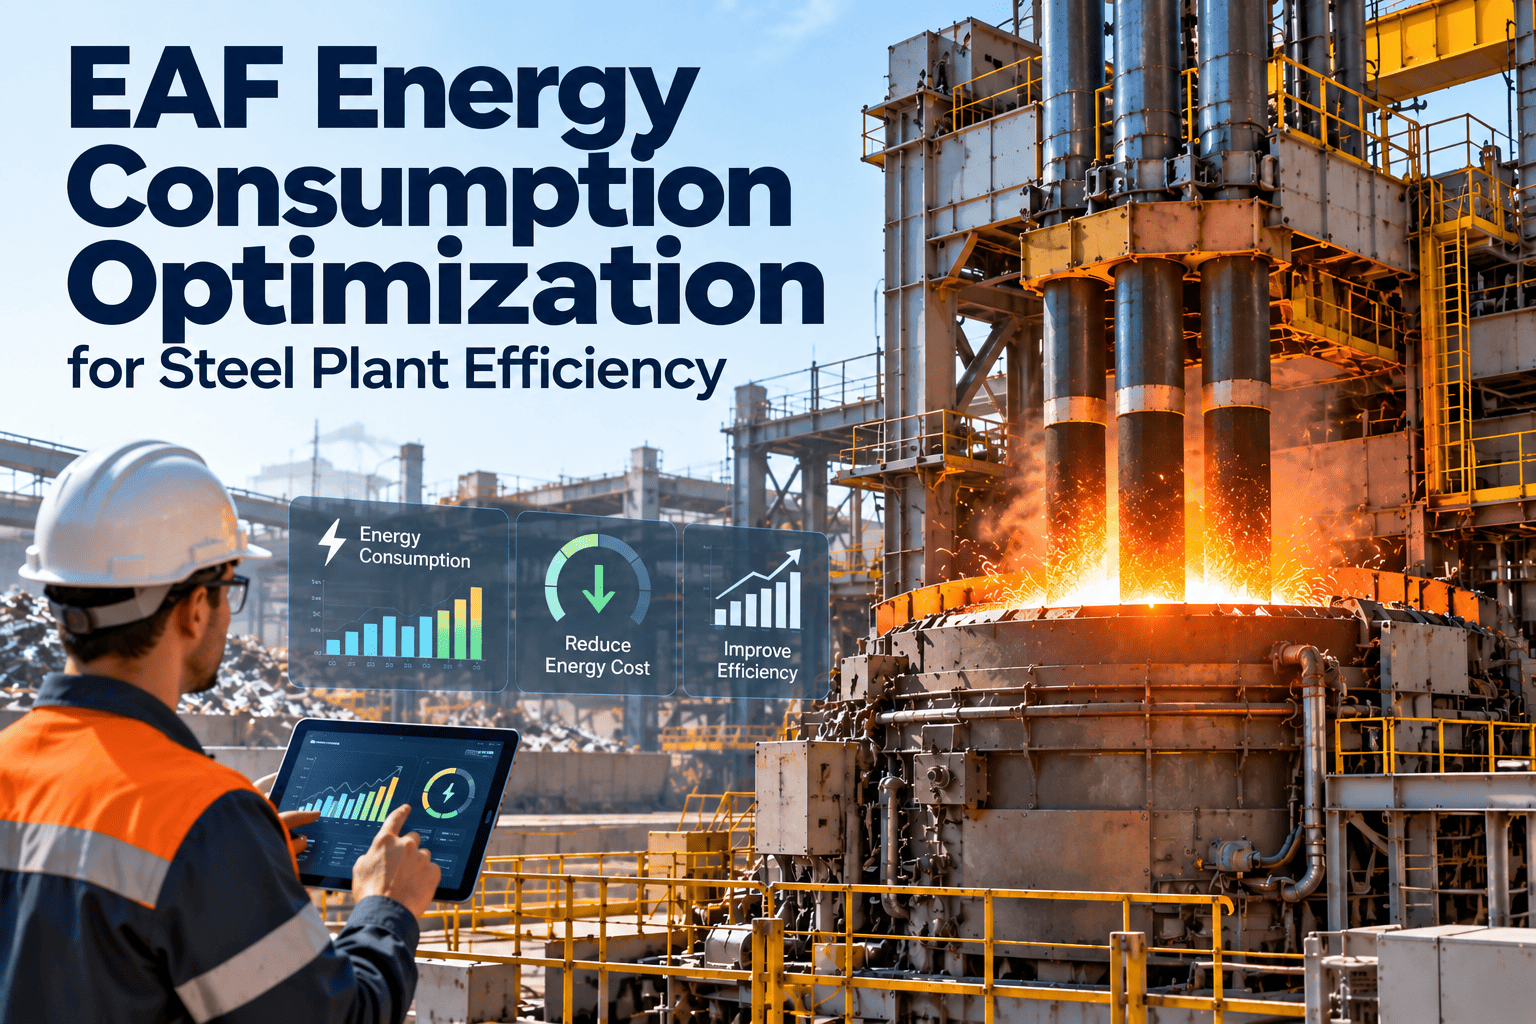
A steel plant in Gujarat discovered they were spending ₹847 more per ton than their regional competitors—a gap that translated to ₹42 crore in unnecessary costs annually. The culprit wasn't equipment or raw materials; it was invisible energy waste buried in processes no one was measuring. When they implemented proper energy cost per ton tracking, they identified three furnace inefficiencies in the first month and recovered ₹18 crore within the year. Energy represents 20-40% of steel production costs, making it the single largest controllable expense in most facilities. Yet surprisingly few plants track energy cost per ton with the precision needed to drive meaningful improvement. This KPI isn't just a number—it's the difference between market leadership and struggling margins.
20-40%
Of Total Steel Production Costs Come From Energy
Top-performing steel plants achieve 15-25% lower energy cost per ton than industry average through systematic monitoring and optimization
The global steel industry consumes approximately 8% of world energy and faces mounting pressure from carbon regulations, volatile energy prices, and competitive markets. Energy cost per ton has become the definitive benchmark separating profitable operations from struggling ones. Schedule a consultation to discover how AI-powered energy tracking can transform your steel plant's cost structure.
Understanding Energy Cost per Ton KPI
Energy cost per ton measures the total energy expenditure required to produce one metric ton of finished steel product. This seemingly simple calculation reveals profound insights about operational efficiency, equipment health, and process optimization opportunities.
The Formula
Total Energy Cost ÷ Tons Produced
Include all energy sources: electricity, natural gas, coal, coke, and oxygen. Measure at the finished product stage, accounting for yield losses and reprocessing.
Industry Benchmark
$45-85 per Ton
Varies significantly by production route (BF-BOF vs EAF), product mix, regional energy costs, and equipment age. Top quartile performers achieve 15-20% below average.
Typical Breakdown
EAF: 400-550 kWh/ton
Electric arc furnaces dominate electricity consumption. Rolling mills, auxiliaries, and material handling add another 100-200 kWh/ton to total plant consumption.
Measurement Frequency
Real-Time to Daily
Monthly averages hide critical variations. Track per-heat, per-shift, and per-product to identify optimization opportunities and anomalies quickly.
Why This KPI Matters Now
With carbon border taxes emerging globally and electricity prices volatile, energy cost per ton directly impacts export competitiveness. Plants that can't measure it precisely can't improve it—and those that can't improve it won't survive the coming decade's margin pressures.
The True Cost of Poor Energy Tracking
Most steel plants believe they track energy costs adequately. In reality, monthly utility bill analysis captures only a fraction of the optimization potential hiding in real-time consumption patterns.
Hidden Energy Cost LossesTypical 1 million ton/year steel facility
Unoptimized Furnace Operations
$3.2M - $5.8M8-15% excess energy from suboptimal tap-to-tap times
Energy cost per ton isn't static—it fluctuates based on dozens of variables. Understanding these drivers is essential for meaningful improvement and accurate benchmarking.
High Impact
Furnace Efficiency
Target380-420 kWh/ton (EAF)
Electrode consumption, arc stability, charge mix, and tap-to-tap time directly determine furnace energy intensity. A 5% improvement here impacts total cost by 2-3%.
High Impact
Production Volume
Target>85% Capacity Utilization
Fixed energy costs (lighting, HVAC, standby equipment) spread across more tons at higher volumes. Below 70% utilization, energy cost per ton can spike 25-40%.
Medium Impact
Product Mix
Variation±15-30% by grade
Alloy steels require longer processing times and higher temperatures. Specialty products can consume 40% more energy than commodity grades.
Medium Impact
Scrap Quality
Target<2% Contamination
Dirty or mixed scrap increases melt time by 10-20%. Consistent, high-quality charge materials enable predictable, optimized furnace cycles.
Variable
Energy Prices
Volatility±30-50% Annually
Time-of-use rates, demand charges, and fuel price swings dramatically affect cost even with constant consumption. Track cost AND consumption separately.
Variable
Ambient Conditions
Impact±5-10% Seasonal
Summer cooling loads increase auxiliary consumption. Winter affects preheating requirements. Normalize data for meaningful trend analysis.
When you track energy cost per ton alongside these variables in a CMMS, patterns emerge that simple utility monitoring misses entirely. Create your free Oxmaint account to see how integrated energy tracking reveals hidden optimization opportunities.
Traditional vs. AI-Powered Energy Tracking
The gap between basic utility monitoring and intelligent energy management determines whether you're reacting to last month's problems or preventing tomorrow's waste.
Energy Tracking Approach Comparison
Traditional Tracking
⚠️
Monthly utility bill analysis only
Plant-level totals without breakdown
Manual spreadsheet calculations
Reactive response to cost spikes
No correlation with production data
5-8%typical energy waste undetected
AI-Powered Tracking
✅
Real-time consumption by equipment
Automatic cost allocation per ton
Anomaly detection and alerts
Predictive optimization suggestions
Full production-energy correlation
12-18%energy cost reduction achievable
Not sure where your energy is going? Our engineers will map your consumption patterns and identify the biggest optimization opportunities.
Steel plants that implement comprehensive energy cost per ton tracking consistently achieve dramatic improvements that compound year over year.
Documented Industry Outcomes
15%
Average reduction in energy cost per ton
22%
Decrease in peak demand charges
8%
Improvement in furnace efficiency
9mo
Typical ROI payback period
"
We thought we understood our energy costs until we started tracking per-ton metrics by shift and product. Within three months, we identified that our night shift was using 12% more energy per ton—a problem that had been costing us $1.8 million annually for years without anyone noticing.
— Operations Director, Mini Mill Steel Producer
Implementation Roadmap
Deploying effective energy cost per ton tracking requires connecting energy data with production systems—a technical challenge that pays dividends for decades.
1
Metering Infrastructure
Week 1-3
Audit existing meters and identify coverage gaps
Install sub-meters on major energy consumers
Configure data collection and communication protocols
2
Data Integration
Week 4-5
Connect energy data with production tracking systems
Establish baseline consumption by equipment and process
Configure automatic cost per ton calculations
3
Dashboard & Alerts
Week 6-7
Build real-time energy KPI dashboards
Set threshold alerts for anomaly detection
Train operations team on monitoring and response
4
Continuous Optimization
Ongoing
Weekly energy review meetings with production teams
Implement AI-driven optimization recommendations
Expand tracking to additional process areas
Best Practices for Energy KPI Tracking
Organizations that achieve sustained energy cost improvements follow these proven practices that separate leaders from laggards in steel manufacturing efficiency.
✓
Track Both Cost AND Consumption
Energy prices fluctuate; consumption is controllable. Monitor kWh/ton alongside $/ton to separate price impacts from efficiency changes.
✓
Segment by Product and Process
Plant-level averages hide optimization opportunities. Track energy cost per ton by grade, furnace, shift, and production line for actionable insights.
✓
Normalize for Variables
Adjust for production volume, product mix, and ambient conditions when comparing periods. Raw numbers mislead; normalized metrics reveal truth.
✓
Make Data Visible to Operators
Real-time displays on the shop floor create awareness and accountability. People improve what they can see and influence.
✓
Link to Maintenance Systems
Equipment degradation shows up in energy data before failure. Connect energy monitoring to your CMMS for predictive maintenance triggers.
Frequently Asked Questions
What's a good benchmark for energy cost per ton in steel production?
Benchmarks vary significantly by production route and region. EAF mini-mills typically range from $45-70/ton for energy, while integrated BF-BOF plants run $55-85/ton. The key is tracking your trend over time and comparing against your own historical best performance. Schedule a consultation to benchmark your facility against industry standards.
How granular should energy metering be for effective tracking?
At minimum, meter your major energy consumers separately: furnaces, rolling mills, auxiliary systems, and building loads. Ideally, sub-meter to individual equipment for root cause analysis. The investment in granular metering typically pays back within 6-12 months through identified savings.
Can energy cost per ton tracking integrate with existing systems?
Yes. Modern energy management systems connect via standard protocols (Modbus, OPC, BACnet) to existing meters and production systems. When integrated with a CMMS like Oxmaint, energy anomalies automatically trigger work orders for investigation. Sign up for free to explore integration capabilities.
How quickly can we expect to see results from energy KPI tracking?
Most facilities identify 5-8% savings opportunities within the first 30 days simply by making energy data visible. Sustained 12-18% improvements typically develop over 6-12 months as teams learn to optimize based on the data and implement process changes.
Start Tracking Energy Cost per Ton Today
Oxmaint connects your energy monitoring with production data and maintenance systems—transforming raw consumption numbers into actionable cost-per-ton insights that drive continuous improvement.