A steel mill in Ohio tracked their electric arc furnace power consumption for years. Monthly reports showed "normal" energy usage—until a new energy manager noticed their kWh per ton of steel was 15% higher than industry benchmarks. The investigation took three weeks. The root cause? Electrode positioning was suboptimal, creating longer arc lengths that wasted energy as heat radiation instead of melting steel. The $12,000 sensor calibration fix reduced energy costs by $847,000 annually. For years, the mill had been hemorrhaging nearly a million dollars in excess energy because nobody knew what "normal" should actually look like.
This is why energy loss analysis exists—and why it matters more than any other efficiency discipline in steel manufacturing. Steel production is one of the most energy-intensive industries on Earth, consuming roughly 5% of global industrial energy. Where most facilities see electricity bills, smart operators see optimization opportunities. In steel manufacturing, where furnaces run at 3,000°F and motors drive massive rolling mills, the difference between energy waste and energy efficiency is the difference between marginal survival and competitive advantage. Facilities that implement systematic energy loss analysis reduce consumption by 12-25%.
Sign in to start tracking energy losses or book a demo to see how facilities eliminate energy waste systematically.
Energy Optimization
Energy Loss Analysis in Steel Manufacturing
Stop paying for wasted energy. Start capturing every BTU and kWh that should be making steel.
Average Energy Savings Potential
Energy Lost as Waste Heat
Energy Costs as % of Production
$2-5M
per year
Typical Recovery from Analysis
Why Energy Waste Hides in Plain Sight
Steel mills are complex systems with thousands of energy-consuming components. When everything seems to be running, there's no alarm telling you that 18% of your furnace energy is radiating through degraded refractory lining. No dashboard flags that your compressed air system loses 25% of capacity to leaks. No alert warns that rolling mill motors draw 12% more power than necessary due to misalignment.
Energy waste is silent. It doesn't trigger shutdowns or produce defective steel. It just costs money—continuously, invisibly, relentlessly. The failed part announces itself. The energy loss blends into the monthly utility bill as "normal operations."
45%
Of energy input in integrated steel mills is lost as waste heat—through exhaust gases, cooling water, radiation, and convection. Most of this is recoverable with proper analysis and technology.
Stop accepting energy waste as inevitable. Book a demo and see how facilities identify and capture hidden energy losses.
The Energy Loss Framework: Where Steel Mills Bleed Energy
Understanding where energy goes is the first step to understanding where it's wasted. Steel manufacturing has distinct energy loss categories, each with different recovery potentials and investment requirements:
The Energy Flow Principle
Energy enters the mill as electricity, natural gas, coal, and coke. It exits as steel (the useful product), waste heat, mechanical losses, and process inefficiencies. Your job is to maximize the first exit and minimize the rest. Every BTU lost is revenue left on the table.
35-45%
Thermal Losses
Heat escaping through furnace walls, exhaust gases, cooling systems, and radiation from hot steel. Largest loss category but also highest recovery potential.
15-20%
Electrical Losses
Motor inefficiencies, power factor penalties, transformer losses, harmonic distortion, and oversized equipment running at partial loads.
8-12%
Mechanical Losses
Friction in bearings, gearboxes, and drives. Misalignment causing vibration. Worn components requiring more power to achieve same output.
5-10%
Process Losses
Suboptimal process parameters, excessive reheating cycles, unnecessary idling, poor scheduling causing thermal cycling.
3-8%
Compressed Air & Utilities
Leaks, inappropriate pressure levels, inefficient compressors, and distribution losses in one of the most expensive utilities in any plant.
⚠️ Common Mistake: Focusing only on the largest loss category. Thermal recovery requires capital investment; electrical and mechanical fixes often pay back in months. Attack all categories systematically for maximum ROI.
Complete Energy Loss Case Studies
Theory becomes actionable through examples. Here are four detailed energy loss analyses from actual steel manufacturing facilities, showing how systematic investigation reveals recoverable waste:
Initial Problem Statement
EAF energy consumption averaging 485 kWh/ton—approximately 12% above industry benchmark of 430 kWh/ton. Operations assumed this was due to scrap quality variations. Monthly excess energy cost: ~$180,000.
Energy Loss Analysis
1
Where is excess energy going?
Thermal imaging showed furnace shell 40°F hotter than design specification in multiple zones
2
Why are shell temperatures elevated?
Refractory lining thickness had degraded from 12" to 7" in hot spots—beyond safe operating threshold
3
Why wasn't degradation detected?
Refractory inspections were visual only during annual outages; no continuous monitoring system
4
What about off-gas losses?
Off-gas temperature 2,800°F at fourth hole—significant energy leaving with exhaust
5
What's the total loss picture?
ROOT CAUSES: 35% from refractory degradation, 45% from unrecovered off-gas heat, 20% from suboptimal arc length control
Recovery Actions
Immediate: Refractory repair during next scheduled outage; cost $85,000
Medium-term: Installed shell temperature monitoring with real-time alerts; recalibrated electrode positioning sensors
Long-term: Implemented scrap preheating system using off-gas heat recovery; ROI 14 months
Outcome
Reduced energy consumption to 418 kWh/ton—below benchmark. Annual savings: $2.1 million. Refractory life extended 40% with continuous monitoring.
Initial Problem Statement
Rolling mill main drives consuming 8-12% more power than identical equipment at sister plant. Same products, same specifications, same maintenance schedule. Annual excess: $640,000.
Energy Loss Analysis
1
Where is the power difference?
Motor current analysis showed higher reactive power component—poor power factor of 0.78 vs. 0.92 at sister plant
2
Why is power factor degraded?
Capacitor banks in power factor correction system—3 of 8 banks offline due to failed capacitors
3
Why weren't capacitors replaced?
No PM task existed for capacitor inspection; failures not generating alarms (gradual degradation)
4
What else contributes to excess power?
Drive alignment check revealed 0.015" offset on finishing mill—causing 3% additional motor loading
5
What's the systemic gap?
ROOT CAUSES: No power quality monitoring program; alignment checks reactive only (after vibration complaints); no energy KPIs tracked
Recovery Actions
Immediate: Replaced failed capacitors ($23,000); precision alignment of finishing mill drives ($8,000)
Medium-term: Installed power quality monitoring on all major loads; added quarterly capacitor inspection to PM schedule
Long-term: Implemented energy dashboard with kWh/ton targets by product; monthly variance analysis
Outcome
Power factor improved to 0.94. Motor power consumption now 2% below sister plant. Annual savings: $720,000. Utility penalty for poor power factor eliminated ($45,000/year additional).
Initial Problem Statement
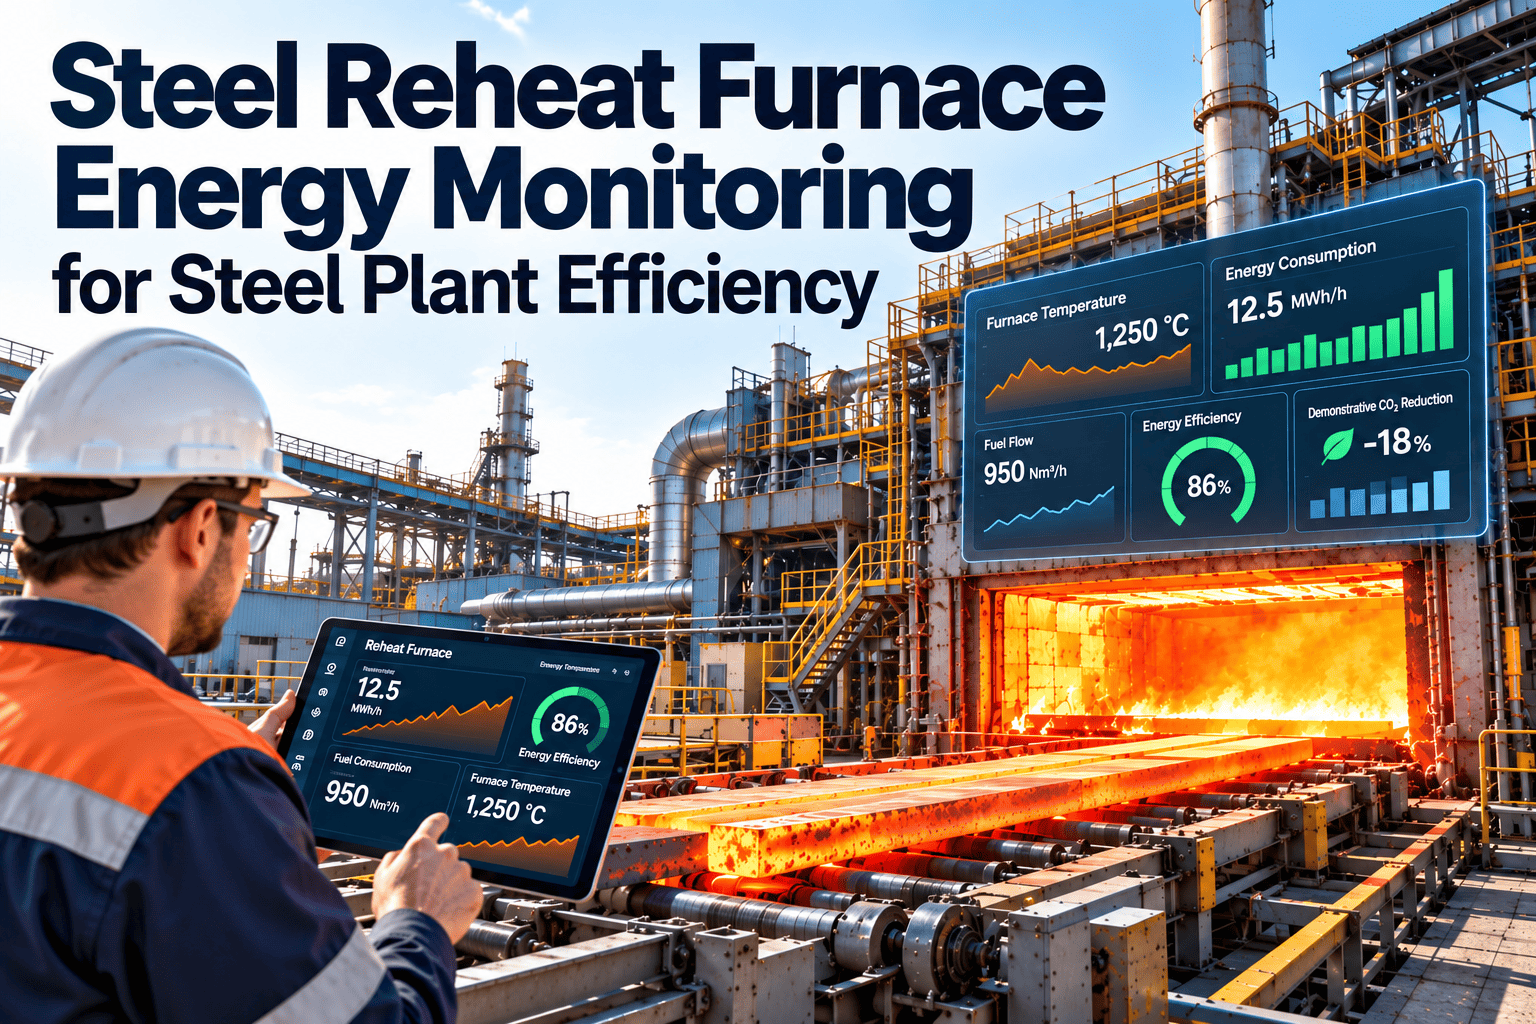
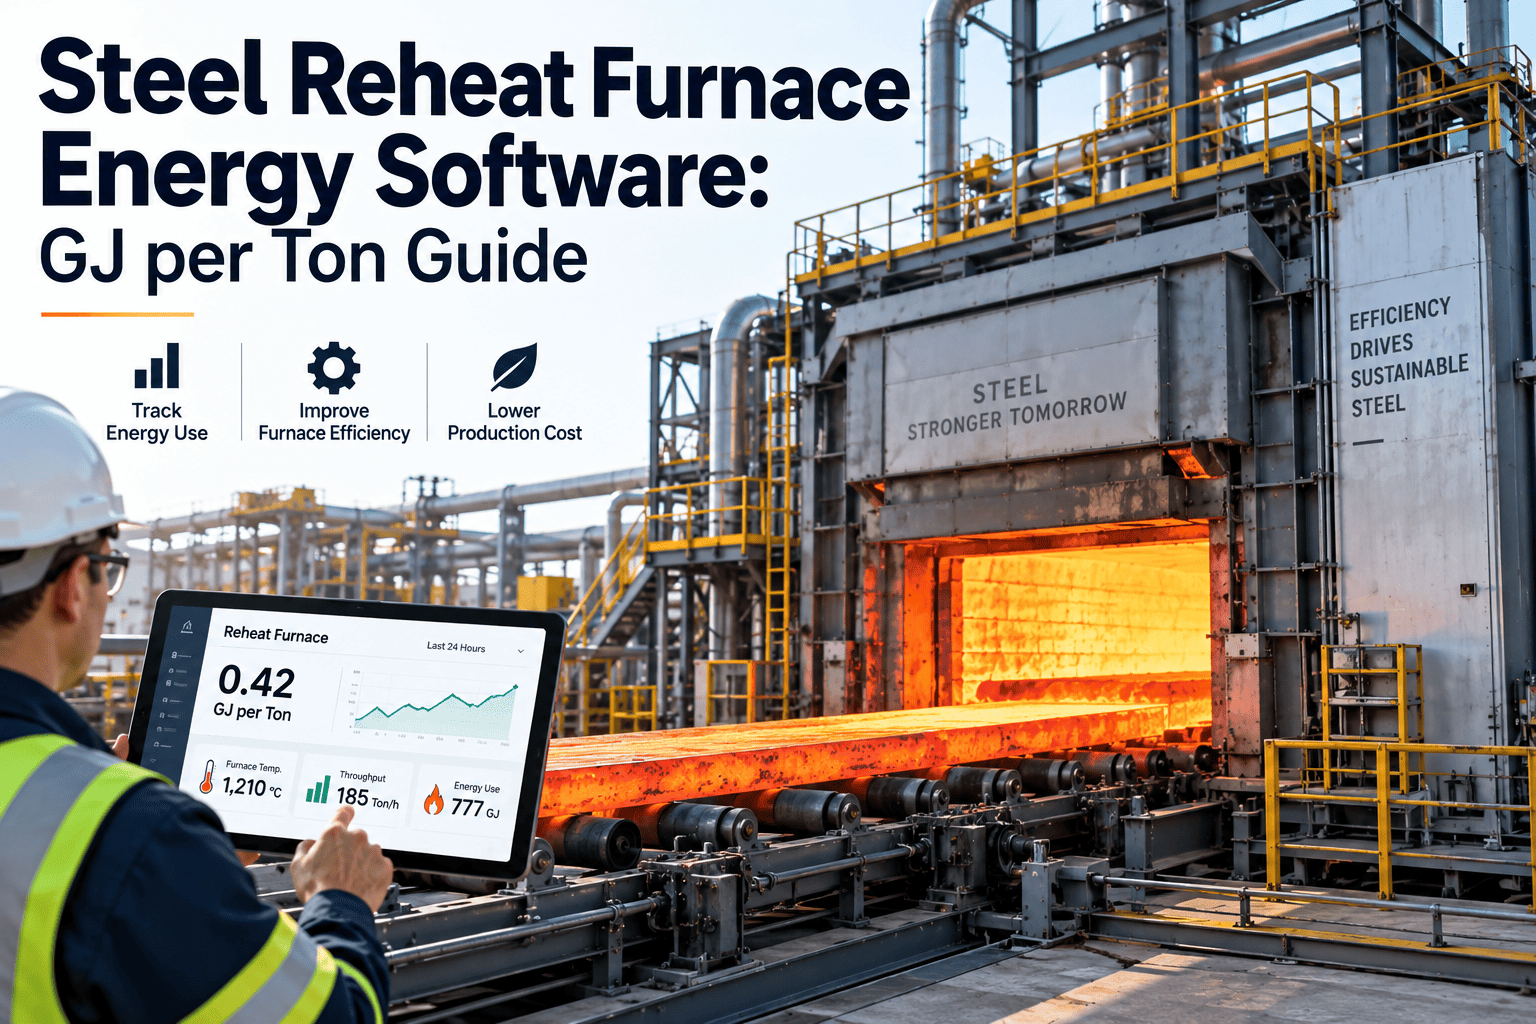
Reheat furnace natural gas consumption increased 18% over 24 months despite stable production volume. Operators attributed it to colder winters. Energy manager suspected otherwise. Excess cost: $890,000/year.
Energy Loss Analysis
1
Is consumption increase weather-related?
Degree-day analysis showed only 3% correlation with weather; 15% increase unexplained
2
Where is additional fuel going?
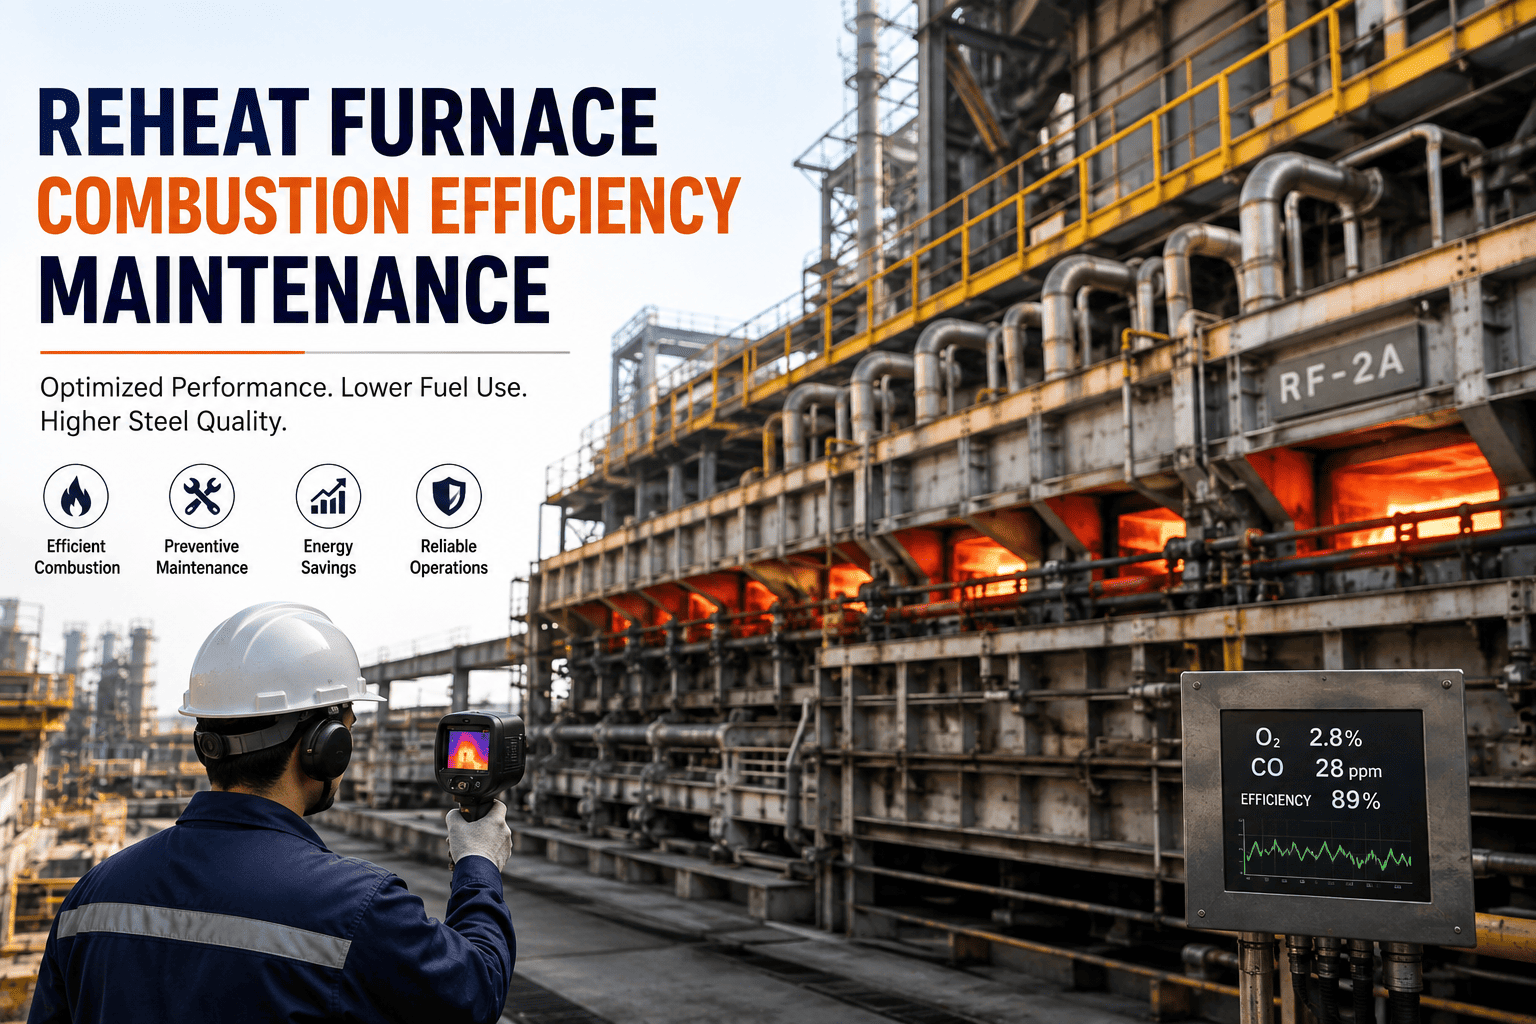
Combustion analysis: excess air at 45% vs. target 10-15%; flame temperature low; incomplete combustion
3
Why is excess air so high?
Damper actuators found in manual override—operators had disabled automatic control after false alarms
4
Why were operators disabling controls?
O2 sensors drifting out of calibration, causing erratic automatic damper movements and production disruptions
5
What allowed this condition to persist?
ROOT CAUSES: No sensor calibration schedule; no audit of manual overrides; no combustion efficiency tracking; operator workarounds not documented or escalated
Recovery Actions
Immediate: Calibrated all O2 sensors; returned dampers to automatic control; tuned combustion air ratio
Medium-term: Implemented quarterly sensor calibration; created override log with mandatory escalation; combustion efficiency targets in shift metrics
Long-term: Installed redundant O2 sensors with automatic failover; predictive analytics for sensor drift
Outcome
Excess air reduced to 12%. Fuel consumption decreased 21%—below the original baseline. Annual savings: $1.15 million. Scale formation reduced, improving yield by 0.3%.
Initial Problem Statement
Compressed air system running at 98% capacity despite production only at 70%. New compressor purchase being evaluated ($340,000). Maintenance suspected the real problem was elsewhere.
Energy Loss Analysis
1
Where is compressed air demand?
Weekend shutdown test: compressors still cycling with no production—system maintaining only 85 PSI vs. 110 PSI target
2
Why demand during shutdown?
Ultrasonic leak survey identified 147 leaks totaling 890 CFM—31% of total compressor capacity
3
Why so many leaks?
Quick-disconnect fittings at 73 locations worn; old piping connections corroded; no systematic leak repair program
4
What about inappropriate uses?
Audit found compressed air used for cooling (8 stations), cleaning (12 stations), and one operator using it to dry parts—wasteful applications
5
What's the systemic failure?
ROOT CAUSES: No compressed air management program; no leak tracking; no standards for appropriate use; system treated as "free" utility
Recovery Actions
Immediate: Repaired top 50 leaks (recovered 620 CFM); installed proper blowers at cooling stations
Medium-term: Quarterly ultrasonic leak surveys with repair tracking; created "Compressed Air Use Policy" prohibiting wasteful applications
Long-term: Installed pressure/flow monitoring at zone level; leak cost displayed in real-time on plant dashboard
Outcome
New compressor purchase cancelled—existing capacity now adequate with 35% headroom. Annual energy savings: $187,000. System pressure stable at 108 PSI.
Track Every Energy Loss. Capture Every Savings Opportunity.
Oxmaint provides energy monitoring dashboards, loss tracking, and automated analysis—turning invisible waste into actionable savings.
The Energy Audit Framework: Systematic Loss Identification
When energy losses span multiple systems, a structured audit framework ensures nothing is missed. For steel manufacturing, these six categories capture the major energy consumers and their loss mechanisms:
Furnaces & Heating
Primary energy consumers
- Refractory degradation
- Combustion inefficiency
- Unrecovered exhaust heat
- Door/opening radiation losses
- Scale formation (lost steel)
Motors & Drives
Largest electrical loads
- Oversized motors at partial load
- Poor power factor
- VFD opportunities missed
- Misalignment losses
- Rewound motor efficiency loss
Compressed Air
Most expensive utility per BTU
- System leaks
- Inappropriate applications
- Excess pressure
- Compressor controls
- Inlet air temperature
Steam Systems
Often poorly maintained
- Failed steam traps
- Missing insulation
- Condensate not recovered
- Boiler blowdown excess
- Pressure drop issues
Cooling Systems
Hidden inefficiency
- Fouled heat exchangers
- Cooling tower performance
- Pump oversizing
- Excess flow rates
- Heat recovery opportunities
Process & Scheduling
Operational factors
- Idle equipment running
- Poor production sequencing
- Thermal cycling losses
- Demand peak charges
- Off-spec product rework
Energy Loss Documentation Requirements
Energy analysis without documentation is analysis that can't be repeated, verified, or improved upon. Here's what every energy loss assessment should capture:
01
Baseline Measurement
Current consumption by system, production-normalized metrics (kWh/ton, MMBtu/ton), seasonal variations, demand profiles, utility rate structures
02
Loss Identification
Each loss quantified in energy units and dollars, measurement methodology, confidence level, equipment involved, operating conditions during assessment
03
Root Cause Analysis
Why each loss exists, contributing factors, duration of condition, whether previously identified, systemic vs. acute issues
04
Recovery Opportunities
Technical solution for each loss, implementation cost, expected savings, simple payback period, risk factors, resource requirements
05
Implementation Plan
Prioritized project list, responsible owners, target completion dates, budget allocation, dependencies, M&V approach
06
Verification & Tracking
Post-implementation measurement protocol, comparison to predicted savings, adjustment factors, continuous improvement process
Building an Energy Management Culture
Technology and analysis only work when the organization supports them. Building a culture where energy efficiency is everyone's job requires deliberate effort:
Visible Metrics
Display energy consumption and cost in real-time where operators can see it. When energy becomes visible, behavior changes. Dashboards at control rooms, break rooms, and plant entrances.
Clear Targets
Set specific, measurable energy targets by area and shift. "Reduce energy 10%" means nothing without baseline and timeline. "420 kWh/ton by Q3" is actionable.
Shared Benefits
Connect energy savings to things employees care about—equipment upgrades, facility improvements, profit sharing. When teams see the benefit, they find savings you never imagined.
Regular Audits
Quarterly energy walks with cross-functional teams. Fresh eyes catch what daily familiarity misses. Rotate audit team members to spread knowledge and ownership.
Easy Reporting
Make it simple for anyone to report energy waste—leaks, lights left on, equipment running unnecessarily. If reporting requires paperwork, it won't happen.
Recognition
Celebrate wins publicly. When maintenance fixes a leak saving $50,000/year, make sure everyone knows. Recognition drives repetition.
Make Energy Management Systematic
Oxmaint tracks energy consumption, identifies losses, manages improvement projects, and verifies savings—turning analysis into continuous improvement.
Frequently Asked Questions
How much can a typical steel mill save through energy analysis?
Most steel mills have 15-25% energy savings potential hiding in inefficiencies. For a mill spending $30 million annually on energy, that's $4.5-7.5 million in recoverable waste. Even well-managed facilities typically find 8-12% savings opportunity through systematic analysis.
What's the fastest payback energy improvement in steel manufacturing?
Compressed air leak repair typically delivers the fastest ROI—often weeks, not months. A $2,000 leak repair that saves $15,000/year pays back in seven weeks. Power factor correction and combustion tuning also deliver rapid returns with minimal capital investment.
How often should energy audits be conducted?
Comprehensive energy audits should occur every 2-3 years, but continuous monitoring should be ongoing. Quarterly "energy walks" catch developing issues between formal audits. Real-time monitoring systems can identify acute losses immediately.
What's the most commonly overlooked energy loss in steel mills?
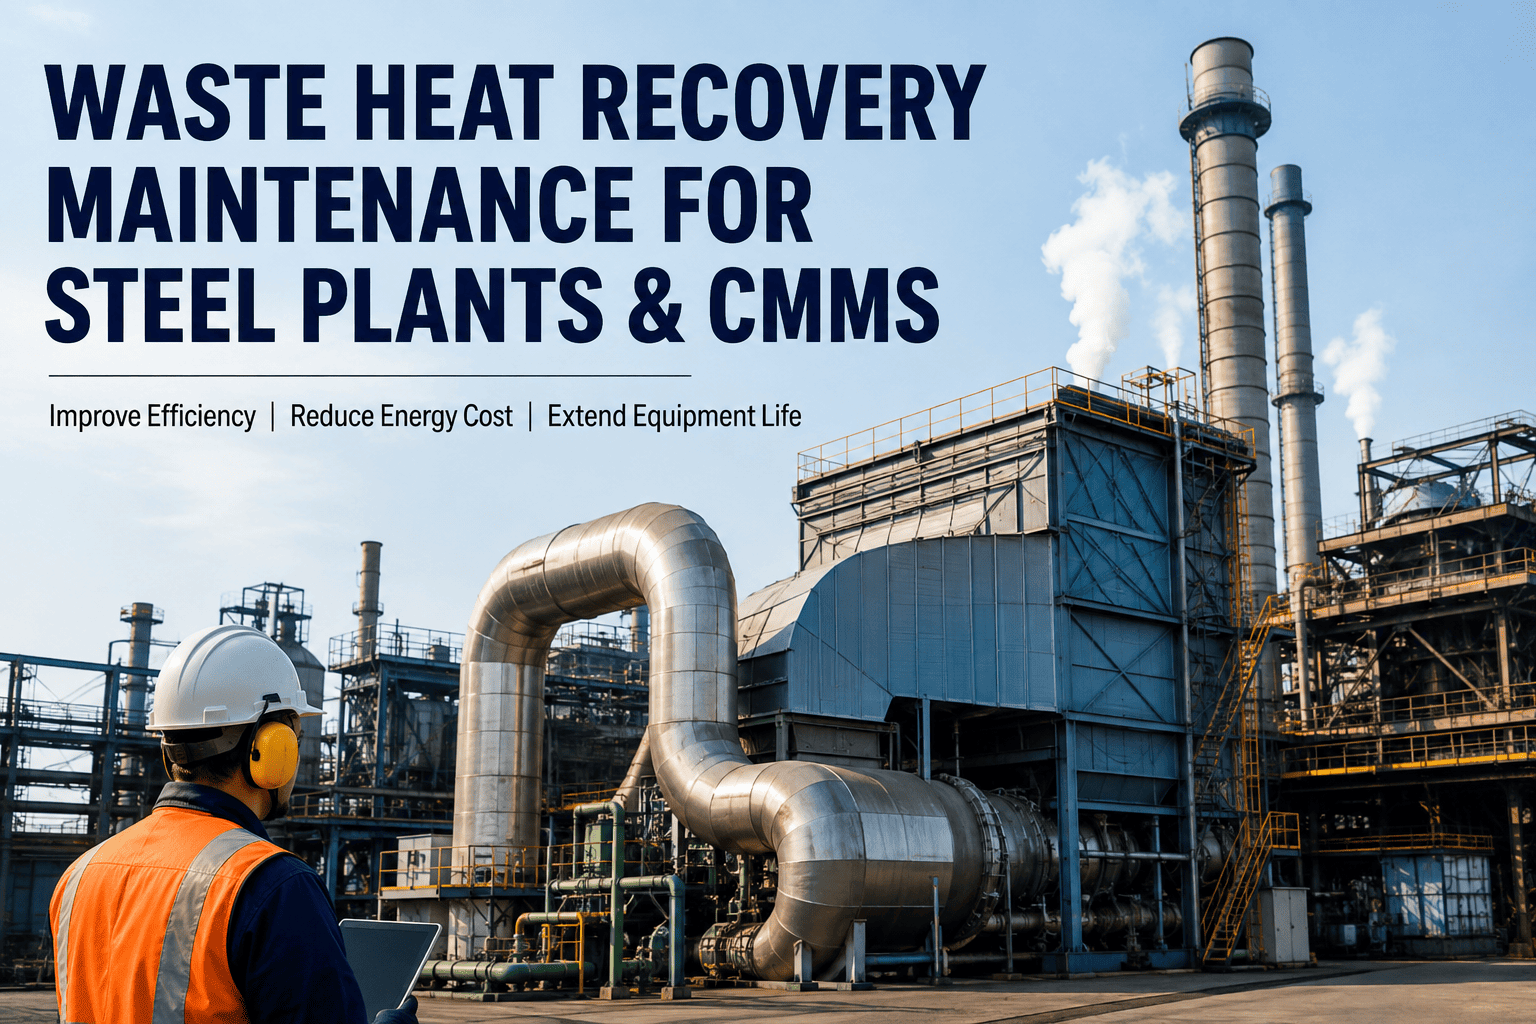
Waste heat from processes—particularly from cooling water and exhaust gases. Steel mills generate enormous amounts of low-grade heat that's typically rejected to atmosphere or cooling towers. Heat recovery for preheating, space heating, or even power generation can capture significant value from this "free" energy.
How do we get operators to care about energy efficiency?
Make energy visible and relevant. Display real-time energy cost per ton on control room screens. Set shift targets with friendly competition. Share savings stories—when operators see that finding one steam trap leak saved $30,000, they start looking for others.
Sign in to see how Oxmaint makes energy data visible and actionable for everyone.