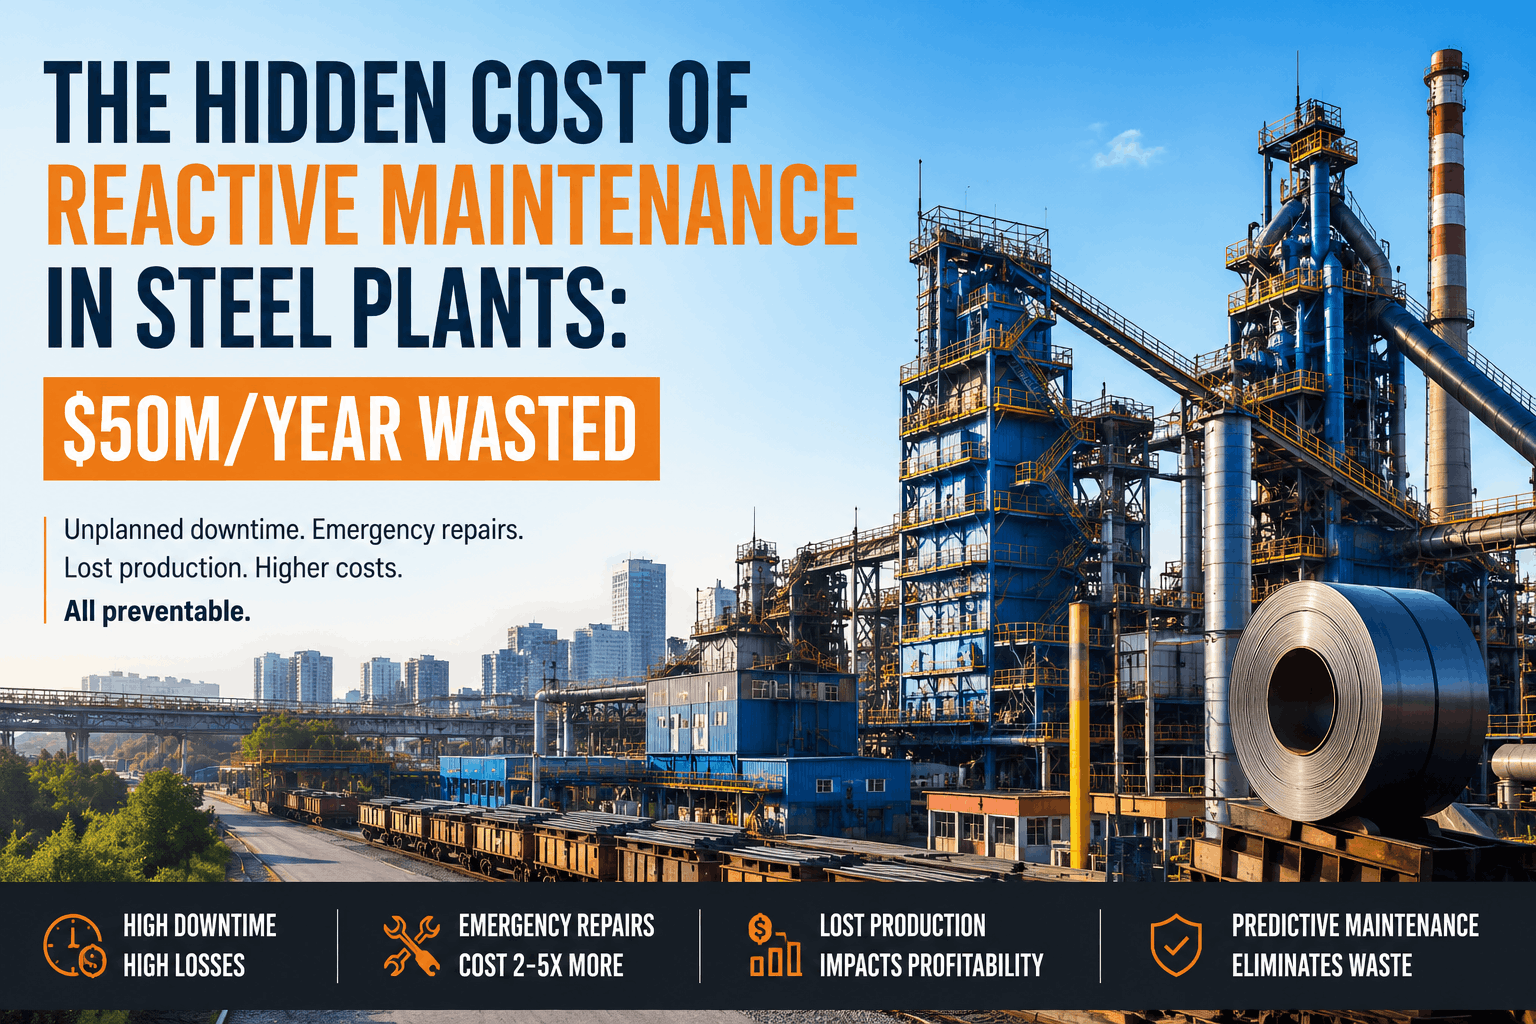
Maintenance Budget Planning for Steel Plants: Getting More from Every Dollar
By John Mark on March 12, 2026
Maintenance budget planning for steel plants represents one of the most critical yet challenging financial disciplines in heavy industry. With equipment values reaching hundreds of millions, downtime costs exceeding $100,000 per hour, and competing priorities for every dollar, getting maintenance budgeting right can mean the difference between profitability and losses. Yet many steel plants still rely on historical spending patterns, arbitrary percentage allocations, or reactive budgeting that leaves them vulnerable to unexpected failures and cost overruns. Data-driven maintenance budget planning transforms this complexity into strategic advantage—enabling steel producers to maximize equipment reliability while minimizing total cost of ownership. This comprehensive guide explores proven strategies, benchmarks, and digital tools that help steel plant managers get more from every maintenance dollar. Schedule a consultation to explore how intelligent budget planning can transform your maintenance economics.
The True Cost of Maintenance in Steel Production
Understanding maintenance's full financial impact is the foundation of effective budget planning. In steel plants, maintenance costs extend far beyond labor and parts—they include production losses from downtime, quality impacts from equipment issues, safety incident costs, and long-term asset degradation. World-class steel producers view maintenance not as an expense to minimize but as an investment to optimize.
3-6%
of RAV
Typical annual maintenance spend as % of Replacement Asset Value
40%
Waste
Average maintenance budget wasted on non-value activities
25%
Savings
Achievable through optimized budget planning and execution
⚡
18mo
ROI Period
Typical payback for budget optimization investments
Stop guessing your maintenance budget. Join steel producers using AI-powered budget planning to optimize every dollar and maximize equipment reliability.
Effective maintenance budgeting requires categorizing spending by purpose and impact—not just by accounting codes. This enables strategic allocation decisions that balance short-term needs with long-term asset health.
Optimal Maintenance Budget AllocationBased on world-class steel plant benchmarks
35-45%
Preventive Maintenance
Planned inspections, lubrication, adjustments, and component replacements
25-35%
Corrective Maintenance
Repairs and replacements from identified defects and failures
Upgrades, modifications, and reliability enhancement projects
5-8%
Emergency & Contingency
Unplanned repairs and budget buffer for unexpected events
The Budget Planning Process
World-class maintenance budgeting follows a structured annual cycle that incorporates historical data, equipment condition assessments, production plans, and continuous improvement initiatives. This systematic approach replaces guesswork with data-driven decisions.
01
Historical Analysis
Review 3-5 years of maintenance spending by asset, work type, and failure mode. Identify trends, anomalies, and improvement opportunities.
Key Output: Baseline spending patterns and variance analysis
02
Asset Condition Assessment
Evaluate equipment health across the fleet. Prioritize assets by criticality, age, and remaining useful life.
Key Output: Condition-based investment priorities
03
Workload Forecasting
Project maintenance workload based on production plans, shutdown schedules, and known deferred work.
Key Output: Labor and material requirements by period
04
Budget Optimization
Allocate resources to maximize reliability within financial constraints. Balance preventive vs. corrective spending.
Key Output: Optimized budget with ROI projections
05
Execution & Tracking
Monitor actual vs. budget throughout the year. Adjust allocations based on performance and changing conditions.
Key Output: Monthly variance reports and corrective actions
06
Continuous Improvement
Capture lessons learned, update models, and refine budgeting approach for next cycle.
Key Output: Improved accuracy and decision quality
See budget planning in action. Book a demo and we'll show you how Oxmaint structures maintenance budgets and tracks spending against plan in real-time.
Effective budget management requires tracking the right KPIs. These metrics provide visibility into spending efficiency, maintenance effectiveness, and return on maintenance investment.
Maintenance Cost per Ton
$15-35/ton
Varies by product mix and process route. Track trend over time rather than absolute value.
Maintenance as % of RAV
3-6%
Replacement Asset Value benchmark. Lower isn't always better—consider reliability impact.
⚙️
PM vs. CM Ratio
2:1 to 3:1
Preventive to Corrective work ratio. Higher ratios indicate proactive maintenance culture.
Budget Variance
±5-10%
Monthly actual vs. budget tolerance. Tighter variance indicates better planning accuracy.
Inventory Turns
4-6x annually
Maintenance parts consumption vs. average inventory. Higher turns indicate efficient inventory management.
?
Emergency Work %
<10%
Percentage of maintenance hours on unplanned work. Lower indicates better planning and reliability.
Common Budget Planning Mistakes
Even experienced maintenance leaders fall into budget planning traps that undermine financial performance. Understanding these pitfalls helps avoid costly mistakes and improve budget accuracy.
❌
Historical Spending as Baseline
Mistake: Using last year's budget as starting point without analyzing efficiency. Better Approach: Build budget from equipment needs and work requirements, then compare to historical spend.
❌
Ignoring Asset Condition
Mistake: Allocating budget uniformly across all equipment. Better Approach: Prioritize spending based on asset criticality, age, and condition assessments.
❌
No Contingency Planning
Mistake: Budgeting only for known work with no buffer. Better Approach: Include 5-10% contingency for unexpected failures and emerging issues.
❌
Siloed Budget Development
Mistake: Maintenance plans budget without operations input. Better Approach: Collaborate with production on shutdown windows and priority alignment.
❌
Ignoring Total Cost
Mistake: Focusing only on maintenance department budget. Better Approach: Consider production losses, quality impacts, and safety costs in investment decisions.
❌
No Performance Tracking
Mistake: Setting budget without ongoing variance monitoring. Better Approach: Track monthly actuals vs. budget with root cause analysis for variances.
Budget Optimization ROI CalculatorEstimate your potential savings from improved budget planning
Current Annual Maintenance Spend
$10M
Typical mid-size steel plant
Potential Efficiency Gain
15-25%
Through optimized planning and execution
Estimated Annual Savings
$1.5M - $2.5M
Without compromising reliability
Investment Required
$200K - $400K
Tools, training, and implementation
Technology Enablement
Modern maintenance budget planning leverages digital tools to improve accuracy, visibility, and decision-making. The right technology stack transforms budgeting from annual exercise into continuous optimization.
Data Foundation
CMMS/EAM SystemHistorical Work OrdersAsset RegistryInventory Records
Analytics Layer
Spending Trend AnalysisCost per Asset TrackingWork Type ClassificationVariance Detection
Calculate your budget optimization potential. Create a free Oxmaint account and our team will analyze your spending patterns and identify the highest-impact improvement opportunities.
Major shutdowns and turnarounds represent significant budget events that require separate planning and tracking. These concentrated spending periods can consume 20-40% of annual maintenance budgets in just weeks.
Turnaround Budget Components
Direct Labor
35-45%
Internal maintenance crews and overtime costs
?️
Contractors
25-35%
Specialized contractors and additional workforce
Materials
15-25%
Parts, refractory, and consumables
Support Services
5-10%
Catering, security, waste management, medical
Production Loss
Variable
Often exceeds direct maintenance costs
Building Executive Support
Maintenance budget approval requires demonstrating value to finance and operations leadership. Framing maintenance spending as investment rather than expense changes the conversation from cost-cutting to value-creation.
Speak Their Language
✓ ROI and payback periods
✓ Production impact quantification
✓ Risk mitigation value
✓ Total cost of ownership
Show Trade-Offs
✓ Budget cut → reliability impact
✓ Investment → downtime reduction
✓ Deferred work → future cost
✓ Prevention vs. reaction costs
Track Outcomes
✓ Monthly performance dashboards
✓ Budget vs. actual with explanations
✓ Reliability metric trends
✓ Success stories and lessons learned
Get More from Every Maintenance Dollar
Your maintenance budget is too important to plan reactively. Oxmaint helps you deploy data-driven budget planning that optimizes spending across your entire asset fleet, balances short-term needs with long-term reliability, and provides real-time visibility into budget performance—transforming maintenance from a cost center into a strategic investment for your steel plant operations.
How much should we budget for maintenance as a percentage of revenue?
Maintenance as % of revenue varies significantly by steelmaking route and product mix. Integrated mills typically spend 4-8% of revenue on maintenance, while EAF operations range 3-6%. More meaningful benchmarks include maintenance cost per ton ($15-35) and maintenance as % of RAV (3-6%). Focus on trends and reliability outcomes rather than absolute percentages. Schedule a consultation for plant-specific benchmarks.
How do we justify maintenance budget increases to finance?
Frame maintenance spending as investment with measurable returns. Quantify downtime costs avoided, production capacity gained, quality improvements, and safety risk reduction. Show trade-offs: budget cuts lead to increased failures and higher total costs. Present ROI calculations with payback periods. Track and report outcomes consistently to build credibility over time.
What's the right balance between preventive and corrective maintenance spending?
World-class steel plants target 2:1 to 3:1 ratio of preventive to corrective work. This typically translates to 35-45% of budget on preventive activities and 25-35% on corrective. However, optimal balance depends on asset criticality, age, and condition. Use equipment health data to guide allocation rather than arbitrary targets. Sign up for a free account to access budget optimization tools.
How often should we review and adjust our maintenance budget?
Review budget performance monthly with variance analysis. Make minor adjustments quarterly based on actual performance and changing conditions. Conduct comprehensive mid-year review to identify significant gaps or opportunities. Annual budget cycle should incorporate lessons learned and updated asset condition assessments. Real-time budget tracking enables proactive rather than reactive adjustments.
Can AI help optimize our maintenance budget allocation?
Yes. AI analyzes historical spending, equipment condition, failure patterns, and production requirements to recommend optimal budget allocation. Machine learning models predict failure costs and remaining useful life to prioritize investments. AI continuously learns from actual outcomes to improve budget accuracy over time. Book a demo to see AI budget optimization in action.
How do we handle emergency maintenance costs that exceed budget?
Include 5-10% contingency in annual budget for unexpected work. Track emergency spending separately to identify patterns and root causes. Investigate recurring emergencies—frequent "unplanned" work often indicates planning gaps. Use emergency cost data to justify increased preventive spending on problematic assets. Review and adjust contingency levels annually based on actual experience.