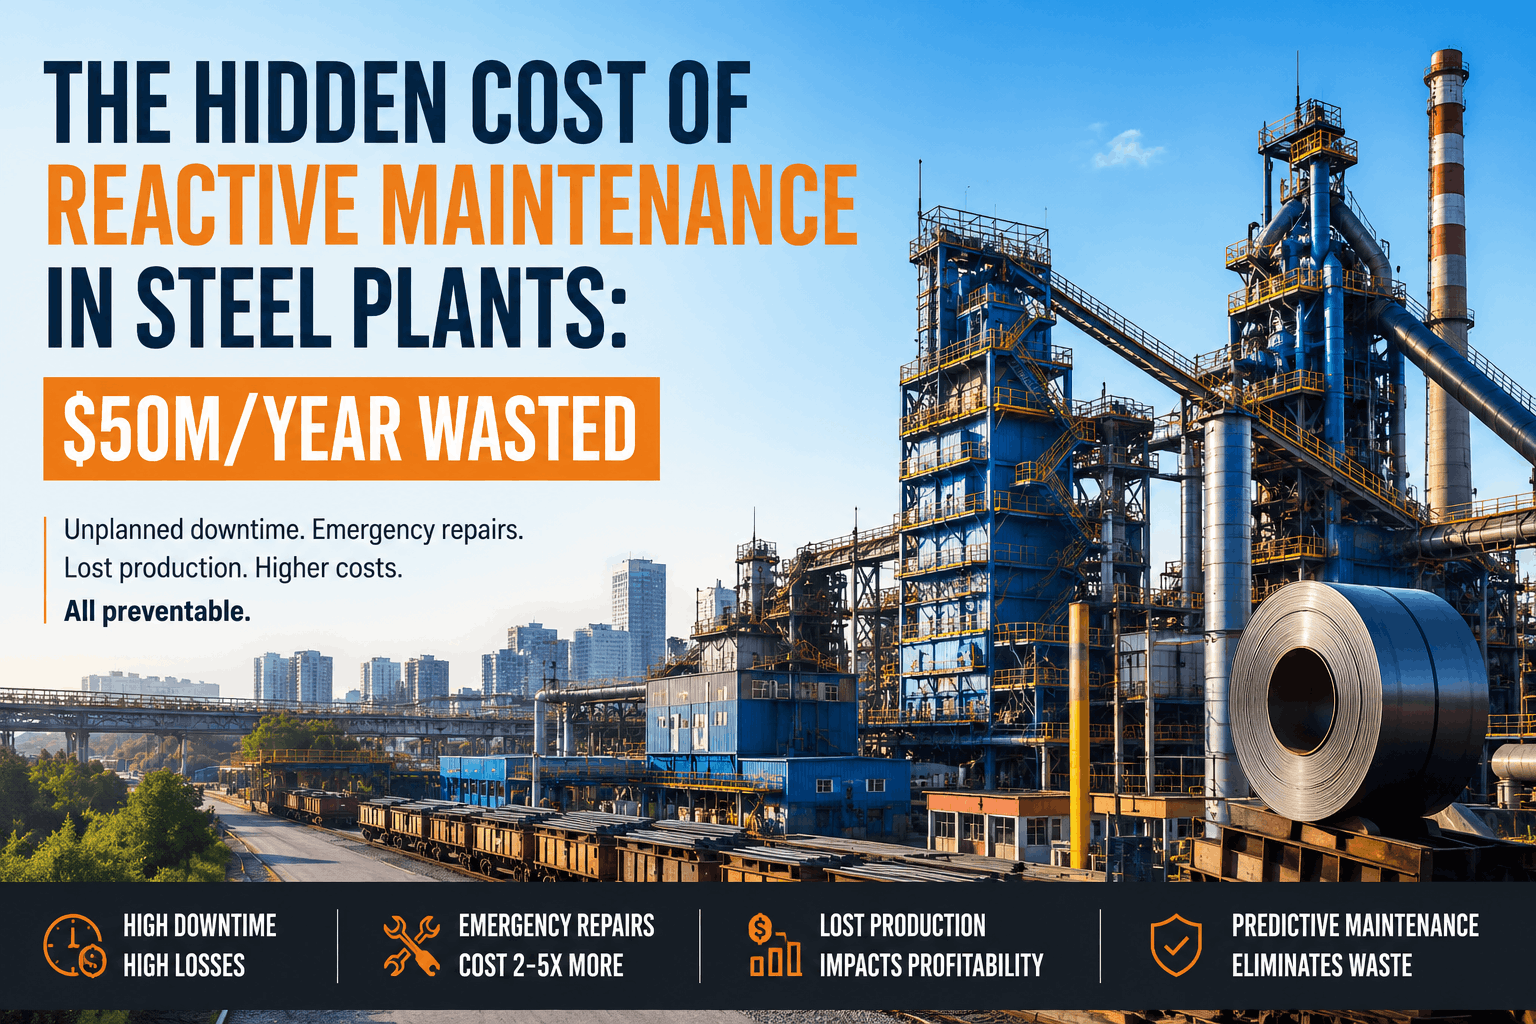
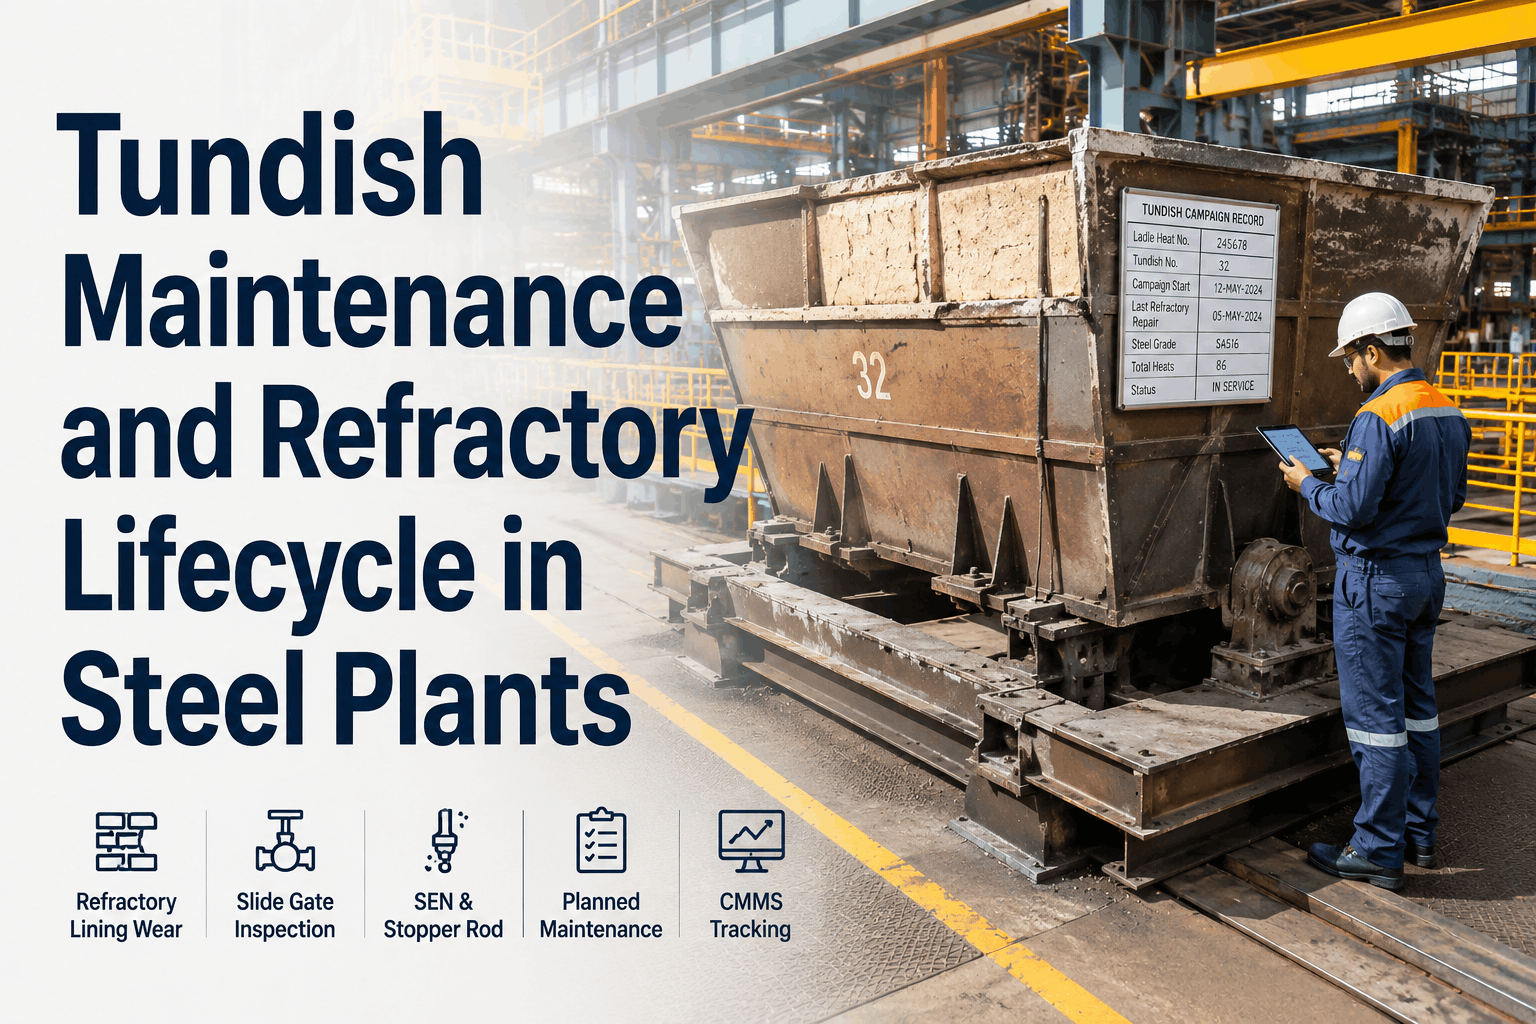
Steel plant maintenance budgets are always too small for what the plant needs and too large for what finance wants to approve. The typical integrated steel plant spends $25–$60 per tonne on maintenance — somewhere between 15–25% of total conversion cost. Spend too little and breakdowns eat the savings in lost production. Spend too much on the wrong things and capital gets buried in parts that never get used and PM tasks that don't prevent failures. The solution isn't spending more or less — it's spending smarter. CMMS gives maintenance managers the cost visibility to build budgets that finance trusts, track spending against plan in real time, and prove that every dollar spent on prevention returns $3–$8 in avoided breakdown costs.
$25–$60
Maintenance cost per tonne of steel — the KPI that benchmarks your plant against the industry
15–25%
Share of total conversion cost consumed by maintenance in a typical integrated steel plant
3–8×
Return on every $1 spent on planned maintenance vs. the cost of the breakdown it prevents
Where the Budget Goes: The Maintenance Dollar Breakdown
Before you can control costs, you need to see where the money actually goes. Most steel plants know their total maintenance spend but can't break it down by category with any confidence. CMMS fixes that — every work order carries a cost, every cost hits a category, and every category is visible in real time.
Labor (internal maintenance staff)
38%
Largest single category. Includes base wages, benefits, overtime, and shift premiums. Overtime alone typically accounts for 15–22% of total labor cost — and it's the most controllable portion.
Materials & spare parts
28%
Parts consumed on work orders plus warehouse carrying cost. Emergency procurement premiums (40–60% above standard pricing) inflate this number by $200K–$600K annually at most plants.
Contractors & external services
18%
Specialized work — refractory, electrical testing, vibration analysis, major overhauls, shutdown contractor crews. Volatile category — can spike 40–60% during shutdown years.
Maintenance vehicles, lifting equipment, welding machines, portable instruments, workshop tooling. Often under-budgeted, leading to technicians sharing tools and losing wrench time.
Training, software & administration
6%
CMMS licenses, training programs, technical documentation, condition monitoring subscriptions. The category most likely to get cut in a budget squeeze — and the one that pays back the most per dollar.
The Budget That Finance Actually Approves
Maintenance managers who submit budgets based on "we need more money" get cut. Maintenance managers who submit budgets based on "here's what each dollar prevents" get funded. The difference is data — and CMMS provides it.
The Budget That Gets Cut
"We need $14.2M for maintenance next year"
Based on last year's spend + 5% inflation adjustment
No breakdown by equipment area or maintenance type
No connection between spending and production outcomes
Finance sees a cost center requesting more money
Result: Budget cut 8–12%. Maintenance manager scrambles to decide what to defer.
vs
The Budget That Gets Funded
"$14.2M prevents $38M in failure costs and recovers 4,200 production hours"
Built bottom-up from CMMS data: equipment condition, failure history, PM schedules, parts consumption
Every line item linked to specific equipment and specific risk if deferred
Cost-per-tonne trending shows maintenance efficiency improving year over year
Finance sees a revenue protection investment with documented returns
Result: Budget approved as submitted. Finance asks when CMMS data will be available for other departments.
Plants building data-driven budgets should sign up to see how CMMS generates the equipment-level cost data that makes budget requests undeniable.
Cost Per Tonne: The One Metric That Matters
Total maintenance spend is a meaningless number without context. $14 million sounds expensive until you realize the plant produced 2.5 million tonnes — that's $5.60 per tonne. Cost per tonne normalizes maintenance spending against production volume, making it comparable across time periods, across plant areas, and against industry benchmarks.
Maintenance Cost Per Tonne = Total Maintenance Spend ÷ Total Tonnes Produced
$14,000,000 ÷ 2,500,000 tonnes = $5.60 / tonne
Industry Benchmarks (Integrated Steel Plant)
Under $30/t
Top quartile — highly optimized, mature CMMS, predictive maintenance culture. Risk: may be under-investing if achieved through budget cuts rather than efficiency.
$30–$45/t
Average — typical for plants with structured PM programs. Opportunity to reduce by 15–25% through CMMS optimization without increasing risk.
Over $45/t
Below average — reactive maintenance culture driving up emergency costs. Significant opportunity — CMMS implementation typically reduces cost per tonne by $8–$15 within 18 months.
The goal isn't the lowest cost per tonne — it's the optimal cost per tonne. Cut too deep and breakdowns multiply, costing far more than the savings. The sweet spot is where every additional dollar spent on prevention saves more than a dollar in avoided failures.
Planned vs. Actual: Catching Overruns Before They Compound
A maintenance budget that's reviewed annually is a historical document. A maintenance budget tracked monthly against plan in CMMS is a management tool. The variance between planned and actual spending — by area, by cost type, by month — tells you where control is working and where it's slipping before small overruns become annual budget blowouts.
Hot Rolling Mill
$2,180K
$2,340K
+$160K (7.3%)
Two unplanned bearing replacements in Q2 ($85K each) — not in PM forecast. Root cause investigation underway.
Steelmaking
$1,650K
$1,520K
–$130K (7.9%)
Refractory campaign extended 180 heats beyond plan through condition-based gunning. Reline deferred to next quarter.
Caster
$1,240K
$1,280K
+$40K (3.2%)
Segment overhaul costs higher than estimated — vendor pricing increased 12% on roll bearings.
Blast Furnace
$2,400K
$2,280K
–$120K (5.0%)
Cooling system PM program preventing emergency repairs — 3 fewer unplanned stops vs. prior year same period.
Utilities
$920K
$890K
–$30K (3.3%)
On track. Compressor overhaul completed under budget due to early parts procurement at standard pricing.
Every Dollar Planned. Every Variance Explained. Every Budget Defensible.
OxMaint tracks maintenance spending in real time against budget — by area, by cost type, by month. Variance alerts flag overruns before they compound. Cost-per-tonne trending proves efficiency. And the equipment-level cost data builds the budget that finance approves without cuts.
Seven Levers That Reduce Cost Without Increasing Risk
Cutting maintenance budget isn't cost control — it's risk transfer from today's budget to tomorrow's breakdown. Real cost control means spending the same or less while getting more reliability. These seven levers accomplish that — and each one is measurable through CMMS data.
1
Shift the Planned/Reactive Ratio
Saves 15–25% of corrective spend
Reactive maintenance costs 3–5× more than planned maintenance for the same repair. Every percentage point shifted from reactive to planned reduces total cost. CMMS tracks the ratio — most plants start at 70/30 reactive/planned and target 30/70 within 18 months.
2
Eliminate Emergency Parts Premiums
Saves $200K–$600K / year
Emergency parts sourcing adds 40–60% to purchase price plus $500–$2,000 in expedited freight per event. Preventing breakdowns through PM means parts are procured at standard pricing with standard lead times. CMMS forecasts parts consumption from PM schedules so purchasing buys ahead, not behind.
3
Right-Size PM Frequencies
Saves 10–20% of PM labor cost
Not every PM task needs to be done at the frequency it's scheduled. CMMS failure data reveals which PM tasks actually prevent failures and which are just consuming labor hours without benefit. PM optimization — adjusting frequencies based on equipment condition data — typically eliminates 10–20% of PM hours without increasing failure rates.
4
Reduce Overtime Through Better Planning
Saves $150K–$400K / year
Overtime should be for genuine emergencies, not for catching up on work that could have been planned during normal shifts. CMMS work order scheduling ensures the right work is assigned to the right shift with the right parts available — reducing the "we couldn't get to it during the day so we're working Saturday" pattern.
5
Dispose of Obsolete Inventory
Frees $1.5M–$4M in capital (one-time)
Every steel plant warehouse has $1.5–$4M in parts for equipment that's been replaced or decommissioned. These parts cost $120K–$400K per year in carrying charges while sitting on shelves doing nothing. CMMS links parts to equipment — when equipment is retired, associated parts are flagged for disposal or transfer.
6
Extend Refractory and Consumable Campaigns
Saves 15–30% on refractory cost
Calendar-based refractory replacement leaves 20–40% of useful life on the table. Condition-based management — tracking wear rates by zone through CMMS — extends campaigns to their actual safe limit. Same concept applies to roll campaigns, filter media, and other consumables where condition data can replace time-based replacement.
7
Improve Wrench Time
Recovers 15–25% of productive labor hours
Studies consistently show that steel plant maintenance technicians spend only 30–35% of their shift actually performing maintenance — the rest is traveling, waiting for parts, finding information, getting approvals, and attending to administrative tasks. CMMS with mobile access puts work orders, procedures, parts location, and approval workflows in the technician's hand — pushing wrench time toward 50–55%.
Plants implementing cost control measures should book a free demo to see how CMMS provides the cost visibility that makes each lever measurable and trackable.
Building Next Year's Budget: The CMMS-Driven Process
The budget building process should take 3–4 weeks, not 3–4 months. When CMMS contains 12 months of accurate cost data, equipment condition assessments, and upcoming PM schedules, the budget builds itself from the bottom up — every line item justified by data, not by negotiation.
Week 1
Pull CMMS Cost History
Extract last 12 months actual cost by area, by cost type, by maintenance type (PM, corrective, predictive, project). Identify trending: which areas are costing more vs. last year and why. This is your baseline — the facts, not opinions.
Week 2
Add Known Future Requirements
Scheduled shutdowns, planned relines, major overhauls on the calendar, equipment reaching replacement age (from CMMS lifecycle data), new regulatory requirements, and any capital projects that add equipment to the maintenance portfolio. These are the "non-negotiable" items in the budget.
Week 3
Apply Improvement Targets
Reduce the corrective maintenance line by the percentage you expect PM improvements to deliver. Reduce overtime by the amount better planning should recover. Reduce parts premiums by the stock-out prevention estimate. These reductions make the budget credible — you're not just asking for money, you're committing to delivering more value for it.
Week 4
Package With Risk Context
For every discretionary line item, include the risk of deferral: "If this $180K PM program is cut, the expected additional corrective cost is $420K–$680K based on 3-year failure history from CMMS." Finance doesn't have to trust your judgment — they can verify the numbers in the system. That's what makes the budget defensible.
Expert Perspective: Maintenance Is an Investment, Not an Expense
I've managed maintenance budgets at four steel plants over 20 years, and the shift that changed everything was when we stopped presenting maintenance as a cost to be minimized and started presenting it as an investment to be optimized. The language matters. When the budget submission says "maintenance department requests $14.2M," finance sees a cost center asking for money. When it says "a $14.2M maintenance investment protects $380M in annual production revenue and reduces failure risk by 65% vs. prior year," finance sees a business proposition. CMMS made that shift possible because it gave us the data to back the claims. We could show the cost of every breakdown — not just the repair cost, but the production loss, the overtime, the expedited parts, the quality holds downstream. When you can demonstrate that a $45,000 predictive maintenance program on the rolling mill main drives prevented $620,000 in failure costs last year — documented with work orders, cost records, and production data — the budget conversation changes permanently. My advice to every maintenance manager preparing a budget: spend 80% of your preparation time on the return side, not the cost side. Everyone knows what maintenance costs. Nobody knows what it prevents — unless you show them the data.
Track Cost of Failure Alongside Cost of Prevention
Every CMMS work order for an unplanned repair should include production loss cost — not just repair cost. When your data shows corrective maintenance costs $3.2M in repair labor and materials but $8.4M in production losses, the investment case for prevention becomes self-evident.
Review Budget Monthly, Not Annually
A budget reviewed once a year is an autopsy. A budget reviewed monthly is a management tool. CMMS variance reports by area by month catch overruns at $40K — when they're correctable — instead of at $400K when the year is already lost.
Never Cut Training and Software First
When budgets are tight, training and CMMS licenses are the first line items cut because they're the easiest to defer. They're also the line items with the highest return per dollar. Cutting a $22,000 training program to "save money" while spending $340,000 on breakdowns that trained technicians would have prevented is not cost control — it's false economy.
Every Dollar Tracked. Every Budget Data-Driven. Every Investment Justified.
OxMaint gives maintenance managers the cost visibility that finance teams trust — real-time spend tracking by area, planned vs. actual variance, cost-per-tonne trending, equipment-level cost history for capital justification, and the prevented-failure documentation that proves maintenance is the highest-return investment in the plant.
Frequently Asked Questions
What is a good maintenance cost per tonne for a steel plant?
Top-quartile plants achieve under $30/tonne. Average is $30–$45/tonne. Above $45/tonne indicates a reactive maintenance culture with significant optimization opportunity. The goal is optimal cost per tonne — not the lowest, which can signal under-investment.
How does CMMS reduce maintenance costs?
By shifting spending from reactive to planned (3–5× cheaper per repair), eliminating emergency parts premiums, optimizing PM frequencies, reducing overtime, identifying obsolete inventory, extending consumable campaigns through condition monitoring, and improving technician wrench time. Typical reduction: 18–30% of total maintenance cost within 18 months.
How should a steel plant maintenance budget be structured?
Bottom-up from CMMS data: 12-month cost history by area, scheduled shutdowns and relines, equipment lifecycle requirements, PM schedule costs, and improvement targets. Every line item linked to specific equipment and specific risk-of-deferral. Budget built in 3–4 weeks when CMMS data is available — not months of negotiation.
What is the right balance between planned and reactive maintenance?
Target: 70% planned (PM + predictive + condition-based) and 30% reactive. Most plants start at the opposite ratio. Shifting from 70/30 reactive to 70/30 planned typically reduces total maintenance cost by 25–35% while simultaneously improving equipment availability by 5–10 percentage points.
How often should maintenance budget vs. actual be reviewed?
Monthly — by area and by cost type. CMMS generates the variance report automatically. Monthly review catches overruns at $40K when corrective action is still possible, instead of at year-end when $400K in cumulative variance is already spent. Include variance driver explanation so the numbers tell a story, not just show a spreadsheet.