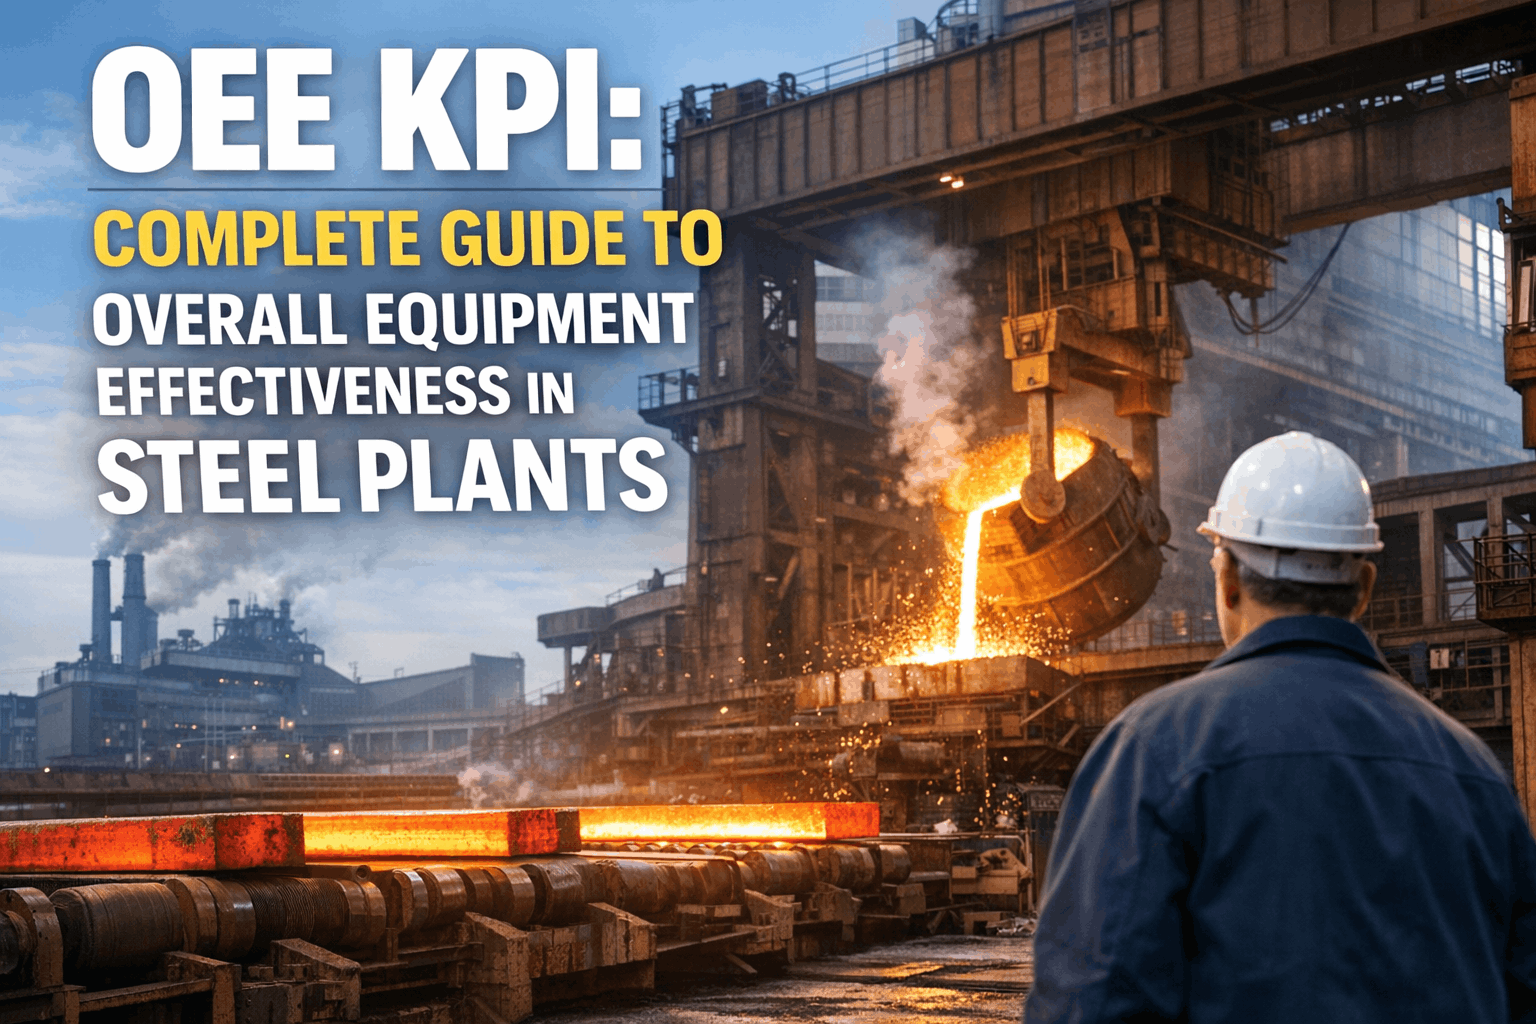
The average steel plant operates at 52–58% OEE. World-class facilities hit 78–85%. That 20–30 point gap represents $15M–$45M in unrealized production value per year for a typical integrated mill. Thegap isn't about equipment—plants running identical casters, mills, and furnaces produce vastly different OEE numbers. The difference is how maintenance, quality, and operations interact. This page breaks down what world-class OEE looks like across every major steel process area in 2026, where your plant likely stands, and the specific maintenance and operational changes that close the gap.
Industry Average
Most plants operate here
Good Performance
Top 25% of steel plants
World-Class
Top 5% — the target
Understanding OEE in Steel Manufacturing
OEE measures how effectively a production asset converts available time into quality output. It's the product of three factors — each one revealing a different category of loss that maintenance and operations teams can attack. Plants using OXmaint's CMMS platform track all three in real time across every process area.
Availability
Running Time ÷ Planned Production Time
Average:82–86%
World-class:92–95%
Key losses: Unplanned breakdowns, changeovers, startup/shutdown delays, material shortages, upstream/downstream stoppages
Biggest lever: Predictive maintenance eliminates 40–60% of unplanned downtime — the single largest availability loss in steel plants
Performance
Actual Output ÷ Theoretical Maximum Output
Average:78–84%
World-class:90–95%
Key losses: Speed reductions from equipment degradation, minor stoppages, idling, reduced casting speed due to mold condition, mill speed limits from roll wear
Biggest lever: Condition-based maintenance keeps equipment at optimal operating parameters instead of gradually degrading between fixed PM intervals
Quality
Good Product ÷ Total Product
Average:85–90%
World-class:96–99%
Key losses: Surface defects, off-gauge product, internal cracks, inclusion-related rejects, downgraded material sold at lower prices
Biggest lever: Equipment condition directly drives quality — worn molds create surface defects, misaligned rolls create shape defects, degraded cooling creates internal cracks
"
OEE in steel is fundamentally a maintenance metric. Availability is maintenance. Performance is equipment condition. Quality is process control — which depends on equipment precision. Fix the maintenance, and OEE follows.
2026 OEE Benchmarks by Process Area
OEE varies dramatically across process areas within the same plant. The blast furnace and caster operate under fundamentally different constraints than the rolling mill or finishing lines. Here's where world-class plants stand in 2026 — and where the gaps hide for average performers.
Average OEE: 68%World-Class: 88%
Gap driver: Unplanned stops from tuyere failures, cooling stave leaks, and blower trips.
Digital BF maintenance closes 70% of the availability gap through early detection.
Average OEE: 55%World-Class: 78%
Gap driver: Refractory relining frequency, lance and electrode changes, crane delays, and tap-to-tap cycle time losses. Transformer and crane maintenance are the biggest single-equipment availability factors.
Average OEE: 55%World-Class: 80%
Gap driver: Breakouts, sequence terminations, mold changes, and segment maintenance.
AI-driven caster scheduling prevents 70–85% of breakouts and extends component life 20–40%.
Average OEE: 58%World-Class: 85%
Gap driver: Main drive bearing failures, gearbox problems, roll changes, and cobbles. Bearing and gearbox predictive monitoring eliminates the costliest unplanned stops.
AI failure detection catches 91% of developing failures 20–45 days early.
Average OEE: 49%World-Class: 79%
Gap driver: Highest quality sensitivity on this list. Surface defects, gauge variation, and flatness issues dominate losses. Equipment precision maintenance — roll condition, hydraulic gap control, and tension system health — directly determines quality rate.
Industry average
World-class 2026
Know Where You Stand — Then Close the Gap
OXmaint tracks OEE across every process area in real time, breaking losses into the specific maintenance and operational categories your team can act on.
The Maintenance–OEE Connection
Maintenance drives 60–70% of OEE in steel manufacturing. Availability losses from breakdowns are the obvious connection, but maintenance also determines performance (degraded equipment runs slower) and quality (worn components produce defects). Here's how each maintenance improvement translates directly to OEE gains.
Predictive maintenance on critical assets
AI monitoring on top 40–80 assets. Catches 85–92% of developing failures 20–45 days before breakdown.
Condition-based PM intervals
Replace time-based schedules with condition-based timing. Equipment runs at design parameters longer between interventions.
Digital shutdown management
15–25% shorter planned outages through better task sequencing, contractor coordination, and real-time progress tracking.
Equipment precision maintenance
Mold copper tracking, roll profile management, hydraulic gap control, and cooling system optimization — all tied to product quality outcomes.
Digital shift handovers
Eliminate verbal-only handovers that lose information between shifts. Every open issue, trending concern, and pending task transfers digitally.
Combined OEE Improvement Potential
+15–25 points
Moving from 55% average to 70–80% world-class territory within 18–24 months
What +1 OEE Point Is Worth
In steel manufacturing, small OEE improvements translate to enormous financial value because of the capital intensity and high throughput. Here's what each additional OEE point means in dollar terms across different plant sizes.
Plant Size
Value of +1 OEE Point
Value of +10 Points
Value of Reaching World-Class
500K tons/yr (mini-mill)
$350K–$500K
$3.5–5M
$8–12M
2M tons/yr (mid-size integrated)
$1.2–1.8M
$12–18M
$25–45M
5M tons/yr (large integrated)
$3–4.5M
$30–45M
$60–100M
"
A 2M ton integrated mill improving OEE from 55% to 75% unlocks $25–45M in annual production value — without adding equipment, people, or floor space. The capacity was always there. It was trapped inside maintenance-driven losses.
Turn Maintenance Improvements Into OEE Gains You Can Measure
OXmaint connects maintenance activities directly to OEE outcomes — so every work order, PM task, and predictive alert ties back to availability, performance, and quality improvements your leadership can see.
The Roadmap: From Average to World-Class
Plants don't jump from 55% to 80% overnight. The journey follows a predictable progression — each phase building the foundation for the next. OXmaint supports every phase with the right tools at the right stage.
Phase 1 · Months 1–6
Foundation (55% → 62%)
Digitize work orders and eliminate paper-based tracking
Deploy predictive monitoring on top 20–40 critical assets
Establish real-time OEE measurement by process area
Implement digital shift handovers
Expected gain: +5–7 OEE points from eliminated breakdowns and better information flow
Phase 2 · Months 6–12
Optimization (62% → 70%)
Expand predictive monitoring to 80–120 assets
Replace fixed PM intervals with condition-based scheduling
Optimize shutdown planning with digital task management
Connect maintenance data to quality outcomes
Expected gain: +6–8 OEE points from condition-based operations and shorter outages
Phase 3 · Months 12–24
World-Class (70% → 78–85%)
AI-driven maintenance scheduling across all process areas
Prescriptive analytics recommending optimal maintenance timing
Integrated supply chain ensuring parts availability aligns with predictions
Continuous improvement loop with AI learning from every outcome
Expected gain: +5–10 OEE points from system-wide optimization and prescriptive operations
Real Results
55% → 76%
OEE improvement at a 2.5M ton integrated mill over 18 months using OXmaint's full platform
$28M/yr
Annual value unlocked from the 21-point OEE improvement through increased throughput and reduced quality losses
42%↓
Reduction in unplanned downtime — the single biggest contributor to the OEE gain
94%
Planned maintenance ratio achieved — up from 40% before digital transformation
Every point of OEE improvement started with better maintenance. The equipment didn't change — the way it was maintained did. Learn how OXmaint's integrated platform manages predictive maintenance across every process area, how AI failure detection eliminates the unplanned stops that destroy availability, how continuous caster AI scheduling prevents breakouts, how blast furnace digital management extends campaign life, and how surface defect inspection closes the quality gap.
Your OEE Number Is a Maintenance Number. Improve One, Improve Both.
OXmaint connects every work order, every sensor alert, and every predictive insight directly to the OEE outcomes your plant measures. One platform. Every process area. Measurable results.
Frequently Asked Questions
What's a realistic OEE target for a steel plant that's currently at 55%?
70% within 12 months and 75–80% within 24 months is realistic with committed implementation. The first 10 points come relatively fast from eliminating major unplanned events and digitizing basic processes. The next 10–15 points require condition-based scheduling and cross-system optimization.
Should we measure OEE at the plant level or the process area level?
Both, but act at the process area level. Plant-level OEE is useful for executive reporting but hides where the losses actually live. A plant at 55% might have a blast furnace at 68% and a caster at 48% — very different problems requiring very different solutions.
How does OXmaint calculate OEE from maintenance data?
OXmaint integrates with your process control and production systems to capture availability (downtime events categorized by cause), performance (actual vs theoretical output rates), and quality (conforming vs total production). Every maintenance event is tagged with its OEE impact — so you can see exactly how much each equipment failure costs in OEE terms.
Which OEE factor should we focus on first?
Almost always availability. Unplanned downtime is the largest single loss category in most steel plants, and predictive maintenance delivers the fastest, most measurable improvement. Once availability reaches 90%+, shift focus to performance and quality — which require more granular equipment condition management.
How do world-class plants sustain 80%+ OEE long-term?
Continuous improvement loops. AI systems learn from every failure and every successful prevention, refining predictions and scheduling over time. The gap between world-class and average isn't a one-time fix — it's a permanently higher operating standard maintained by better data, faster decisions, and relentless focus on eliminating losses.

.png)