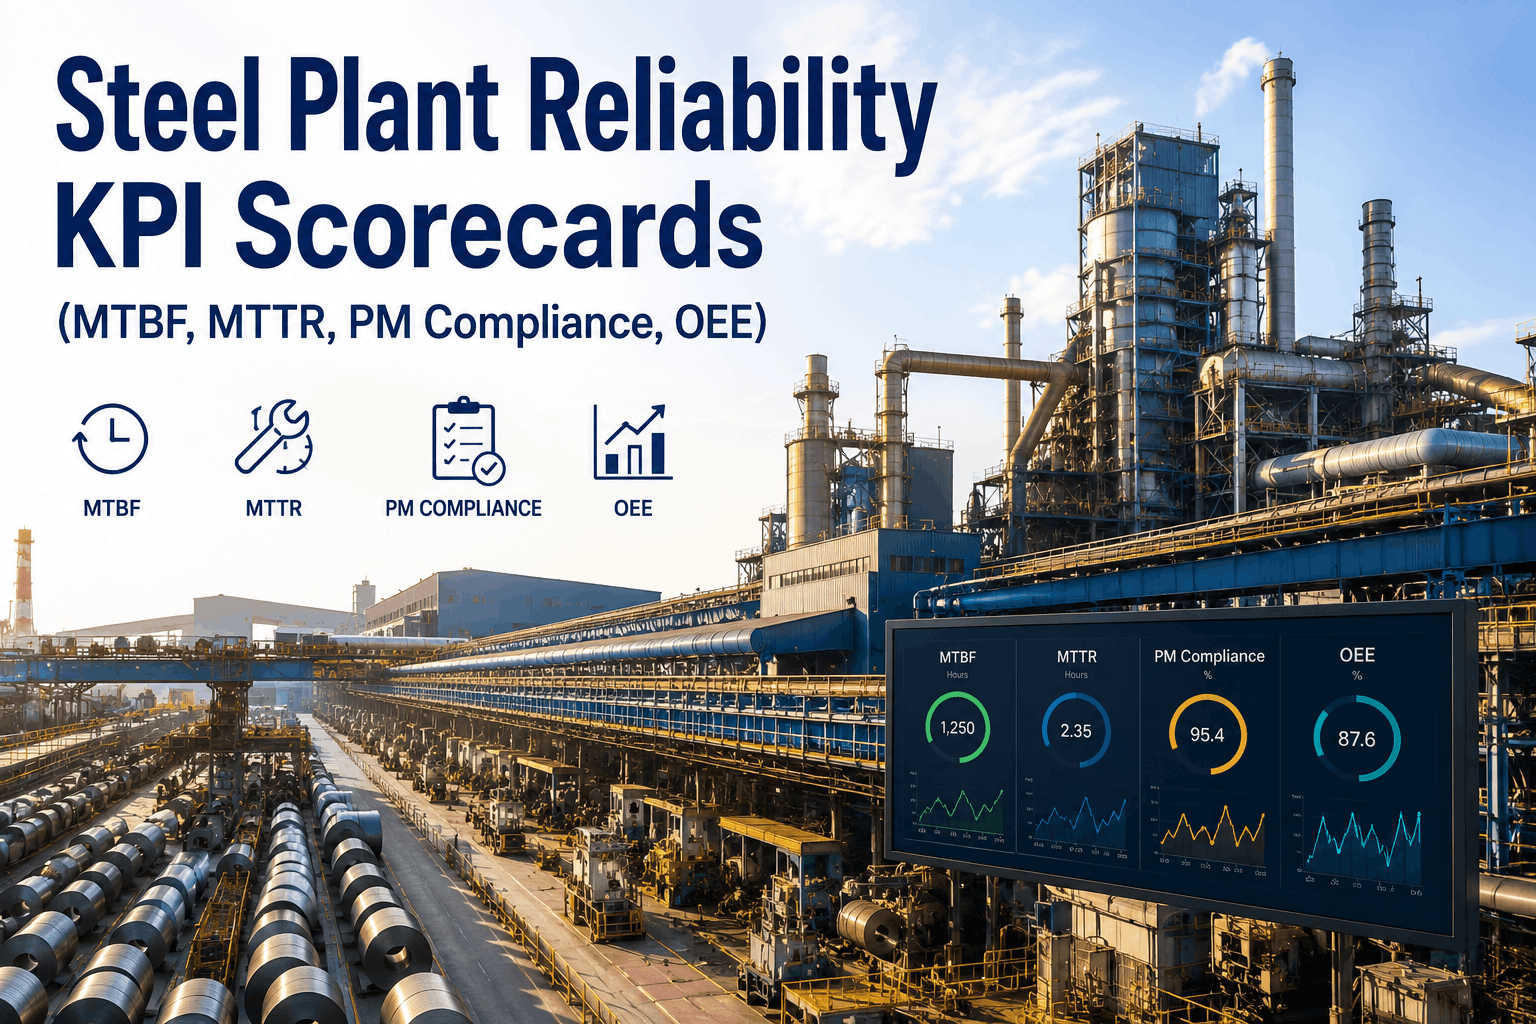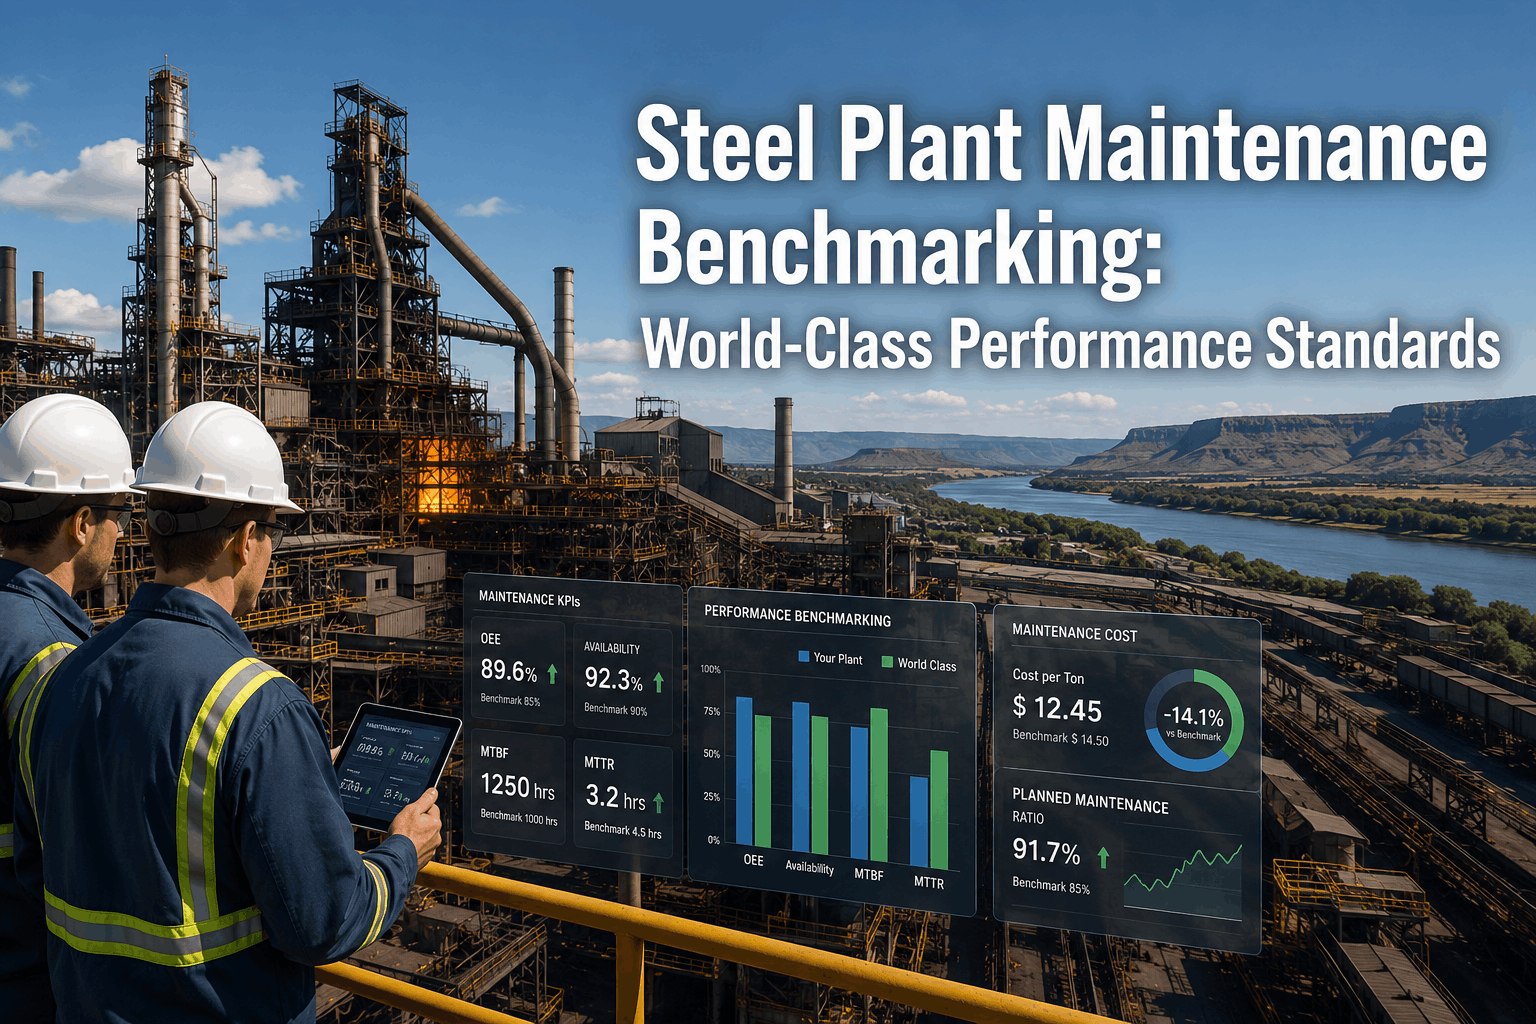
Steel plant maintenance performance is not subjective — it is measured and benchmarked against industry standards. A rolling mill with 88% overall equipment effectiveness (OEE) and mean time to repair (MTTR) of 6.2 hours is performing at world-class level. The same mill at 72% OEE and 12.5-hour MTTR is struggling with reactive maintenance and cost bleed. Industry benchmarking data from ASME, SMRP (Society for Maintenance and Reliability Professionals), and steel industry associations reveals critical performance gaps in 60-70% of North American steel plants. World-class benchmarks for integrated steel mills: OEE 88-92%, MTBF (mean time between failures) 850-1,200 hours, MTTR 4-6 hours, planned maintenance ratio 80-85%, maintenance cost per ton of steel $22-$32, emergency work order percentage 8-12%. Average USA steel plants: OEE 72-78%, MTBF 450-680 hours, MTTR 10-14 hours, planned maintenance ratio 55-65%, maintenance cost per ton $38-$52, emergency work orders 25-35%. The gap represents millions in lost production, excess maintenance spending, and reduced equipment lifespan. OxMaint's CMMS benchmarking dashboard compares your facility's KPI performance against industry standards — identifying performance gaps and quantifying improvement ROI to justify reliability investments.
Steel Plant Maintenance Benchmarking: Compare Your KPIs Against World-Class Performance Standards
Assess OEE, MTBF, MTTR, and cost-per-ton metrics against industry benchmarks. Identify performance gaps, quantify improvement ROI, and create data-driven reliability improvement targets for your rolling mill or integrated steel facility.
Section 1: Core Reliability KPIs — Understanding MTBF, MTTR, and OEE
Three KPIs define steel plant reliability: MTBF (Mean Time Between Failures), MTTR (Mean Time To Repair), and OEE (Overall Equipment Effectiveness). MTBF measures the average operating hours between equipment failures. World-class rolling mills target 850-1,200 hours MTBF, meaning a critical bearing or pump fails roughly once per month of continuous operation. Average steel plants operate at 450-680 hours MTBF — failures occur 2-3× more frequently, consuming technician time on emergency repairs instead of preventative work. MTBF is driven by maintenance quality (preventative vs. reactive), technician skill, and component reliability — all manageable factors. Steel plants improving MTBF from 500 to 950 hours typically invest $400,000-$1,200,000 in CMMS platforms, technician training, and predictive maintenance infrastructure, recovering investment within 24-36 months through reduced emergency labor, spare parts inventory optimization, and extended equipment life. MTTR measures the average time from failure detection to equipment return to operation. World-class MTTR: 4-6 hours. Average steel plant MTTR: 10-14 hours. Factors influencing MTTR: (1) diagnostic time (is it a bearing or seal? electrical or mechanical?), (2) spare parts availability (is the replacement pump in stock or must it be ordered?), (3) technician skill (can the repair be done safely and correctly first time?). Steel plants reducing MTTR from 12 hours to 5 hours typically implement: spare parts inventory management with SAP integration, work order pre-staging with parts pre-kitting, and technician skill development in rapid diagnostics. OEE combines availability (% time equipment is operable), performance (% of maximum speed achieved), and quality (% of good output) into a single metric: OEE = Availability × Performance × Quality. An OEE of 85% means the equipment is available 95%, running at 90% of maximum speed, and producing 99% good output — realistic targets for well-maintained rolling mills. Breakdown OEE reveals where improvement opportunities lie: if availability is 78% (failures causing downtime), focus on MTBF and MTTR improvement. If performance is 84% (speed loss from wear), focus on component wear analysis and replacement intervals. If quality is 93% (scrap/rework), focus on process control calibration.
| KPI Metric | World-Class Benchmark | Average USA Steel Plant | Performance Gap |
|---|---|---|---|
| OEE (Overall Equipment Effectiveness) | 88–92% | 72–78% | 10–20 percentage points lost to failures and speed loss |
| MTBF (Mean Time Between Failures) | 850–1,200 hours | 450–680 hours | Failures 2–3× more frequent; reactive maintenance dominant |
| MTTR (Mean Time To Repair) | 4–6 hours | 10–14 hours | Downtime 2–3× longer due to diagnostics, parts wait, skill gaps |
| Planned Maintenance Percentage | 80–85% | 55–65% | 20–30 pts gap: too much reactive, insufficient preventative |
| Emergency Work Orders % | 8–12% | 25–35% | 2–4× more emergency repairs; reactive maintenance culture |
| Maintenance Cost per Ton | $22–$32 | $38–$52 | $10–$20 per ton cost premium (50–70% above best-in-class) |
Section 2: Maintenance Spend Benchmarking — Cost Per Ton and Budget Efficiency
Steel plants operate on razor-thin profit margins. Raw steel mills report 8-12% EBITDA (earnings before interest, taxes, depreciation, amortization). Maintenance cost directly impacts profitability. A 200-ton-per-day rolling mill at world-class maintenance cost ($28/ton) spends $5,600 daily on maintenance ($2.04M annually). The same mill at average-level maintenance ($48/ton) spends $9,600 daily ($3.50M annually). The difference: $1.46M per year in excess maintenance spending. This $1.46M represents preventable failures, extended downtime, excess emergency labor, obsolete spare parts inventory carrying costs, and suboptimal equipment utilization. Benchmarking maintenance spend requires normalizing by production scale (cost per ton), equipment age (older equipment typically requires 20-30% more maintenance), and production complexity (continuous casting is simpler than discontinuous hot rolling). World-class benchmark: 1.8-2.2% of total revenue spent on maintenance. Average USA steel plant: 3.1-3.8% of revenue. For a $400M revenue integrated mill, this gap represents $5.2M-$6.4M in annual maintenance cost premium. Steel plants closing the gap typically: (1) implement CMMS to eliminate reactive work order overlap and improve scheduling efficiency, (2) develop predictive maintenance for critical bearings and motors (ultrasonic sensors, temperature monitoring, vibration analysis), (3) optimize spare parts inventory using ABC inventory classification and just-in-time supplier relationships, (4) eliminate unnecessary planned maintenance tasks (audit every PM task to verify it prevents failure or extends life), and (5) invest in technician skill to reduce rework and first-time-fix rate. CMMS cost benchmarking modules track maintenance spend by equipment family, cost per ton, and cost per failure event — enabling data-driven spending reduction without sacrificing reliability.
Section 3: Planned Maintenance Ratio — The Strategic Metric for Reliability Maturity
Planned Maintenance Ratio (PMR) is calculated as: (Planned Work Orders / Total Work Orders) × 100. It measures the percentage of maintenance work that is preventative versus reactive. World-class rolling mills: 80-85% PMR means 80-85% of maintenance is scheduled preventatively; only 15-20% is emergency reactive work. Average USA steel plants: 55-65% PMR means almost half of maintenance is reactive emergency response. The difference is profound: planned maintenance allows technicians to work at normal pace with appropriate tools, parts staging, and workspace setup. Emergency maintenance is rushed, chaotic, often involves rework or wrong-first-time-fix. A 200-technician steel plant spending 40% of time on reactive work versus 20% represents 40 technicians-worth of capacity wasted on inefficiency. PMR improvement is a strategic priority. Most steel plants increase PMR from 60% to 80% by: (1) implementing CMMS with automated PM scheduling (rolling calendar ensures no task slips), (2) expanding predictive maintenance for critical equipment (instead of waiting for bearing failure, replace at ultrasonic alert), (3) standardizing PM task intervals per equipment type (pump preventative maintenance every 1,500 hours, bearing inspection every 2,000 hours), and (4) allocating dedicated technician capacity to planned maintenance work (do not let emergency calls interrupt planned work; use separate technician crews). Steel plants with 80%+ PMR report: 18-28% reduction in total maintenance cost, 25-35% improvement in MTBF, 30-45% reduction in MTTR, and 8-12 percentage point improvement in OEE. The PMR metric is leading indicator of organizational maintenance maturity: below 50% indicates reactive firefighting culture; 50-70% indicates transitioning toward planned; 70-85% indicates mature; 85%+ indicates world-class predictive culture. Track PMR monthly as a dashboard metric for plant leadership — it reveals true organizational capability.
Section 4: Equipment-Specific Benchmarks — MTBF and Maintenance Cost by Asset Class
Different equipment families have different reliability benchmarks. A centrifugal pump in a cooling water system targets different MTBF than a high-pressure hydraulic pump on a caster. Rolling mill benchmarks vary by equipment type: Rolling mill motors (AC induction, 200-1500 kW) — World-class MTBF 1,800-2,400 hrs, cost per failure $8K-$18K (bearing, winding failure, efficiency loss). Average MTBF 1,000-1,400 hrs. Hydraulic systems (servo and proportional valves) — World-class MTBF 1,200-1,800 hrs, cost per failure $15K-$35K (valve stiction, spool seal degradation). Average MTBF 600-900 hrs. Bearings (rolling element, all sizes) — World-class MTBF 2,000-3,600 hrs (L10 bearing life), cost per failure $3K-$12K (replacement, alignment, labor). Average MTBF 1,200-1,600 hrs. Gear drives — World-class MTBF 3,000-5,000 hrs (rarely fail if lubricated), cost per failure $25K-$80K (complete drive replacement, extended downtime). Average MTBF 2,000-3,000 hrs. Understanding equipment-specific benchmarks allows steel plants to set realistic targets. If your rolling mill caster bearings fail every 1,200 hours on average, benchmarking shows this is poor — world-class is 2,400+ hours. Investigate root causes: are bearings being lubricated per spec? Is load balanced? Is alignment within tolerances? Correcting these issues (proper lubrication program, load balancing, alignment audits) typically improves bearing MTBF 40-60%. CMMS equipment libraries include benchmark MTBF targets by equipment model and asset class — allowing facility managers to instantly see how their specific pump or motor is performing versus best-in-class.
Section 5: Benchmarking Action Plan — From Metrics to Improvement Projects
Benchmarking is valuable only when it drives action. A steel plant at 75% OEE and $44/ton maintenance cost should develop a targeted improvement roadmap: Year 1 Goal: Improve OEE to 80%, reduce cost per ton to $39. Improvement initiatives: (1) CMMS deployment with automated PM scheduling and equipment history tracking — expected OEE improvement 2-4%, cost per ton reduction $2-$4; (2) Technician training program with skill assessment and advanced diagnostics certification — expected MTBF improvement 8-12%, cost per ton reduction $1-$2; (3) Spare parts inventory optimization using ABC classification and just-in-time supplier relationships — expected cost per ton reduction $2-$3; (4) Predictive maintenance pilots on top 10 critical failures (bearings, motors, hydraulics) — expected MTBF improvement 15-20%, cost per ton reduction $2-$4. Cumulative Year 1 expected improvement: OEE +5-7 percentage points, cost per ton $7-$13 reduction. Year 2-3 goals: continue improving toward 85-88% OEE and $32-$35 cost per ton through further predictive maintenance expansion, advanced diagnostics adoption, and process automation. Establish quarterly benchmarking reviews with plant leadership: compare current KPIs to world-class targets and prior quarter results, identify top 3-5 improvement priorities, allocate resources, track progress monthly. Steel plants with structured benchmarking programs improve OEE by 12-18 percentage points and cost per ton by 30-50% over 3-4 years. The investment in CMMS, training, and predictive maintenance infrastructure ($800K-$2.5M depending on facility size) is recovered 2-4× through improved reliability and reduced maintenance costs. Schedule a benchmarking assessment to evaluate your steel plant's current KPI performance against world-class standards and develop a custom 3-year improvement roadmap.
Frequently Asked Questions
We discovered through benchmarking that our rolling mill was at 74% OEE while world-class mills run 88–92%. The cost gap was even more alarming: we were spending $47 per ton on maintenance versus $26 for best-in-class competitors. That gap meant $3.2M excess annual spending. We developed a 3-year improvement plan with CMMS, predictive maintenance, and technician training. In 30 months, we improved OEE to 82% and reduced cost to $34/ton. The combined improvement represents $2.8M in annual value—far exceeding our $1.1M infrastructure investment. Benchmarking transformed our maintenance culture from reactive to data-driven.
Benchmark Your Steel Plant Against World-Class Standards
Compare OEE, MTBF, MTTR, and cost-per-ton metrics instantly. Identify performance gaps, calculate improvement ROI, and create a data-driven 3-year reliability roadmap.