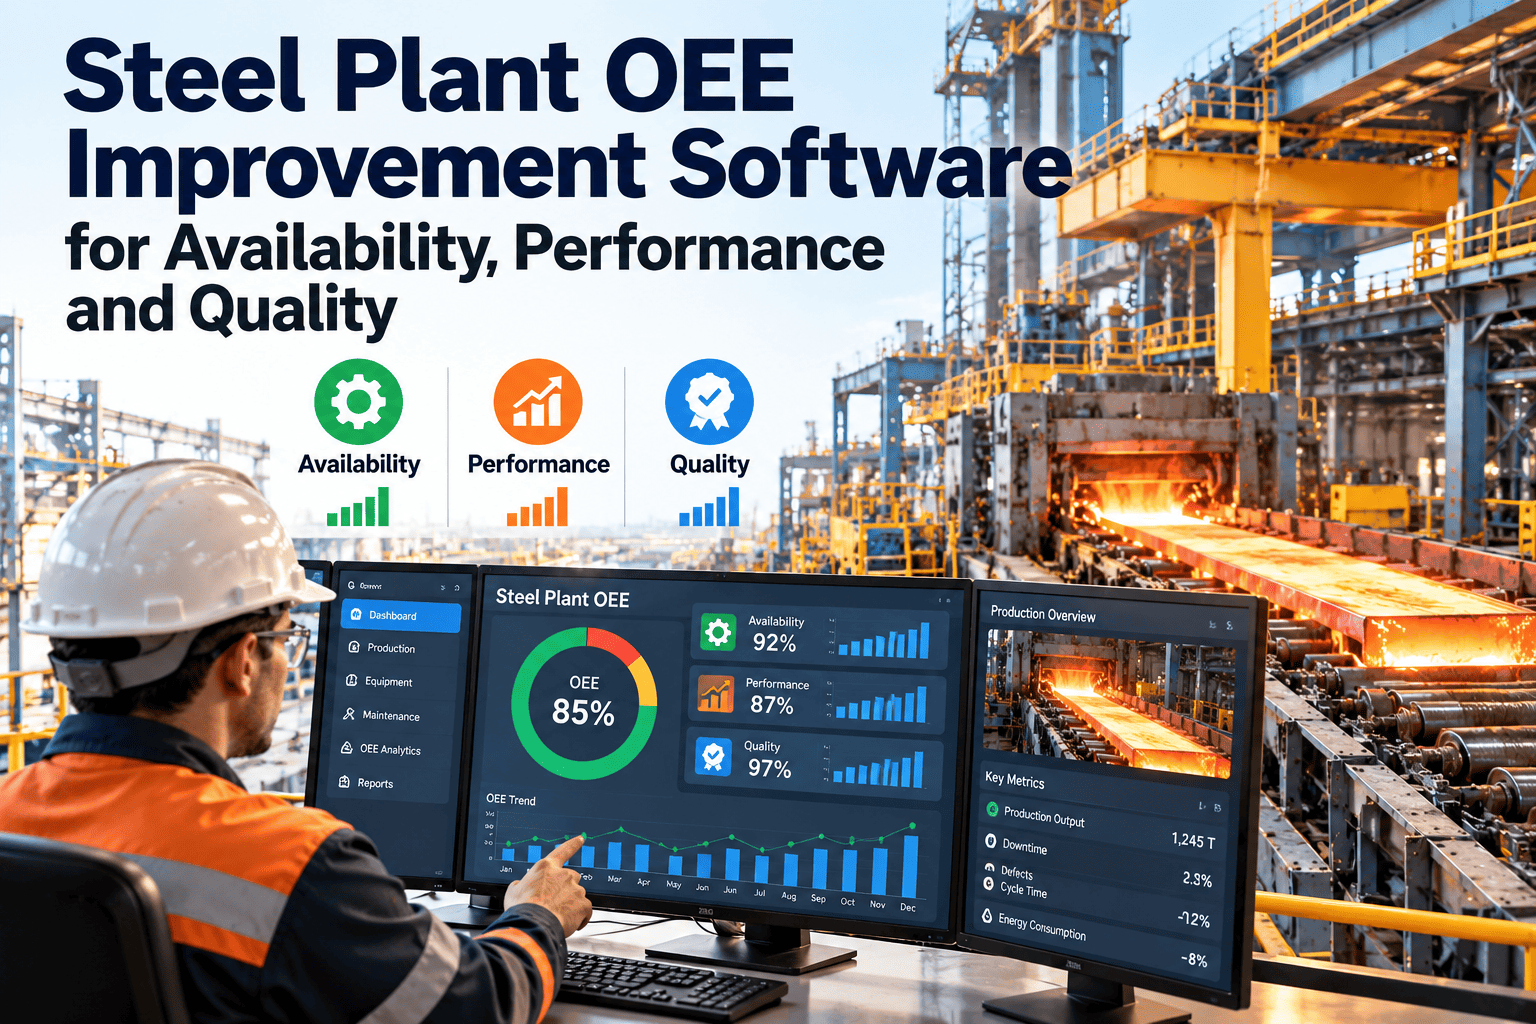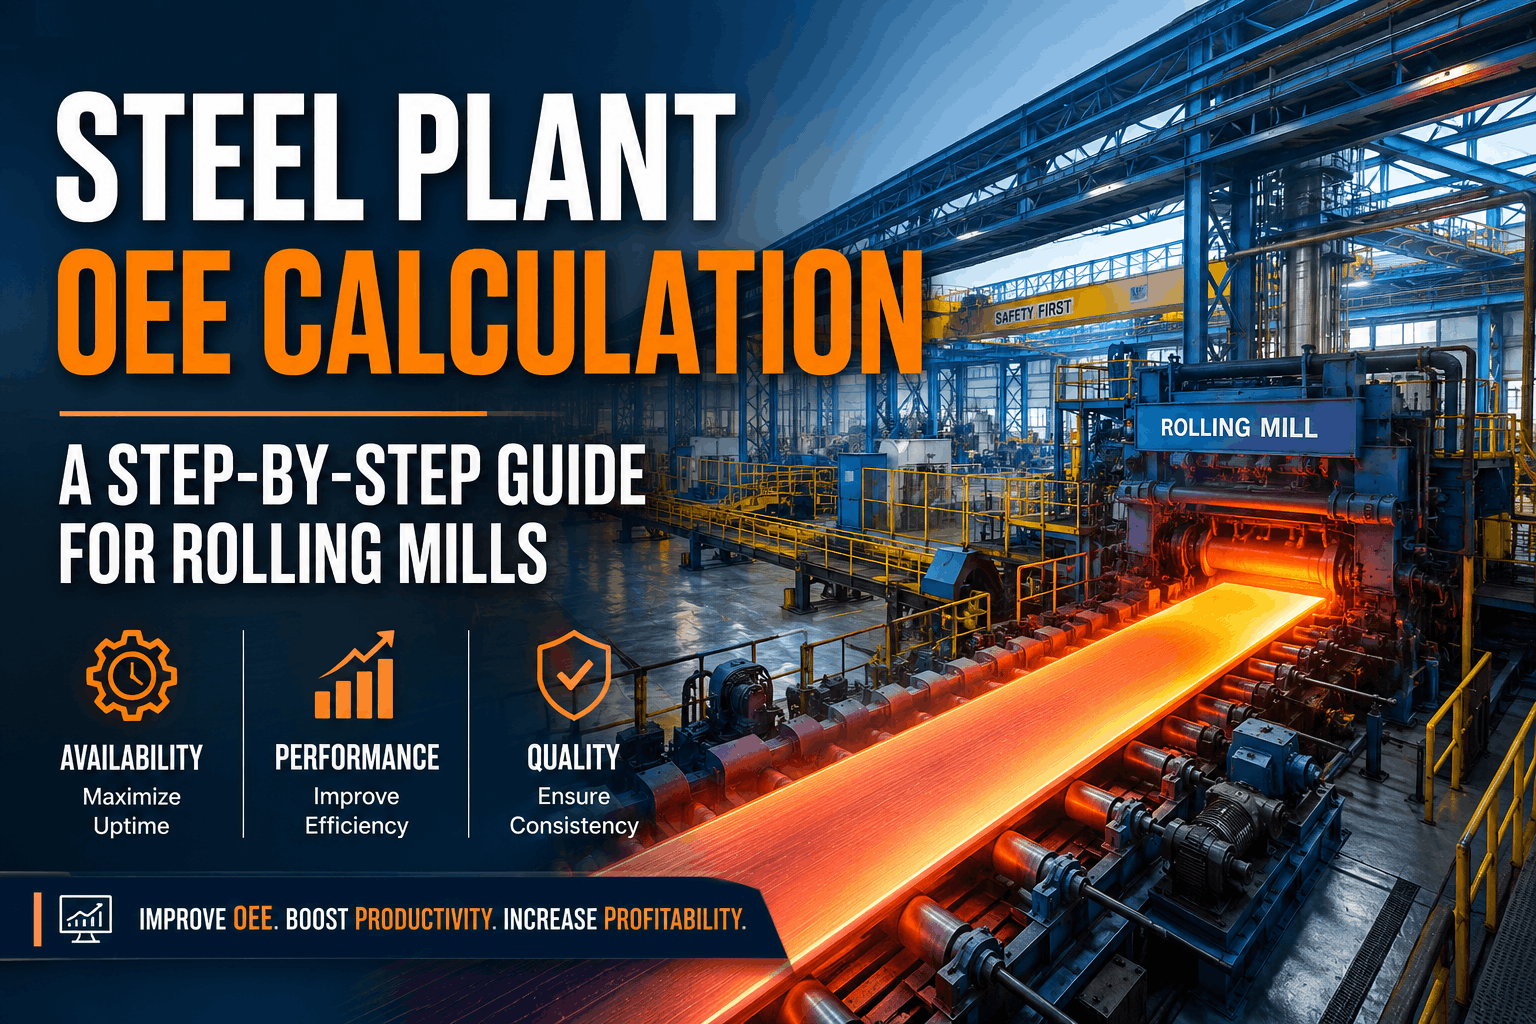
Overall Equipment Effectiveness (OEE) is the metric that answers the most critical question any rolling mill manager can ask: of all the time my mill was scheduled to produce, how much of it did I actually spend making good steel at full speed? An OEE score of 85% or higher is considered world-class in rolling mill operations. Most mills operate between 45–65%, meaning every single percentage point of improvement represents millions of dollars in recovered production capacity annually. For a 7-stand hot strip mill producing 2.5 million tonnes per year at an average selling price of $600 per tonne, each OEE percentage point equals approximately $15 million in production value. Yet most steel mills calculate OEE incorrectly, using simplified formulas that miss the nuance that makes the metric useful—the disaggregation into Availability, Performance, and Quality. A rolling mill with 82% OEE dragged down by 91% Availability has a maintenance and reliability problem. That same 82% OEE driven by 90% Performance has a scheduling and setpoint optimization problem. Driven by 94% Quality, it has a process control and raw material management problem. The aggregate number looks identical; the improvement investments needed are completely different. This comprehensive guide walks through OEE calculation step-by-step with real rolling mill data, reveals the six big losses hidden in your operation, and shows how OxMaint automates OEE tracking so your team focuses on eliminating losses rather than crunching spreadsheets.
The OEE Formula: Three Independent Factors, Three Improvement Levers
OEE is calculated as a simple multiplication: OEE = Availability × Performance × Quality. The mathematical elegance of this formula masks the operational complexity beneath each factor. Availability measures what percentage of scheduled production time the mill actually runs. It accounts for all events that stop production—planned changeovers, unplanned breakdowns, material handling delays, and maintenance windows. In rolling mill operations, a typical availability issue might be unplanned stops consuming 8–12% of scheduled time. Performance measures how fast the mill runs compared to its design rolling speed during the time it's actually operating. This is where most rolling mills hide their largest losses. A mill running 3% slower than nameplate speed because of roll deflection, stand vibration, or AGC (automatic gauge control) lag time loses 3% performance—which, multiplied across a 16-hour shift, represents $230,000 in lost production on a high-speed line. Quality measures the percentage of steel that meets specification—good gauge, surface condition, mechanical properties, and dimensional accuracy. Cobble scrap, off-spec strip, and internally graded downgrade material reduce quality rate. For steel mills operating at 95–97% quality rate, the 3–5% loss represents scrap, rework, and downgrade pricing that cuts directly into margin. The power of disaggregating OEE into three factors is that it points to distinctly different problems and improvement opportunities. A mill at 60% OEE that achieves 75% Availability has a maintenance credibility problem—likely reactive culture, inadequate PM discipline, or equipment condition issues. Book a Demo to see how OxMaint disaggregates your rolling mill's OEE and pinpoints exactly which factor deserves your improvement focus.
Calculating Availability: Measuring Time Your Rolling Mill Actually Runs
Availability is the percentage of scheduled production time your mill actually spends producing—not counting planned maintenance, intentional shutdowns, or force majeure events. The calculation appears simple: Availability = Run Time / Planned Production Time. But rolling mill environments demand precision in definitions. What is "Planned Production Time"? For a 7-stand hot strip mill, this is typically the shift length (8 hours) minus any known planned downtime (quality audit stops, planned maintenance windows, shift transitions). For a mill with three shifts per day, daily Planned Production Time = (24 hours – 2 hours of planned maintenance) = 22 hours × 3 shifts = 66 hours scheduled weekly. Run Time is the actual hours the mill produces—without stopping. Any stop lasting longer than five minutes is counted as downtime. In high-mix rolling operations, you'll encounter multiple sources of availability loss: unplanned breakdown stops (bearing failure, hydraulic leak, electrical issue), planned changeover stops (product grade changes, gauge adjustments, tooling maintenance), minor material handling delays, and quality holds while defective strip is diverted. For a typical hot strip mill, availability breaks down as: 85–90% from breakdowns, 5–8% from changeovers, 2–4% from material handling, and 1–2% from quality holds. Reducing availability loss requires different improvements for each category. A mill losing availability to breakdowns needs improved PM discipline and faster MTTR (mean time to repair). One losing availability to changeovers needs SMED (single-minute exchange of die) improvement initiatives. Start Free Trial with OxMaint to capture downtime events automatically and disaggregate them by root cause so improvement efforts target the highest-impact losses.
Calculating Performance: Measuring How Fast Your Mill Actually Runs
Performance measures how close the actual rolling speed is to the design speed for the current product grade. The formula is straightforward: Performance = (Ideal Cycle Time × Total Count) / Run Time. For a rolling mill, Ideal Cycle Time is typically the nameplate speed at which the mill is designed to run for the current product (e.g., 2,000 metres per minute for hot strip, 1,500 for cold mill). Total Count is the number of pieces or the equivalent meters produced during the run time period. Where performance calculation becomes challenging is the definition of "design speed." A hot strip mill produces multiple grades—commodity grades at nameplate speed (2,000 m/min) and specialty grades at 1,200 m/min for tighter mechanical property control. If you calculate Performance against nameplate speed for specialty grades, you artificially depress the number and hide where real performance losses occur. Correct practice is to calculate Performance against the design rolling speed for the current product grade. For rolling mills, performance losses cluster in recognizable areas: AGC (automatic gauge control) lag time causing conservative speed reductions (0.5–1% loss), stand vibration forcing slower rolling to prevent chatter (0.5–2% loss), roll deflection requiring speed reduction to maintain flatness (1–2% loss), and minor stops under 5 minutes that aren't tracked but destroy performance (2–4% loss). These "invisible" losses—the micro-stops and minor slowdowns that don't appear in any alarm log—are typically responsible for 20–30% of total performance loss. A mill losing 3 minutes per hour to strip threading jams is losing 5% of performance from a cause that appears in no maintenance record and no operator report. Start Free Trial to automatically capture minor stop events from your PLC cycle data and reveal the hidden losses your manual tracking misses.
Calculating Quality: Measuring Good Steel from Total Steel Produced
Quality rate measures the percentage of steel produced that meets specification—good gauge, surface finish, mechanical properties, and dimensional accuracy. The formula is straightforward: Quality = Good Pieces / Total Pieces Produced. The challenge is defining what qualifies as "good" in complex rolling operations where some off-spec material can be internally graded to lower specifications, sold at reduced price, or reworked. In hot strip mills, quality losses typically come from: off-gauge strip (thickness outside tolerance), off-profile material (width or edge condition out of spec), surface defects (roll marks, scale, scratches), mechanical property failures (from incorrect finishing temperature or cooling), cobble scrap (steel destroyed during a cobble event), and crop losses (excessive head and tail trim from poor threading). The most contentious quality loss in rolling mill OEE is how to treat cobble scrap. A cobble is a looping or buckling failure that destroys steel being processed and usually requires 30–90 minutes to clear the mill. Standard OEE calculation methodology treats cobbles in two ways. First, the tonnage destroyed becomes a quality loss (material that was being processed but did not result in saleable product). Second, the downtime to clear the cobble becomes an availability loss (mill time consumed). Both count—cobbles represent the most severe combined availability and quality losses in rolling mill operations. Some mills exclude cobble tonnage from both numerator and denominator, treating cobbles as pure downtime events. This is incorrect and inflates quality rate artificially. Including cobbles in both numerator (scrap) and denominator (total produced) gives the true quality impact. For a mill producing 300 tonnes per shift with 2 cobble events destroying 15 tonnes total and requiring 60 minutes to clear, quality rate = (285 good tonnes / 300 total tonnes) = 95%, and those 60 minutes become availability losses. Book a Demo to see how OxMaint handles cobbles, downgrade material, and internally-graded steel correctly in your quality rate calculation.
Define Your Quality Standards and Off-Spec Categories
Document precisely what constitutes acceptable steel—gauge tolerance (+/- 0.2mm), surface requirements, mechanical properties, dimensional limits. Define your off-spec categories: off-gauge, off-profile, surface defects, mechanical property failures, cobble scrap, crop losses. For internally-graded material, establish which downgrade specifications are acceptable and which require scrap or rework. This definition becomes your quality standard against which all OEE calculations are made.
Establish Quality Data Collection at the Point of Production
Install inline inspection systems that measure gauge, profile, and surface in real time—not in the inspection lab after the strip has cooled. Point-of-production data reveals which conditions caused defects (finishing temperature, cooling rate, roll condition) while they're still correctable. Historical inspection data that arrives days later is too late for root cause correction.
Record Quality Losses by Type and Track Trend
Separate your quality losses into categories: gauge losses, surface losses, property losses, cobble scrap, crop losses. Track each category weekly and monthly. Which category is growing? Off-gauge growth may signal roll wear or AGC drift. Surface growth may signal descaler malfunction or water quality issues. Cobble growth may signal threading problems or hot metal quality deterioration. Categorized tracking identifies which improvements will yield the biggest quality gains.
Correlate Quality Losses with Equipment Condition and Operating Parameters
When off-gauge losses spike, correlate with finishing temperature, cooling rate, and roll wear data. When surface defects increase, correlate with descaler maintenance schedule and water quality. When mechanical property failures grow, correlate with finishing temperature control and cooling effectiveness. These correlations reveal whether quality losses are being driven by equipment condition, operator setpoint choices, or raw material quality.
Calculate Quality Rate and Set Improvement Targets by Loss Category
Calculate your current quality rate: (Good Tonnes / Total Tonnes Produced) × 100. Establish baseline by shift, by product grade, and by weekly trend. Set realistic improvement targets for each quality loss category. If off-gauge losses are currently 2.5% and root cause investigation points to AGC control loop performance, target 2.0% through AGC tuning and maintenance. OxMaint tracks your quality rate against targets and flags which categories are trending toward or away from your goals.
Frequently Asked Questions: OEE Calculation for Rolling Mills
What is considered world-class OEE for a rolling mill?
85% or higher is world-class. Most mills operate 45–65% OEE, leaving significant improvement opportunity. A mill at 60% is losing 40% of its production capacity daily—a gap representing tens of millions in annual production value.
Why do manual OEE calculations often underreport true losses?
Manual tracking captures stops >5 minutes but misses micro-stops and speed reductions. A mill losing 3 minutes/hour to jams appears to have 95% performance manually but is actually 95% OEE. Automated capture reveals the 5% hidden loss.
How should cobble scrap be treated in OEE calculation?
Include cobble tonnage as quality loss (scrap produced) and cobble downtime as availability loss (mill time consumed). Both count separately. Excluding cobble tonnage artificially inflates quality rate and hides the true impact of cobbles.
Can a rolling mill have OEE exceeding 100%?
No. If calculated OEE exceeds 100%, your ideal cycle time (design speed) is incorrect—you're running faster than what you defined as maximum. Recalibrate your design speed to actual nameplate specification.
What is the typical OEE improvement timeline for a rolling mill?
First-month improvements come from visibility (operators reduce uncontrolled losses immediately when they know they're being tracked). Months 2–6 bring maintenance-driven gains (PM improvements reduce breakdowns). Months 6–12 show process and setpoint optimization (speed, gauge, quality improvements). Year 2 brings sustained gains as the culture shifts to continuous improvement.
How do I set the "design speed" for multi-product rolling mills?
Use the design rolling speed for the current product grade, not the mill's theoretical maximum. A specialty grade designed to roll at 1,200 m/min should be evaluated against 1,200 m/min, not your mill's 2,000 m/min maximum. This prevents artificial performance depression for slower products.
How frequently should I calculate rolling mill OEE?
Daily is ideal for operator feedback and immediate loss response. Shift-level is minimum to catch performance drifts before they compound. Weekly and monthly trend reports support management review and resource allocation decisions. OxMaint calculates continuously so you can review data in the frequency that drives the best decisions.
Can OxMaint help me calculate OEE if I don't have a CMMS system?
Yes. OxMaint ingests data from your PLC, utility systems, quality lab, and production reports—even if you have no CMMS. Once your data is centralized, automated OEE calculation and loss categorization begin immediately, and you can use OEE insights to justify CMMS implementation.