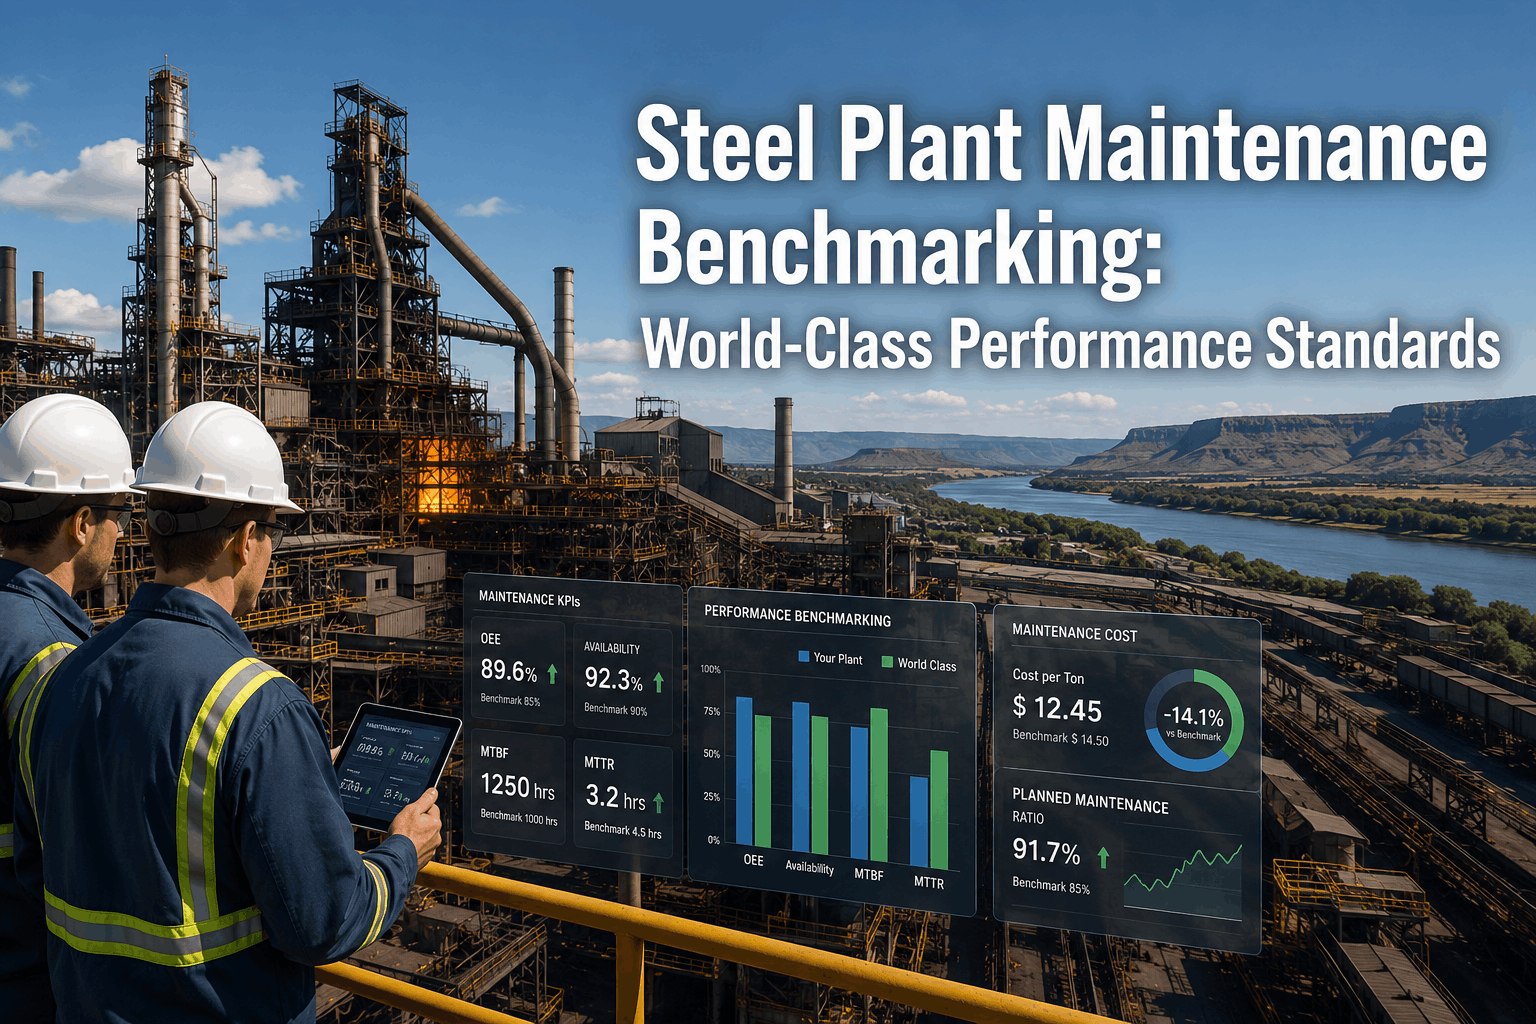
Most steel plants believe their maintenance operation is performing well — until they benchmark against world-class standards and discover they are 20–30% below industry leaders on every key metric. The gap between average and world-class maintenance in steel manufacturing translates to millions in avoidable downtime, excess repair costs, and shortened equipment life. A structured benchmarking program identifies exactly where those gaps exist and quantifies the financial impact of closing them. Plants that implement benchmarking-driven improvement programs achieve 18% higher reliability metrics and 28% lower emergency maintenance costs within 12–18 months. Sign up for Oxmaint to benchmark your maintenance KPIs against industry standards in real time.
Steel Plant Maintenance Benchmarking: World-Class Performance Standards and Gap Analysis
Reliability metrics, cost benchmarks, staffing ratios, technology maturity, and the methodology for identifying where your plant stands against best-in-class steel producers.
Maintenance Maturity: Where Does Your Plant Sit?
Steel plant maintenance maturity spans five levels. Most facilities operate at Level 2 or 3, relying heavily on reactive and calendar-based preventive programs. World-class plants operate at Level 4–5, using predictive analytics and reliability-centered maintenance to eliminate unplanned failures.
Key Benchmarks: Average vs World-Class Steel Plants
These benchmarks are drawn from industry data across global steel producers. The gap between average and world-class represents the specific improvement opportunity at each plant. Book a demo to see how Oxmaint calculates your position against each benchmark automatically.
Overall Equipment Effectiveness
PM Completion Rate
Emergency Work Order Ratio
Maintenance Cost / RAV
Wrench Time
Planned vs Unplanned Ratio
See Where You Stand Instantly
Oxmaint calculates OEE, MTBF, MTTR, PM compliance, and cost benchmarks automatically from your work order data — no manual spreadsheets.
Comprehensive Benchmark Reference Table
| KPI | Poor | Average | World-Class | Measurement |
|---|---|---|---|---|
| OEE | Under 50% | 60–75% | 85%+ | Daily per line |
| PM Completion | Under 60% | 70–80% | 95%+ | Weekly |
| MTBF (Critical) | Under 200 hrs | 300–600 hrs | 1,000+ hrs | Monthly per asset class |
| MTTR | 8+ hrs | 4–6 hrs | 2–3 hrs | Daily |
| Emergency WO Ratio | 50%+ | 30–40% | Under 10% | Weekly |
| Maint Cost / RAV | 6%+ | 4–5% | 2–3% | Monthly |
| Wrench Time | Under 25% | 30–40% | 55–65% | Weekly |
| Schedule Compliance | Under 70% | 75–85% | 90%+ | Weekly |
| Availability | Under 85% | 88–92% | 95%+ | Daily |
Gap Analysis Methodology: Five Steps to Benchmarking
Baseline Measurement
Capture current-state KPIs from CMMS data for a minimum of 90 days. Verify data quality — organizations relying on manual entry typically underestimate MTTR by 15–30%. Sign up for Oxmaint to automate baseline data capture from day one.
Asset Criticality Ranking
Rank equipment by impact on safety, production throughput, and repair cost. Focus benchmarking on the 20% of assets that drive 80% of downtime impact — typically blast furnace auxiliaries, rolling mill drives, and continuous caster components.
Gap Quantification
Compare each KPI against the world-class benchmark and calculate the financial value of closing the gap. A 10-point OEE improvement on a rolling mill producing 500,000 tonnes annually translates to measurable revenue recovery.
Root Cause Prioritization
Identify the 3–5 root causes responsible for the largest gaps. Common steel plant gap drivers: insufficient PM compliance on critical assets, excessive emergency work displacing planned tasks, and poor failure code data preventing pattern analysis.
Improvement Tracking
Set 6-month and 12-month targets for each KPI based on realistic improvement trajectories. Track progress through automated CMMS dashboards — not quarterly manual reviews. Book a demo to see benchmark tracking dashboards configured for steel plants.
Oxmaint Benchmarking and Analytics Capabilities
Real-Time KPI Dashboard
OEE, MTBF, MTTR, PM compliance, and cost metrics updated live from work order data — no manual calculation or spreadsheet compilation.
Industry Benchmark Overlays
World-class target lines overlaid on every metric chart so your team sees the gap — and the trend toward closing it — at every review.
Failure Pattern Analysis
Bad actor reports, failure mode Paretos, and repeat failure analysis identify the root causes driving your largest benchmark gaps. Start your free trial.
Close the Gap to World-Class Maintenance
Every percentage point of OEE you recover is revenue your plant is currently leaving on the table.
Frequently Asked Questions
Start Benchmarking Your Steel Plant Today
You cannot improve what you cannot measure. Get your baseline KPIs calculated automatically and see exactly where the gaps are.