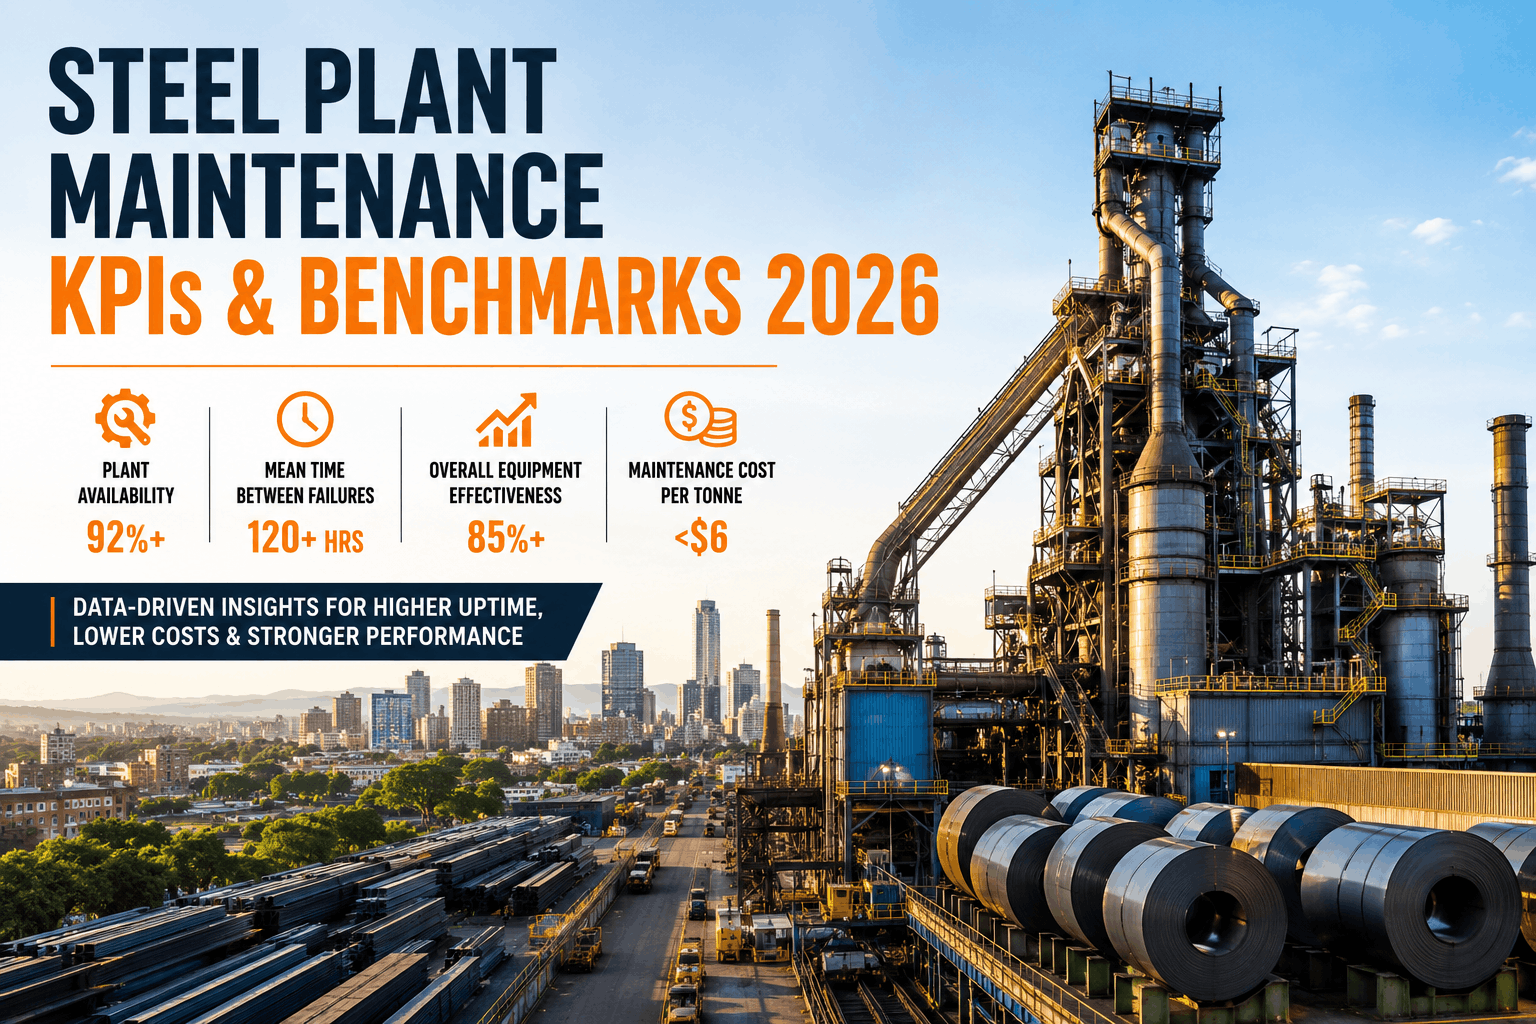
Steel plant maintenance KPIs in 2026 have shifted from lagging indicators (total maintenance cost, total work orders completed) toward leading indicators that predict production loss before it occurs. The three most critical KPIs for plant managers are MTBF (Mean Time Between Failures), MTTR (Mean Time to Repair), and OEE (Overall Equipment Effectiveness). World-class integrated mills maintain MTBF targets of 8,000–15,000 hours on blast furnace cooling systems, achieve PM compliance rates of 85%+ on critical assets, and operate OEE between 80–87%. Most U.S. integrated mills sit at 60–75% OEE, meaning 10–25% of theoretical production capacity is consumed by downtime, speed restrictions, and quality rejections. At a 2 MTPA facility, each OEE point represents approximately $10 million in annual revenue at risk. Sign Up Free to track steel plant maintenance KPIs automatically from your work order and sensor data — without spreadsheets, manual calculations, or monthly reporting lag.
The Five KPIs That Separate World-Class From Reactive Steel Operations
Most steel plants track too many metrics and act on none of them. A 25-metric monthly report that arrives three weeks after month-end is not a decision support tool — it is a compliance document. The best steel plant operations in North America track five focused metrics, updated in real time, and connected to specific corrective actions. These five metrics are calculated automatically from work order data or sensor feeds, visible to both plant leadership and frontline maintenance teams, and used to drive prioritization decisions daily. Book a Demo to see how OxMaint organizes KPI dashboards by operational role — what plant managers see is different from what maintenance planners see, which is different from what shift supervisors track.
Steel Plant KPI Hierarchy by Decision Level
KPIs are not one-size-fits-all — they differ by who needs to see them and what decisions they are making. Plant general managers and finance need strategic metrics that show competitive position and capital efficiency. Maintenance managers need operational metrics that show equipment reliability trend and execution capability. Shift supervisors need real-time metrics that show what to prioritize in the next work window. A single CMMS architecture must serve all three audiences simultaneously, updating in real time as technicians close work orders. Sign Up Free to implement role-specific KPI dashboards across your entire organization using OxMaint's pre-built steel plant templates.
Plant Leadership Metrics (Monthly / Quarterly Review)
OEE by production line (Availability × Performance × Quality), total maintenance cost per tonne of steel produced, maintenance spend as percentage of Replacement Asset Value (target 2–3%), planned vs. unplanned downtime ratio (target 85:15 or better), safety incident rate, and deferred capital renewal backlog as percentage of asset replacement value. These metrics sit on the board pack and determine whether the maintenance team gets resources for technology investment or capital equipment renewal.
Maintenance Manager Metrics (Weekly Review)
MTBF trend by production area (blast furnace, steelmaking, caster, rolling mill) — identifying assets degrading and failure risk rising. MTTR by equipment class — showing whether repairs are getting faster (skills improving) or slower (complexity rising). PM schedule compliance — percentage of scheduled maintenance completed on time vs. total scheduled (target 85%+). Work order backlog total, age distribution, and trend direction. Emergency work order ratio as percentage of total (target <10%). Labor efficiency by crew and shift.
Shift Supervisor Metrics (Shift-Level Real-Time)
Overdue work orders by age and criticality — what needs attention now. Current crew loading vs. available labor capacity — am I over-committed this shift? Equipment availability dashboard — which production lines are at risk. Imminent PM due dates — what gets scheduled into the next maintenance window. Spare parts on-hand — do I have the consumables (refractory bricks, bearing sets, seals) needed to execute tomorrow's scheduled work, or are we vulnerable to expedite delays.
Specific MTBF and MTTR Benchmarks by Equipment Class
Steel plant equipment operates in extreme conditions — from 2,000°C internal temperatures in blast furnaces to 100+ km/h mechanical stress in rolling mills. MTBF targets must be set based on equipment type and operating environment, not arbitrary universal standards. A blast furnace cooling pump with 8,000-hour MTBF is fundamentally different from a rolling mill bearing with the same MTBF number — they operate in different stress regimes and have different consequence levels if they fail. This table shows industry benchmarks from the World Steel Association for well-maintained equipment across integrated mill zones. Use these as diagnostic reference points when evaluating whether your current asset reliability is tracking above or below world-class standards.
| Equipment Type | Production Zone | MTBF Target (Hours) | MTTR Target (Hours) | Availability Target |
|---|---|---|---|---|
| Cooling pumps, stoves, gas cleaning | Blast Furnace (Critical) | 8,000–15,000 | 2–6 | 99.5%+ |
| BOF tilting, lance systems, ladle turret | Steelmaking (High) | 5,000–10,000 | 1–4 | 97–99% |
| Mold oscillation, segment drives, spray cooling | Continuous Caster (High) | 3,000–6,000 | 1–3 | 96–98% |
| Roughing/finishing stands, coilers, AGC hydraulics | Rolling Mill (Medium–High) | 1,500–4,000 | 1–4 | 92–96% |
| Compressors, utility pumps, transformers, conveyors | Utilities (Standard) | 8,000–20,000 | 2–8 | 94%+ |
How to Diagnose KPI Problems: Root Cause vs. Data Quality Issues
A blast furnace cooling pump with declining MTBF (from 10,000 hours to 6,000 hours over two quarters) looks like a critical reliability crisis. But before launching an emergency replacement program, verify the diagnosis: Is the MTBF actually declining because the equipment is degrading, or is it declining because failures are being logged twice (once under the pump asset, once under the cooling circuit), inflating the failure count? Most steel plants operating above 30% "unknown" failure codes on work order closure are logging data inaccurately, producing KPI metrics that point to false equipment problems. Sign Up Free to implement mandatory work order fields that eliminate this KPI blind spot — OxMaint enforces failure code, root cause, and action taken closure fields, preventing the ambiguous "repaired" and "unknown" status that corrupts your MTBF trending.
Frequently Asked Questions: Steel Plant KPIs and Benchmarking
What OEE score should a U.S. integrated steel plant target in 2026?
World-class OEE is 85%+ for high-speed, single-product lines. Integrated mills typically operate between 60–75% OEE because the consequence of unplanned failure is severe, making conservative planned maintenance strategies rational risk management. The gap between typical and world-class OEE is primarily condition-based maintenance maturity — moving from calendar-based PM intervals to sensor-triggered triggers that detect degradation weeks before catastrophic failure.
How does OxMaint calculate OEE for a blast furnace — a continuous process asset?
Blast furnace OEE is calculated on a campaign-normalized basis — planned production time is design campaign duration minus scheduled tap hole maintenance windows. Availability losses include unplanned stockline delays, tap hole equipment failures, and burden handling stoppages. Performance is actual hot metal production rate vs. design rate for current burden mix. Quality is prime hot metal yield. OxMaint pre-configures this calculation at deployment without custom engineering.
Is it possible to have 85% OEE while operating at only 50% TEEP (Total Effective Equipment Performance)?
Yes — and this is the most dangerous KPI blind spot in steel manufacturing. A mill running 85% OEE during scheduled 80 hours per week but only scheduling 80 hours against 168 calendar hours operates at 41% TEEP. The 85% OEE gives management false confidence while 59% of total capacity sits unused. TEEP reveals whether idle time is genuinely unavoidable (furnace relines) or represents recoverable scheduling opportunity worth millions in additional revenue.
What is the planned-to-unplanned maintenance ratio, and why does it matter?
The ratio compares scheduled preventive maintenance hours against unplanned reactive repair hours (target 70:30 or better, meaning 70% of maintenance is planned, 30% reactive). It captures program maturity, production-maintenance integration quality, and cost efficiency in a single number. Plants improving from 45% planned to 70% planned over 18–24 months document measurable improvements in throughput, energy efficiency, and product quality consistency alongside direct maintenance cost reduction.
How frequently should steel plants review maintenance KPIs?
High-volume production zones (casters, rolling mills) benefit from daily backlog reviews at shift level. Plant-wide KPI assessments should occur weekly — OEE, MTBF trend, unplanned downtime hours, and cost per ton produced. Strategic monthly or quarterly reporting rolls up weekly data for leadership visibility. OxMaint automates all review cadences, eliminating manual aggregation and reporting delays that defeat timely decision-making.