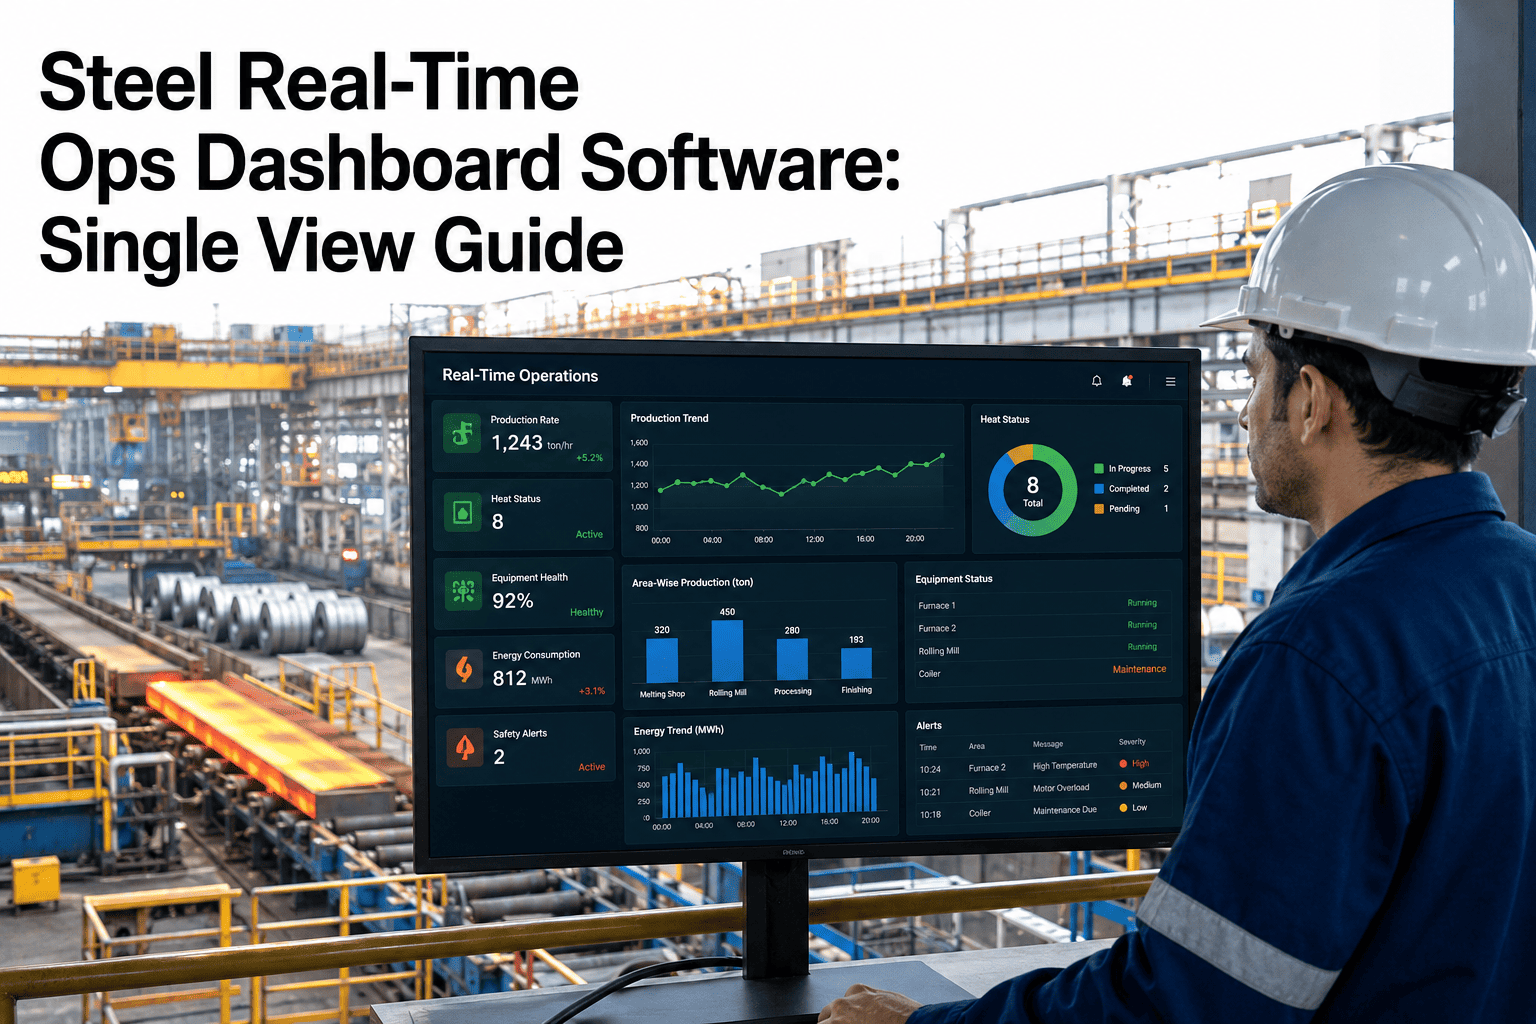
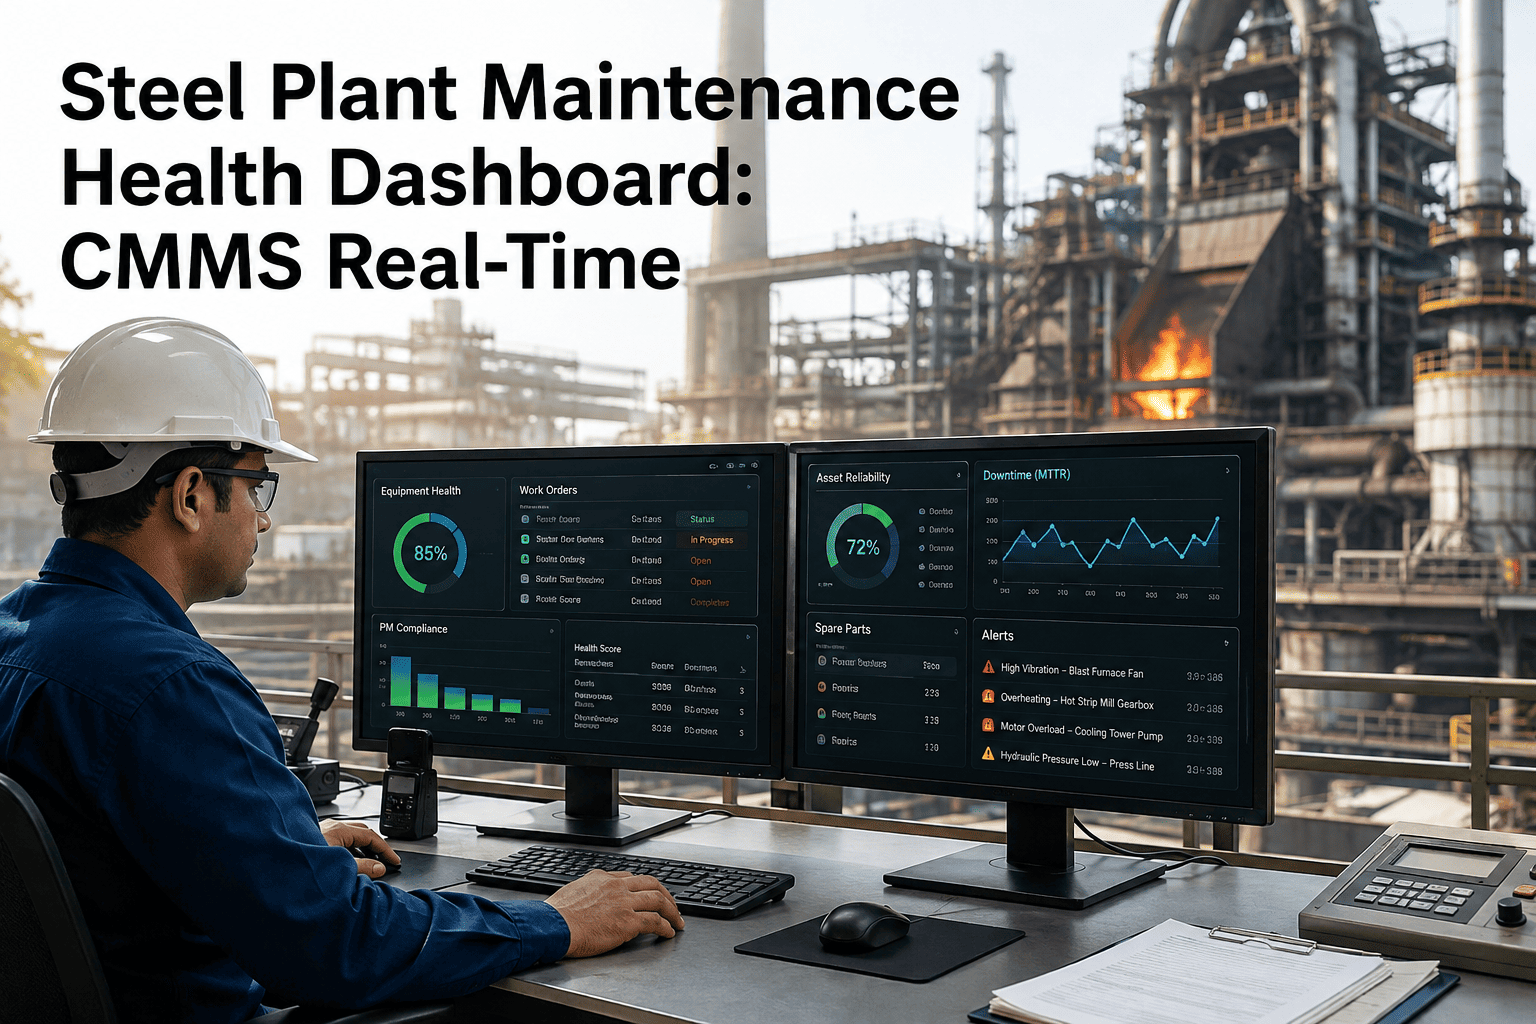
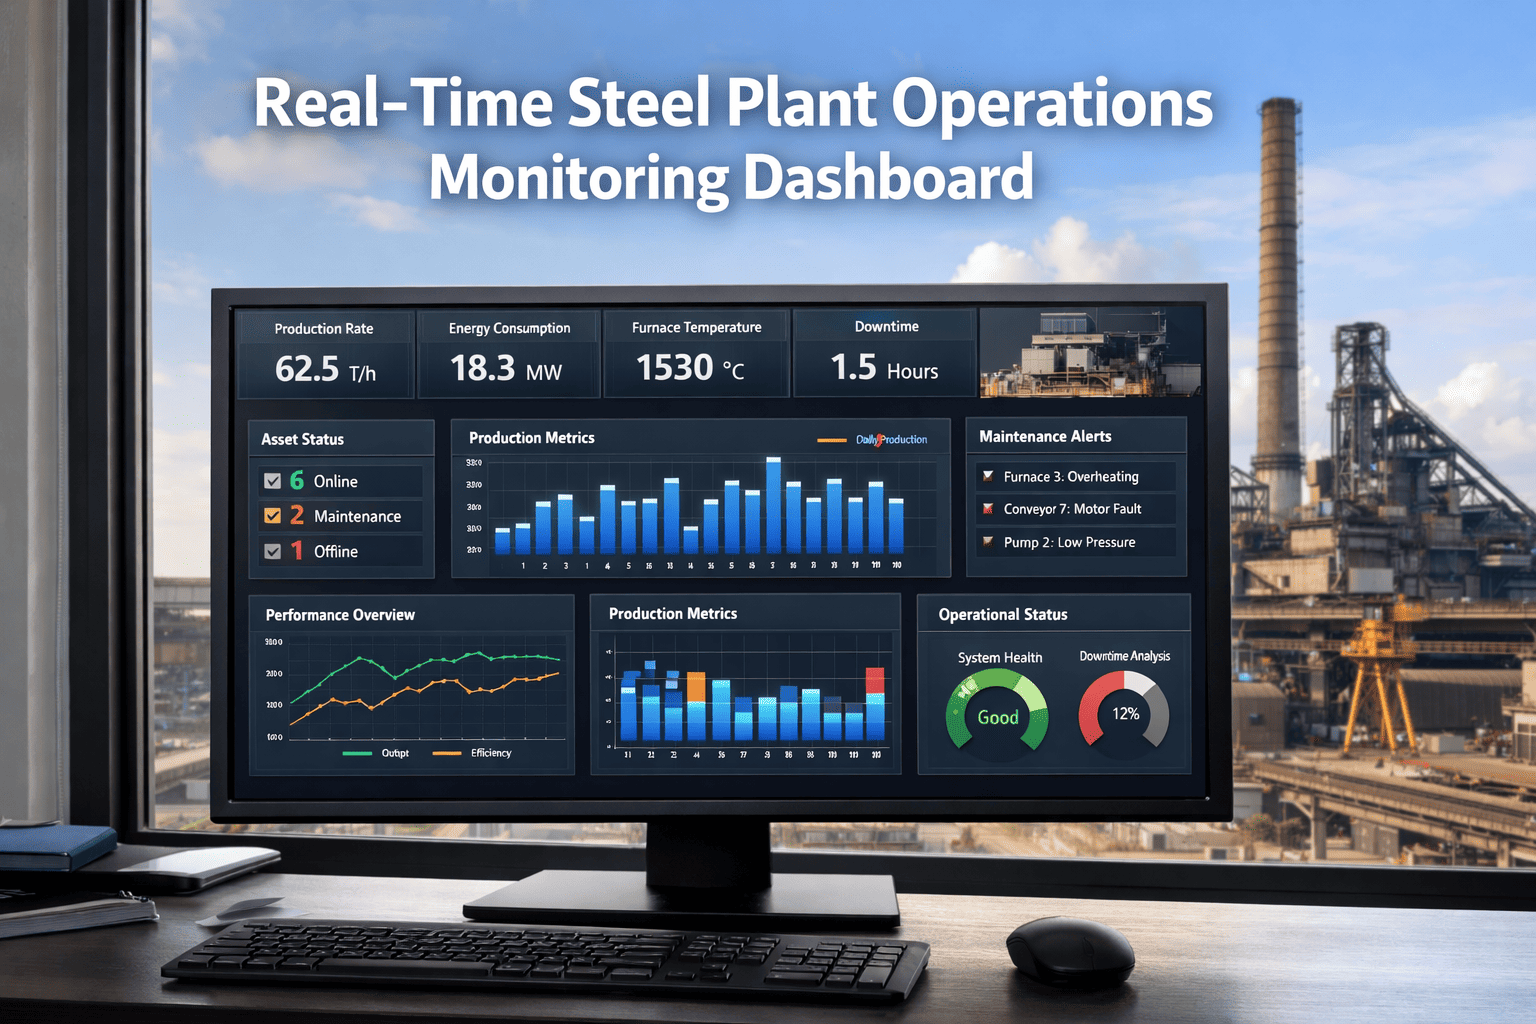
Every steel plant generates thousands of data points every minute — asset temperatures, vibration readings, open work orders, energy draws, safety tasks, and downtime events — but most reliability teams are still making decisions from last week's spreadsheet. OxMaint's Real-Time Maintenance Dashboard pulls every critical signal into a single live view: asset health scores, downtime risk flags, work order status, energy anomalies, and safety task completion — updated continuously so your team acts on what is happening now, not what happened yesterday.
Case Study · Analytics & Reporting · P1 Critical
Real-Time Steel Plant Maintenance Dashboard
One screen. Every asset. Zero blind spots.
Book a Live Demo
Sign Up Free
94.2%
Plant OEE
3
Critical Alerts
47
Open WOs
98.1%
PM Compliance
The Problem With Reactive Dashboards
01
Siloed Data, Delayed Decisions
Steel plants using separate systems for SCADA, CMMS, ERP, and energy monitoring lose 4–6 hours per shift to manual data reconciliation — by which time a developing failure has already progressed.
02
No Downtime Risk Visibility
Traditional dashboards show current status — not trajectory. A rolling mill motor running at 78% health with rising vibration needs a different response than one running at 78% on a stable trend. Static snapshots cannot show that difference.
03
Reporting That Arrives Too Late
Monthly maintenance reports tell you what failed last month. OxMaint's live analytics surface which assets are heading toward failure this week — giving planners the lead time to act before production is impacted.
Live Asset Feed — Integrated Steel Plant
Rolling Mill Motor M-07
Bearing vibration 4.8× baseline · Failure risk 87%
CRITICAL
2 min ago
Blast Furnace Blower BFB-02
Motor current +19% above rated · Work order auto-generated
WARNING
9 min ago
Sinter Plant Conveyor SC-06
Belt drift 58mm left · Roller R-31 temp 106°C
WATCHLIST
14 min ago
Hot Strip Mill Gearbox HSG-04
AI inspection passed · Health score 91% · Stable trend
HEALTHY
21 min ago
Arc Furnace EAF-01 — Energy
Power factor 0.71 · 14% above baseline · Anomaly flagged
ENERGY
33 min ago
What the Dashboard Tracks — At a Glance
Asset Health Scores
Every rotating asset — conveyors, motors, gearboxes, blowers, pumps — displays a live 0–100 health score updated from vibration, temperature, and runtime data.
Work Order Status
Open, overdue, in-progress, and completed work orders in real time. Filter by area, priority, or technician. Backlog aging and SLA breach alerts built in.
Downtime Risk Flags
AI calculates failure probability for each critical asset over the next 7, 14, and 30 days — so planners can prioritize interventions before downtime occurs.
Safety Task Compliance
Lockout/tagout, hot work permits, confined space entries, and inspection sign-offs tracked live. Compliance rate displayed per zone and per shift.
Energy Anomaly Detection
Unusual power consumption spikes on furnaces, drives, and compressors flagged automatically against a 90-day rolling energy baseline per asset.
Reliability KPI Reports
MTBF, MTTR, OEE, PM compliance, and maintenance cost per asset — auto-generated monthly and delivered to stakeholders without manual effort.
See Your Steel Plant's Live Dashboard
OxMaint connects to your existing SCADA, BAS, and CMMS in 2–4 weeks — no rip-and-replace required.
Before vs. After — Dashboard Impact on Steel Operations
Mean Time to Detect Fault
Unplanned Downtime / Month
PM Compliance Rate
Monthly Reporting Time (hrs)
Measured Results
| KPI | Before OxMaint | After OxMaint | Change |
|---|---|---|---|
| Unplanned downtime / month | 78 hours | 22 hours | 72% reduction |
| Mean fault detection time | 6.4 hours | 24 minutes | 94% faster |
| PM compliance rate | 58% | 97% | +39 points |
| Monthly reporting effort | 32 hrs manual | 2 hrs auto | 94% time saved |
| Critical asset health visibility | 30% coverage | 100% coverage | Full coverage |
| Energy anomaly detection | Manual, monthly | Real-time, automated | Continuous |
Expert Review
AK
Amit Kulkarni
Plant Reliability Director · Integrated Steel · 24 yrs
"We had 14 different systems generating data across our plant — SCADA, SAP PM, a separate energy meter system, manual inspection logs, and shift reports in spreadsheets. Our reliability team spent more time compiling data than acting on it. OxMaint unified everything into a single live dashboard within four weeks of deployment. The first month, we caught a blast furnace blower bearing fault 11 days before it would have failed — that single intervention saved us an estimated $290,000 in lost production. The real value isn't just the alerts — it's that the entire maintenance team now operates from the same real-time picture."
Frequently Asked Questions
How quickly can OxMaint connect to an existing steel plant's SCADA and CMMS?
OxMaint supports OPC-UA, MQTT, BACnet, Modbus, and REST API integrations — covering the data protocols used by all major SCADA and DCS platforms in steel plants including Siemens, ABB, Honeywell, and GE iFIX. SAP PM, Oracle EAM, and most standalone CMMS platforms connect via pre-built connectors. Most steel plant integrations achieving full live dashboard coverage are completed in 2–4 weeks. The OxMaint implementation team handles mapping, commissioning, and baseline calibration — your team does not need dedicated IT resources. See integration documentation at app.oxmaint.ai.
Can the dashboard track safety permit compliance alongside maintenance KPIs?
Yes. OxMaint's dashboard includes a dedicated safety compliance module that tracks lockout/tagout issuance and closeout, hot work permits, confined space entry authorizations, and routine inspection sign-off rates — all displayed by zone, shift, and contractor. Safety task completion rates are shown alongside maintenance KPIs on the same screen, giving plant managers a unified view of operational risk. Non-compliance triggers an automatic escalation alert to the responsible supervisor before the shift ends. Book a demo to see the safety module live.
How does OxMaint calculate the downtime risk score shown in the dashboard?
Each asset's downtime risk score is calculated by OxMaint's AI model using a combination of current sensor readings (vibration, temperature, current draw), deviation from the asset's individual 90-day rolling baseline, historical failure pattern matching, and remaining useful life (RUL) estimates from predictive models trained on steel plant equipment data. The score is expressed as a failure probability percentage over 7, 14, and 30-day windows — giving planners a forward-looking risk view rather than a current-state snapshot. Assets crossing a configurable risk threshold automatically generate a planning alert and a draft work order.
Can the dashboard generate compliance and reliability reports automatically for senior management?
OxMaint's Analytics & Reporting module auto-generates scheduled reports covering MTBF, MTTR, OEE, PM compliance rate, maintenance cost per asset, and corrective-to-preventive maintenance ratio. Reports are delivered via email on configurable schedules — daily for operations managers, weekly for plant engineers, monthly for directors — in PDF or Excel format. Custom report templates can be configured per stakeholder. The 32-hour monthly manual reporting effort that most steel plants carry is typically eliminated within the first reporting cycle after OxMaint deployment. Start free at app.oxmaint.ai.
Your Plant Is Generating Data. Start Acting on It.
OxMaint turns your existing sensor and CMMS data into a live dashboard that catches failures before they stop production.