Every steel plant already has the data — it lives in Level 1 PLCs, Level 2 process control, LIMS quality databases, and SCADA historians. The problem is not collection. It is connection. Monthly reports average across 180 unplanned stoppages under five minutes each — stoppages that never appear in the shift log because nobody manually records them, but which collectively erase 11 hours of production per month and 3 to 5 OEE points that management cannot explain. At a 2 MTPA steel plant, every single OEE point represents approximately £10 million in annual revenue. Oxmaint's Real-Time Monitoring Dashboard connects your existing automation, quality, and maintenance data layers into one trusted view — every role, every shift, every asset, updated every 30 to 60 seconds. Book a demo to see how Oxmaint consolidates your plant's data into a live operations dashboard.
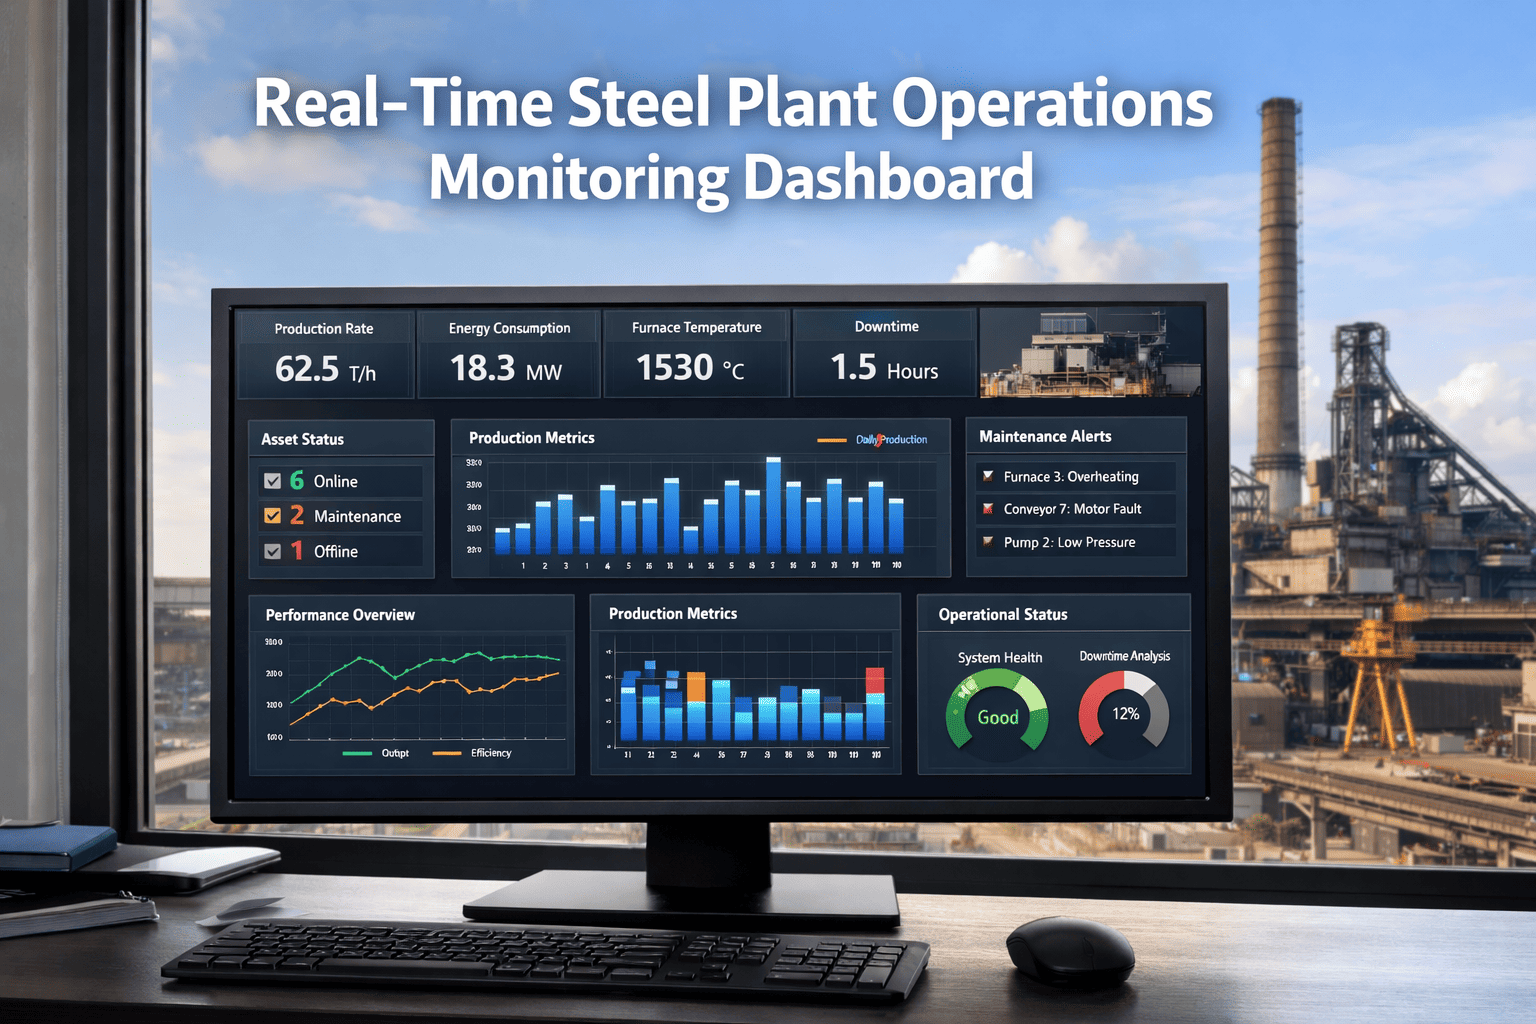
Real-Time Steel Plant Operations Monitoring Dashboard
One trusted source of truth for OEE, asset health, maintenance workload, and production KPIs — across every line, every shift, every furnace. Updated every 30-60 seconds from your existing data infrastructure.
Why Monthly Reports Can't Run a Steel Plant
The problem is not that steel plants lack data — it is that the data arrives too late to act on. By the time a monthly OEE report lands in a manager's inbox, the losses happened three weeks ago, the root causes are buried, and the shift that caused them has rotated twice. Real-time monitoring closes the gap between an event occurring and someone having the information to respond to it.
180 stoppages under 5 minutes each — per month, per line — are never recorded in shift logs because they feel too brief to document. They collectively erase 11 hours of production and 3-5 OEE points that no report can explain after the fact.
A caster running at 92% of rated speed shows "available" in every report. Over two weeks of mold copper wear, that 8% speed loss costs $40K per day in reduced throughput — visible only in real-time performance trending against rated speed, not in availability status.
Maintenance says 75% availability. Quality reports 91% yield. Operations claims 80% performance. Each team measures from a different source, at a different time, with different downtime definitions. Monthly reviews become disputes rather than decisions.
Shift A runs at 71% OEE. Shift C runs at 51%. The monthly average shows 62% and nobody investigates. The 20-point gap is almost entirely operational practice and changeover discipline — correctable if visible in real time, entrenched if seen only in aggregated reports.
Dashboard Architecture — The Right Data for Every Role
One dashboard does not serve all roles. The plant manager needs a 30-second status check. The maintenance planner needs asset-level downtime history. The shift supervisor needs live line status and pending work orders. Oxmaint structures four distinct views from the same underlying data — each role sees its depth, none sees the other's noise.
- Overall OEE vs target — live and trend
- Total tonnes produced vs plan, shift and month-to-date
- Active critical alerts across all assets
- Energy cost per tonne — current vs baseline
- Maintenance cost and PM compliance rate
- OEE by line and by shift — side-by-side comparison
- Downtime cause categories and top-5 contributors
- Micro-stoppage frequency by asset and crew
- Production rate vs rated speed per line
- Shift handover summary with open issues
- MTBF and MTTR per asset family — trending
- Open, overdue, and scheduled work orders by priority
- PM compliance rate — planned vs actual
- Asset condition scores and critical alerts
- Maintenance cost vs budget — asset and period
- Machine status — running, idle, or faulted
- Active alarms and pending safety checks
- Current production speed vs target rate
- Assigned work orders due this shift
- Quality alerts from inline inspection
Stop waiting for Monday's report to find out what Friday's shift lost — see it live.
KPI Coverage — What the Dashboard Tracks
The table below covers the core KPI set for a steel plant monitoring dashboard — with the calculation formula, real-time alert threshold, and primary role that acts on each signal. Steel-specific additions beyond standard OEE include caster speed, reheating specific energy, and ladle cycle time.
| KPI | Calculation | Alert Trigger | Primary Role |
|---|---|---|---|
| OEE (Overall Equipment Effectiveness) | Availability × Performance × Quality | Drop below shift baseline by more than 5 points | Operations Manager, Plant Manager |
| Availability | (Scheduled time − Downtime) ÷ Scheduled time | Unplanned stop event — immediate alert | Shift Supervisor, Maintenance |
| Performance Rate | Actual output rate ÷ Maximum rated rate | Drop below 92% of rated speed for more than 10 minutes | Shift Operator, Operations Manager |
| Quality Yield | Good units ÷ Total units produced | Yield drops below grade-specific threshold | Quality Team, Operations Manager |
| MTBF (Mean Time Between Failures) | Operating hours ÷ Number of failure events | MTBF trending down more than 15% month over month | Maintenance Planner |
| MTTR (Mean Time to Repair) | Total repair time ÷ Number of repair events | MTTR exceeds SLA threshold for critical assets | Maintenance Planner, Shift Supervisor |
| Reheating Specific Energy (SEC) | Fuel consumed (GJ) ÷ Tonnes reheated | SEC drifts above 1.6 GJ/t or 15% over baseline | Energy Manager, Operations Manager |
| PM Compliance Rate | Completed PMs ÷ Scheduled PMs in period | Below 90% for critical asset class | Maintenance Planner |
Data Source Connections
Oxmaint connects to the data your steel plant already generates — no new sensors, no duplicate data entry, no parallel systems. The integration map below shows which existing systems feed each dashboard layer, and how the platform normalises data from all four into a single calculation methodology that every department trusts.
Expert Review
We had three systems producing three different OEE numbers. Maintenance said 75%, production said 82%, quality said 91%. Nobody trusted anyone's report. Once Oxmaint became the single source, the arguments stopped and the improvement work started.
Plant Manager, Integrated Flat Steel ProducerThe micro-stoppage data changed how we think about the caster. We thought downtime was scheduled changeovers. Real-time data showed 200 stoppages under three minutes every month. That is where the tonnage was going, and nobody had ever counted it.
Operations Manager, Continuous Casting DivisionThe shift comparison view fixed our biggest problem in six months. Shift C was running 19 points below Shift A on the same equipment. Seeing it live every day forced the conversation that three years of monthly reports never did.
Production Director, Long Products Rolling MillKPI Benchmarks
| Metric | Industry Average | World-Class Target | Review Cadence |
|---|---|---|---|
| Overall OEE | 60-75% for metals manufacturing | 85%+ with continuous improvement programme | Real-time — shift and daily trending |
| Availability | 80-90% typical — unplanned stops vary | Above 95% with structured PM programme | Per-event and shift summary |
| PM Compliance Rate | 65-75% at plants without digital PM tools | Above 90% for critical asset class | Weekly — escalate below 85% |
| MTTR (Critical Assets) | 4-8 hours typical for major equipment | Under 2 hours with mobile work order dispatch | Per-event — monthly trending |
| Micro-Stoppage Count | 150-300 per month per high-speed line | Under 50 per month with root cause elimination | Daily — pattern analysis weekly |
Frequently Asked Questions
Your Plant's Best Shift Performance Is Already Achievable — Every Shift.
Oxmaint connects your existing PLC, historian, LIMS, and maintenance data into one real-time dashboard that operations, maintenance, and management all trust — and use to close the gap between average and world-class.


-for-steel-plant.png)