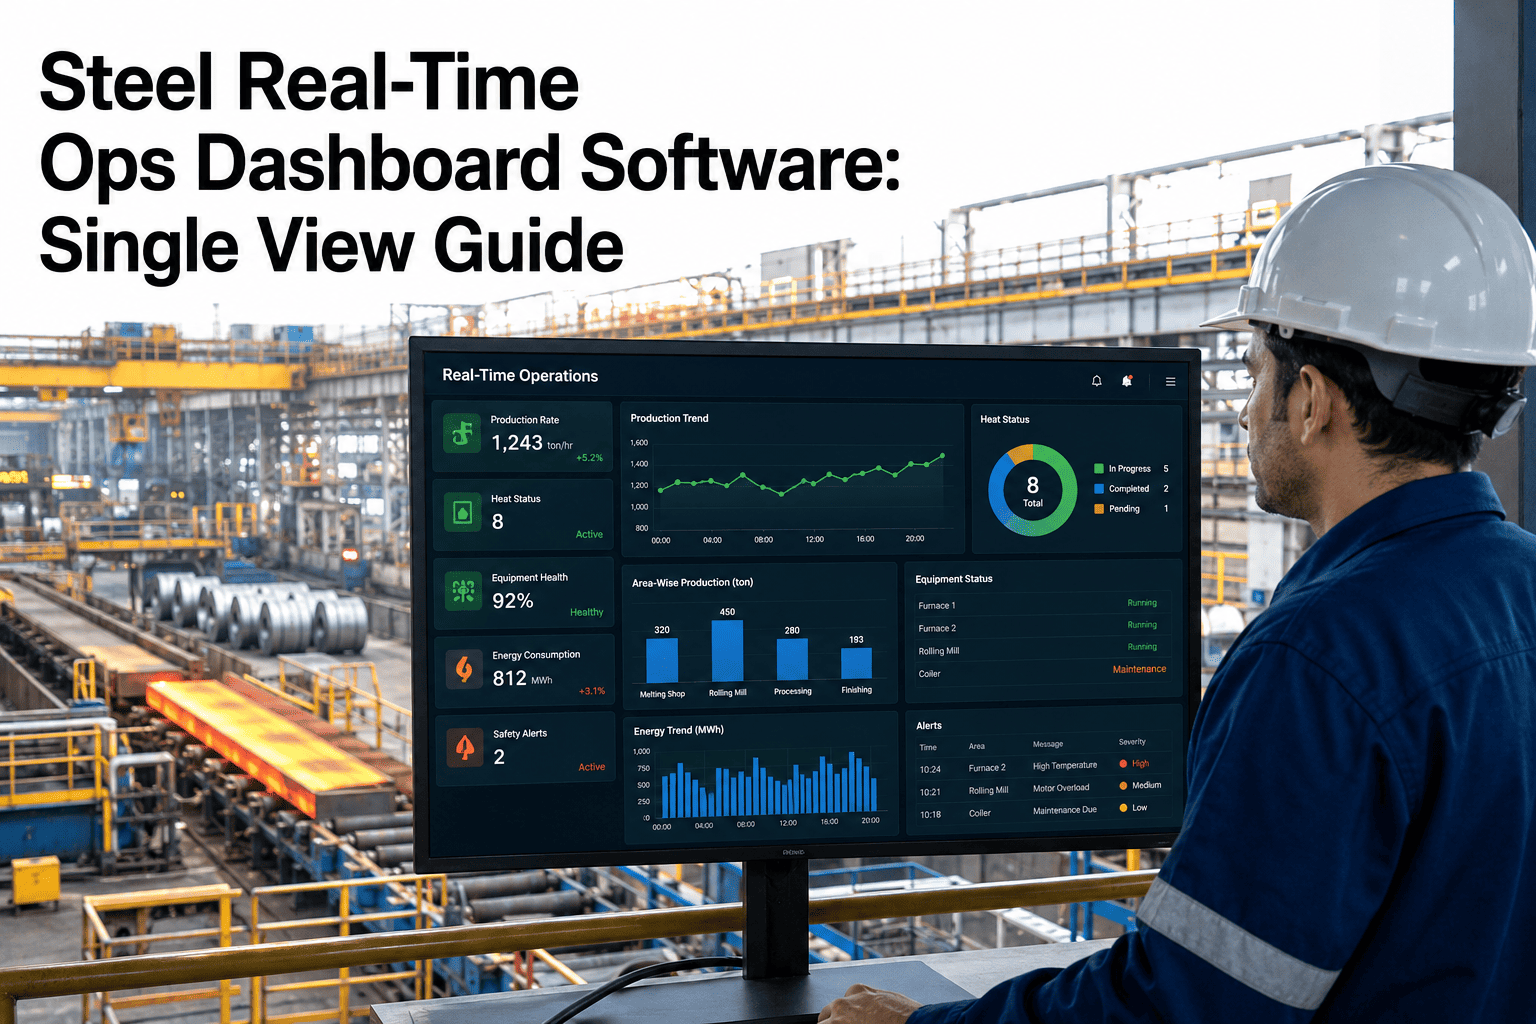
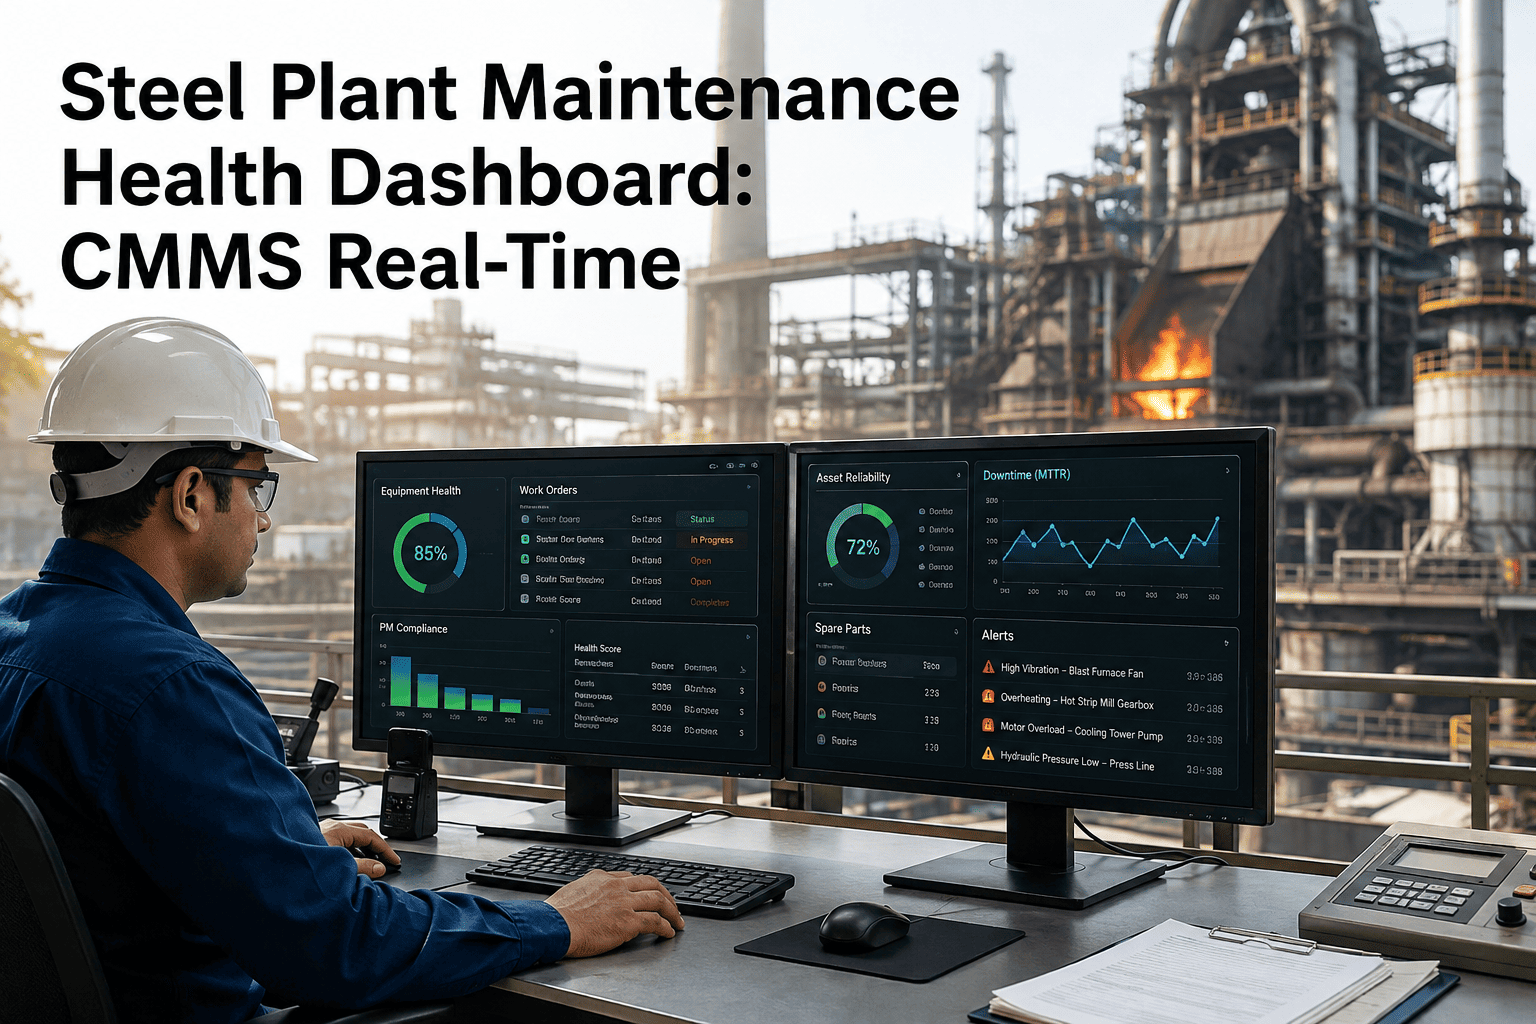
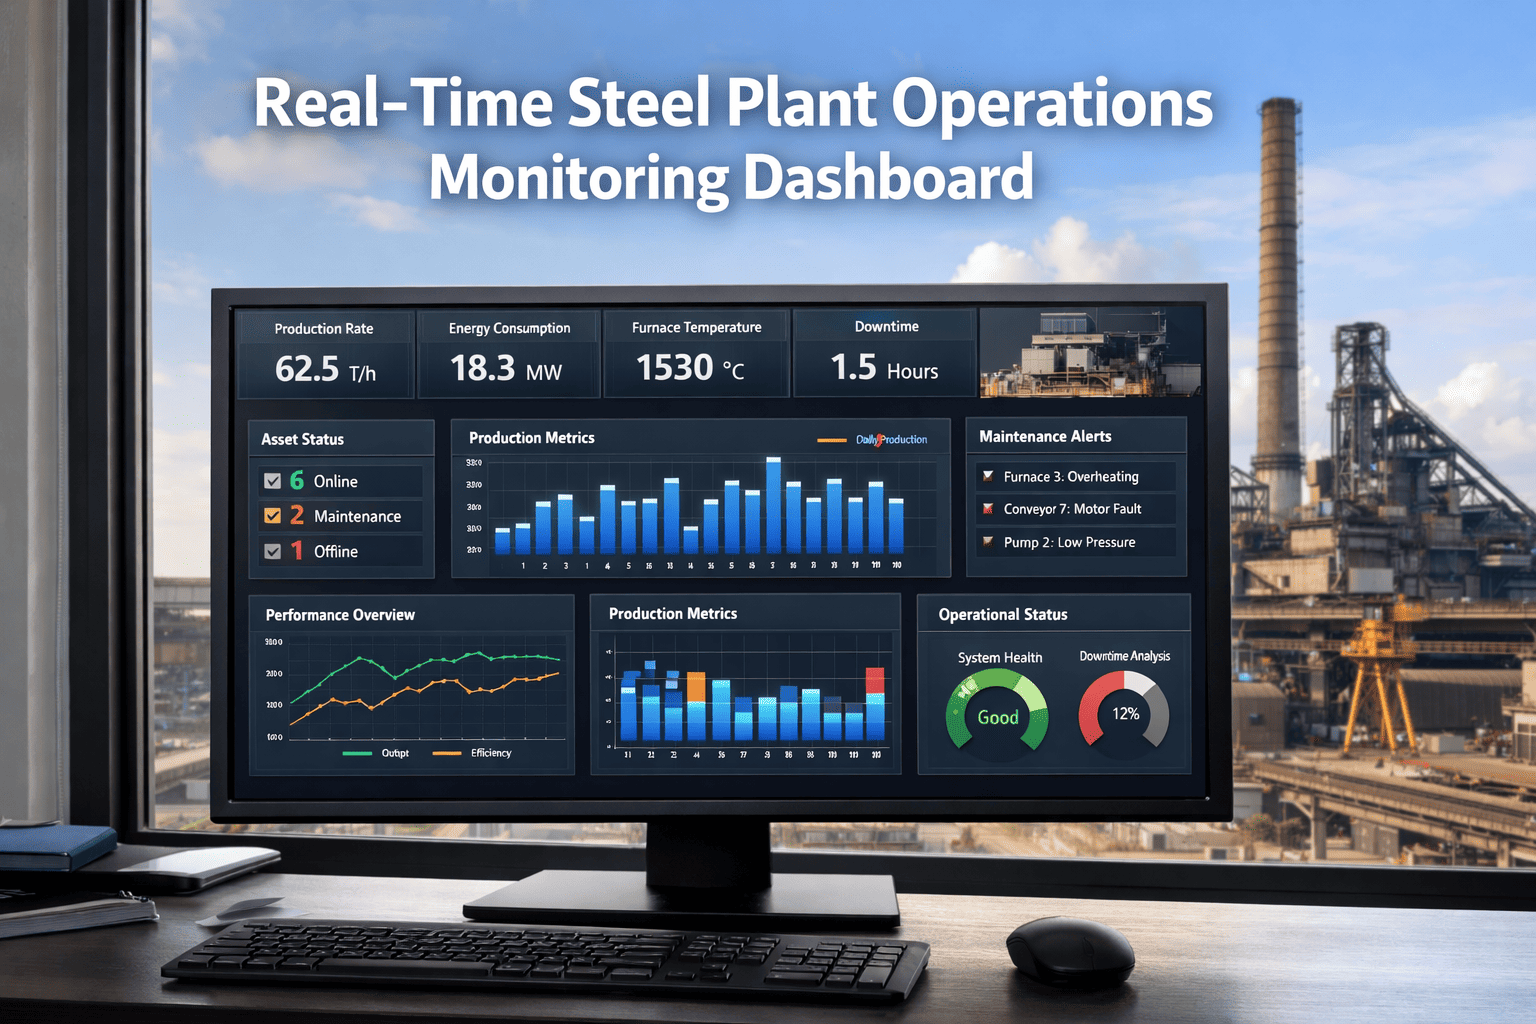
Your ERP says the hot strip mill ran at 83% availability last month. Your maintenance team says it was closer to 75%. Your quality team reports 91% yield. Finance sees a different number. The problem isn't that people are wrong — it's that everyone measures OEE differently, at different times, from different data sources, with different definitions of "downtime" and "good product." By the time monthly reports reach management, the losses happened weeks ago and the root causes are buried. Real-time OEE monitoring eliminates this lag by capturing availability, performance, and quality data automatically from every process area — every minute, every shift — and presenting it in a single source of truth that operations, maintenance, and management all trust. Here's how steel plants are building these systems in 2026, what it takes to get the data right, and how OXmaint turns live OEE data into maintenance actions that close the gap between where you are and world-class.
4–6 weeks
typical delay in traditional OEE reporting
<30 sec
data refresh in real-time systems
+8–15 pts
OEE improvement from real-time visibility alone
$12–30M
annual value unlocked per integrated mill
Why Monthly OEE Reports Don't Work Anymore
Most steel plants still calculate OEE monthly from manually collected production reports, maintenance logs, and quality records. This approach was adequate when markets were stable and competition was regional. In 2026, it's a liability. Plants using OXmaint's real-time monitoring platform are making decisions in minutes that their competitors make in weeks.
Monthly Reporting
Data collected manually from shift logs
Definitions inconsistent across departments
Downtime reasons categorized retroactively
Quality data from lab reports, 2–4 hour delay
Results arrive 4–6 weeks after losses occur
Root causes unrecoverable after the fact
Result: A rearview mirror. Tells you what happened. Can't change anything.
Real-Time Monitoring
Data captured automatically from PLC/DCS/sensors
Single OEE definition enforced plant-wide
Downtime categorized at the moment it occurs
Quality signals from inline sensors, real-time
OEE visible every second, shift, day
Root cause investigation starts during the event
Result: A windshield. See losses as they happen. Fix them now.
The Data Architecture: Where OEE Numbers Come From
Real-time OEE requires data from three distinct layers — process automation, maintenance management, and quality systems. Most steel plants have all three in some form. The challenge is connecting them into a unified calculation that updates continuously without manual intervention.
Layer 1
Process Automation (Availability + Performance)
PLC status signals
Drive speed feedback
Production counters
Line state detection
What it captures: Equipment running vs stopped, actual production rate vs theoretical maximum, cycle times, speed losses, minor stoppages, idle time — all automatic, no operator input required.
↓ feeds into ↓
Layer 2
Maintenance Management — OXmaint CMMS (Availability)
Work orders
Downtime codes
Repair durations
PM schedules
Predictive alerts
What it captures: Why the equipment stopped (breakdown, PM, changeover, external), how long it took to repair, which component failed, what work was done. This turns raw downtime into actionable maintenance intelligence.
↓ feeds into ↓
Layer 3
Quality Systems (Quality Rate)
Inline gauges
Surface inspection
Lab results
Downgrade tracking
What it captures: Conforming vs non-conforming product, defect types, dimensional accuracy, surface quality, grade achievement.
OXmaint's surface inspection integration feeds quality data directly into OEE calculations.
→
The integration challenge: Most plants have these systems already — the data exists in Level 1 PLCs, Level 2 process control, LIMS quality databases, and scattered maintenance tools. OXmaint's value is connecting all three layers into a single real-time OEE calculation that everyone trusts.
Stop Debating the Numbers. Start Trusting Them.
OXmaint integrates with your existing automation, quality, and process systems to create one real-time OEE dashboard that operations, maintenance, and management all use.
What the Dashboard Actually Shows
A real-time OEE dashboard isn't a single number on a screen. It's a layered view that lets different roles see different depths — from the plant manager who needs a 30-second status check to the maintenance planner who needs to understand which specific equipment is driving losses right now.
72.4%
Plant OEE
↑ 2.1 vs last week
Shows: Overall plant health, trend direction, which of the three OEE factors needs attention today
Process Area
OEE
Top Loss
Status
Blast Furnace
81.2%
Tuyere change (45 min)
On Track
BOF Melt Shop
68.5%
Lance change delay
Below Target
Caster #1
74.8%
Sequence break (mold change)
On Track
Hot Strip Mill
61.3%
F4 stand bearing alarm
Action Needed
Shows: Per-area OEE with the single biggest loss happening right now and a status indicator that flags where attention is needed
Hot Strip Mill — F4 Stand Bearing Alert
Equipment: F4 Stand Work Roll Bearing, Drive Side
Health Score: 62/100 (declining from 88 over 12 days)
AI Prediction: Functional failure in 18–25 days without intervention
OEE Impact: Currently reducing HSM performance by 3.2 points (speed restricted to 85%)
Recommended Action: Schedule bearing change during next roll change — estimated 2.5 hr task
Cost if Planned: $14K (bearing + labor during scheduled window)
Cost if Failed: $2.8M (bearing + gearbox damage + 72 hr emergency stop)
Shows: Specific equipment, AI health score, predicted failure timeline, current OEE impact, recommended action with cost comparison — everything the planner needs to make a decision
From Data to Action: The Real-Time Loop
Real-time OEE monitoring only matters if it triggers real-time response. OXmaint closes the loop by connecting OEE data directly to the maintenance management system — so when OEE drops, the cause is identified and a work order is generated automatically.
1
OEE Drop Detected
System detects HSM OEE dropped 4.2 points in the last 2 hours. Performance factor is the driver — actual speed is 12% below theoretical.
→
2
Root Cause Identified
AI correlates the speed reduction with F4 stand vibration data showing bearing degradation. The operator speed restriction is protecting the bearing — correctly — but OEE is paying the price.
→
3
Work Order Generated
OXmaint creates a priority work order: "F4 WR Bearing DS — replace during next roll change. Parts reserved. Estimated task: 2.5 hrs. OEE recovery: +3.2 performance points."
→
4
OEE Recovers
Bearing replaced during scheduled roll change. HSM returns to full speed. OEE recovers 3.2 points within 2 hours of repair completion. The system logs the improvement for future ROI tracking.
Without real-time monitoring: Speed restriction continues for 3–4 weeks until next PM or until bearing fails catastrophically. OEE loss: 3.2 points × 25 days = massive cumulative impact.
With OXmaint: Issue identified same day, repaired within 72 hours during planned window. Total OEE impact: 3.2 points × 3 days instead of 25.
See the Loss. Find the Cause. Fix It. Measure the Recovery.
OXmaint's real-time OEE module connects live production data to maintenance intelligence — closing the loop between what's happening on the floor and what your team does about it. See how
AI-driven scheduling prioritizes repairs by OEE impact.
What Real-Time Monitoring Reveals That Monthly Reports Hide
01
Micro-Stoppages That Add Up to Hours
Monthly reports show "95% availability." Real-time data shows 180 stoppages under 5 minutes each — totaling 11 hours of lost production that never appeared in the shift log because nobody recorded them. These micro-stoppages are invisible to manual tracking and represent 3–5 OEE points at most plants.
02
Speed Losses from Equipment Degradation
The caster is "running" — but casting speed dropped 8% over two weeks as mold copper wear increased friction. Monthly reports show 100% availability. Real-time monitoring shows the 8% performance loss that's costing $40K per day in reduced throughput.
03
Shift-to-Shift Variation
Plant OEE averages 62%. But Shift A runs at 71%, Shift B at 64%, and Shift C at 51%. The monthly average hides a 20-point gap between best and worst shift — a gap that's almost entirely operational practices and changeover discipline, not equipment.
04
Changeover Time Creep
Standard changeover is 45 minutes. Real-time data shows actual changeovers ranging from 38 to 112 minutes with no documentation of why. The average crept from 45 to 62 minutes over 6 months — adding 2.8 hours of lost production per week that nobody noticed.
05
Quality Losses Linked to Specific Equipment Conditions
Surface defect rate spikes every time secondary cooling zone 3 flow drops below 85% capacity. Monthly quality reports show "defect rate: 6%." Real-time correlation shows it's 2% when cooling is healthy and 14% when nozzles are degraded. The maintenance action that fixes it is obvious — but only if you can see the correlation in real time.
Implementation: Building Your Real-Time OEE System
Data Source Audit & Connection
✓ Map all existing data sources (PLC, DCS, historian, LIMS, existing CMMS)
✓ Define OEE calculation standards per process area
✓ Connect OXmaint to Level 1/Level 2 systems via OPC-UA
✓ Establish downtime code taxonomy
Dashboard Build & Validation
✓ Configure dashboards per role (plant manager, area, maintenance)
✓ Run parallel with existing reporting for accuracy validation
✓ Train operators on downtime code entry at the moment of occurrence
✓ Calibrate alert thresholds and escalation rules
Go-Live & Continuous Improvement
✓ Retire manual OEE reporting
✓ Connect AI predictive alerts to OEE impact calculations
✓ Begin weekly OEE review meetings with real-time data
✓ Launch maintenance–OEE closed-loop workflow
Proven Results
+12 pts
Average OEE improvement within 12 months of real-time monitoring deployment
73%↓
Reduction in unrecorded micro-stoppages once automated tracking replaces manual logs
$18M/yr
Average annual value from OEE improvements at a 2M ton integrated mill
85%
Of OEE losses now have documented root causes vs 30% under manual reporting
Real-time OEE monitoring isn't just measurement — it's the foundation for every maintenance improvement that follows. Without accurate, timely data, predictive maintenance, condition-based scheduling, and shutdown optimization are all flying blind. With it, every investment in maintenance improvement has a measurable OEE outcome. Learn how OXmaint's integrated platform combines real-time OEE with predictive maintenance, how AI failure detection feeds directly into OEE recovery, how OEE benchmarks by process area set your improvement targets, how caster AI scheduling prevents the breakouts that destroy availability, and how surface defect inspection closes the quality rate gap.
Measure It in Real Time. Improve It Every Shift.
OXmaint turns OEE from a monthly report nobody trusts into a live operating system that drives daily decisions — connecting every sensor, every work order, and every quality signal into one number your entire plant believes.
Frequently Asked Questions
What data connections does OXmaint need for real-time OEE?
OXmaint connects via OPC-UA, Modbus, and historian APIs (OSIsoft PI, Honeywell PHD, etc.) for process data. Quality data comes from LIMS integration or inline inspection systems. Most plants have 80–90% of the data already available — the gap is usually in connecting it, not collecting it.
How do we standardize OEE definitions across departments?
OXmaint enforces a single OEE calculation methodology configured during implementation. Downtime categories, planned vs unplanned definitions, speed loss thresholds, and quality criteria are agreed once and applied consistently. No more department-specific interpretations producing conflicting numbers.
Can we see OEE by shift, by crew, and by product grade?
Yes — OXmaint slices OEE by any dimension: shift, crew, grade, product type, customer order, or time period. Shift-to-shift comparisons reveal operational practice gaps. Grade-by-grade analysis shows which products stress equipment. Crew comparisons identify training opportunities.
How does real-time OEE connect to maintenance decisions?
Every OEE loss is tagged with a cause category. When a maintenance-related cause is identified, OXmaint can automatically generate a work order. AI predictive alerts include the OEE impact of each developing issue, helping maintenance planners prioritize repairs by production impact — not just equipment severity.
What OEE improvement should we expect from real-time monitoring alone?
Plants typically see 8–15 OEE points from visibility alone in the first year — before adding predictive maintenance or AI scheduling. The improvement comes from eliminating unrecorded losses, faster response to developing problems, reduced changeover times, and shift-to-shift performance equalization.