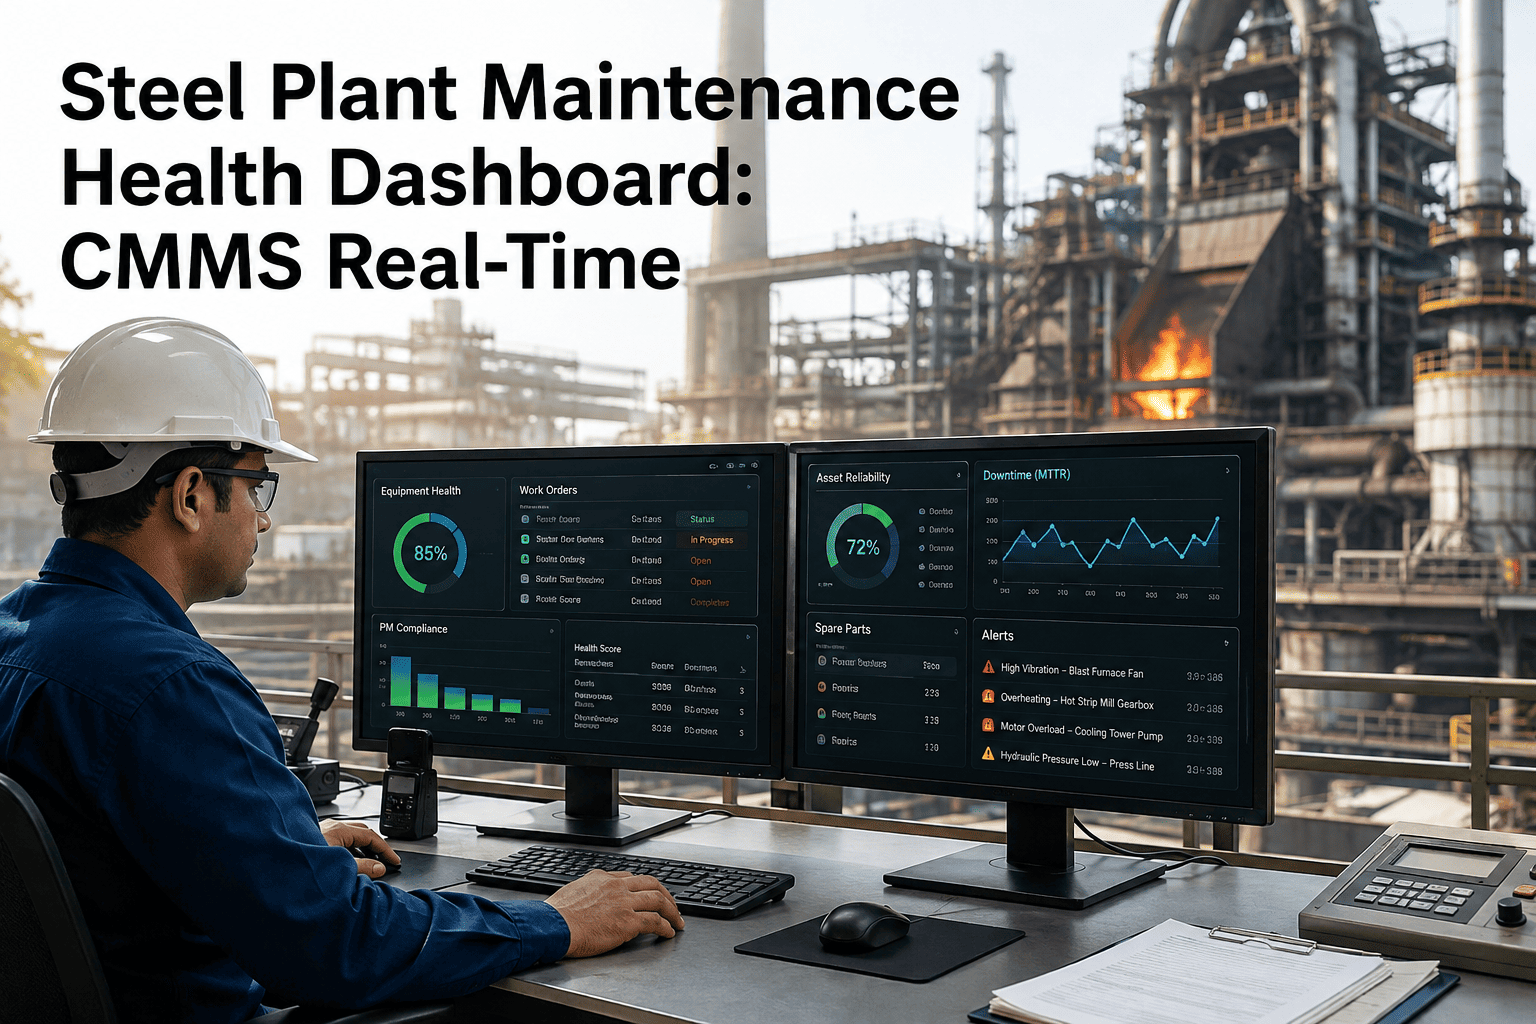
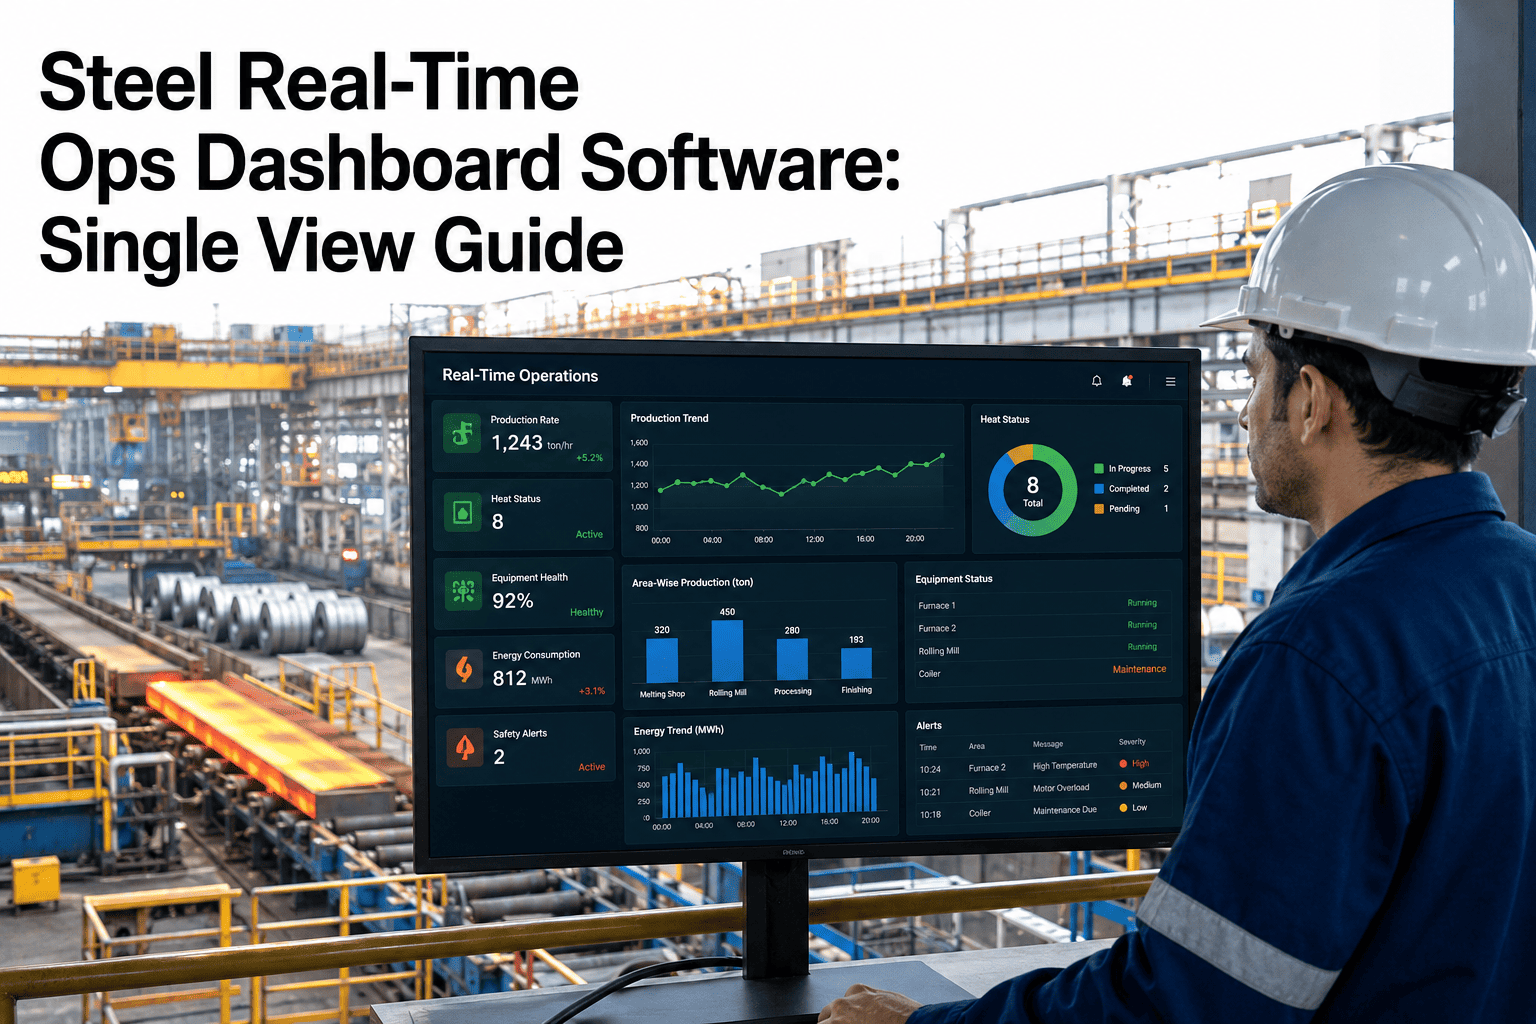
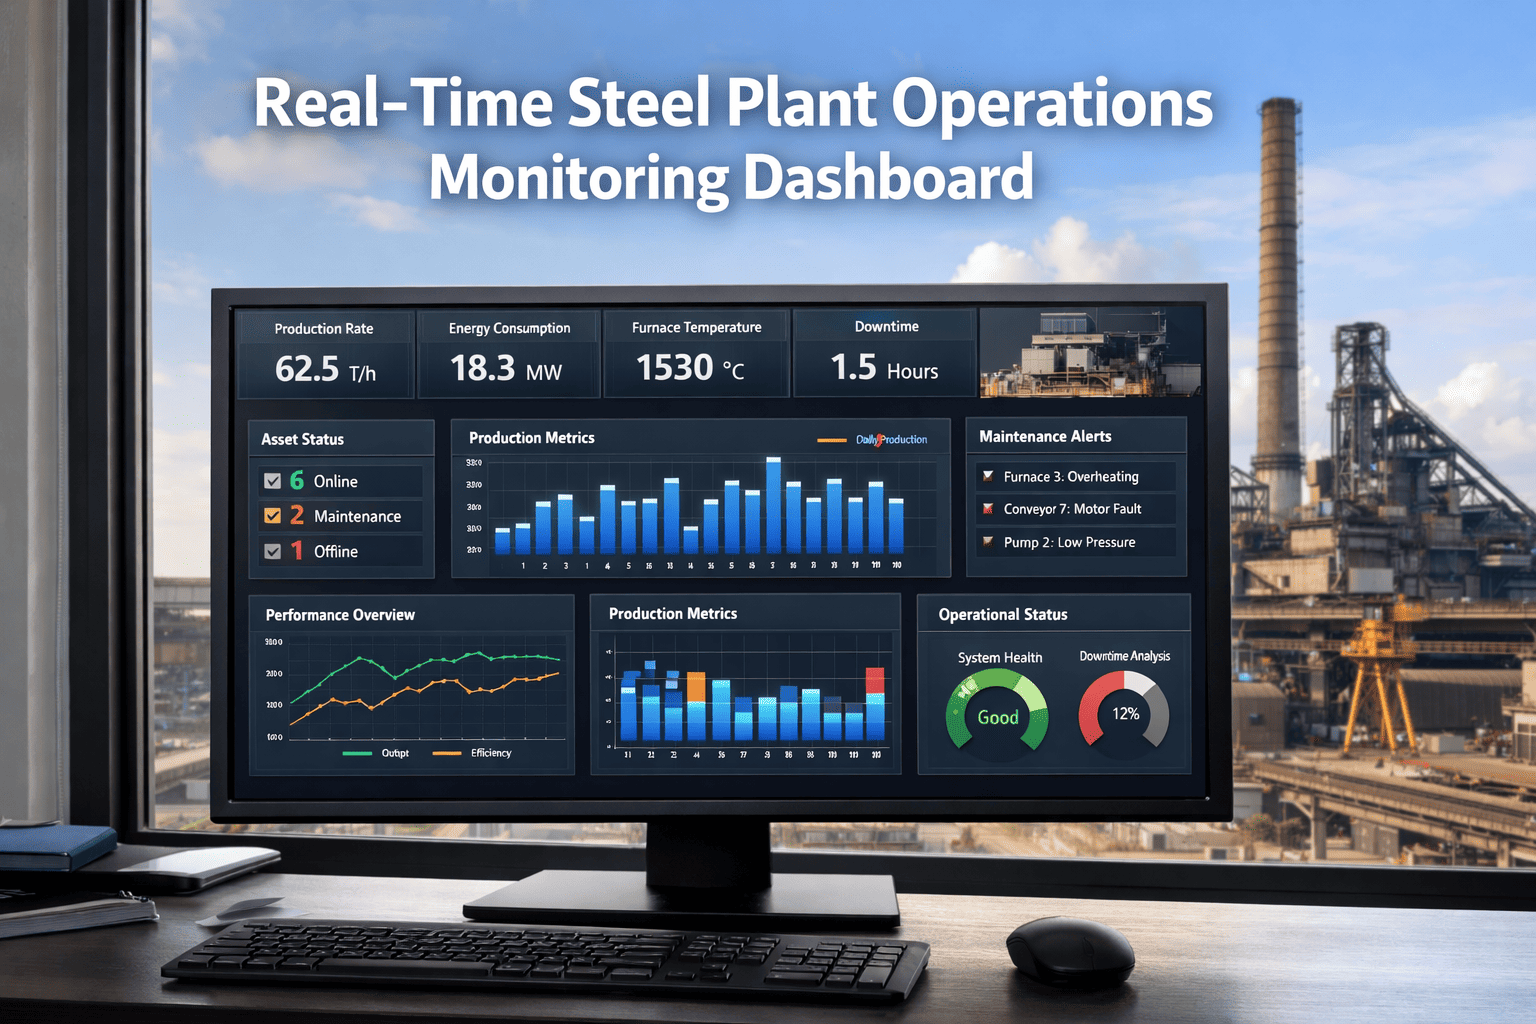
When a blast furnace cooling pump starts drifting toward failure, or a rolling mill's OEE quietly slips five points below target, a monthly maintenance report tells the plant weeks after the damage is done. A real-time maintenance health dashboard changes that by turning blast furnace, rolling mill, crane, and energy KPIs into one live screen that shift supervisors and plant managers watch together instead of a spreadsheet someone chases at month-end. Book a demo to see a live health dashboard built around your own furnaces, mills, and cranes.
Why Steel Plants Are Retiring the Monthly Report
Integrated mills lose production capacity every day a health signal sits buried in a spreadsheet instead of on a screen someone is actually watching. The gap between what a plant knows and what a plant could know, if the data updated live, is where most avoidable downtime hides.
85%+
World-class OEE target for a steelmaking operation — most integrated mills run well below it
60-75%
Where most U.S. integrated mills actually operate, losing 10-25% of theoretical capacity
$10M
Approximate annual revenue value of a single OEE point on a 2 MTPA steel plant
92%+
PM compliance target on Tier 1 assets that live dashboards make possible to sustain
See your own equipment health, live. Create a free Oxmaint account and connect your first asset group in minutes — no spreadsheet required.
Sign Up Free
How a Steel Plant Health Dashboard Is Built
A health dashboard is only as good as what feeds it. Plants that get real value out of theirs build it in layers, moving from a single plant-wide number down to the exact bearing or valve driving that number down.
01
Criticality-Weighted Health Score
Blast furnace auxiliaries, rolling mill drives, and caster components are weighted higher than balance-of-plant assets, so one composite score actually reflects risk to production.
02
Live KPI Feed
Availability, OEE, MTBF, and MTTR recalculate as sensors report and work orders close, instead of waiting for a monthly reconciliation cycle.
03
Area-Level Drill-Down
One tap from the plant-wide score lands on blast furnace, rolling mill, or crane fleet health — another tap lands on the specific pump, motor, or valve behind the dip.
04
Threshold Alerts
A cooling pump MTBF sliding under 6,000 hours or a hot blast stove valve drifting past its condition threshold triggers a work order automatically, before it becomes a breakdown.
05
Shift-Floor and Wall Display
The same health score renders on a control-room wall screen, a supervisor's tablet, and a technician's phone, so every shift reacts to the same number.
What the Dashboard Actually Tracks
AI-assisted health dashboards monitor every production asset — from blast furnace auxiliaries to crane fleets — surfacing patterns that are impossible to catch in a spreadsheet reviewed once a month.
Blast Furnace Campaign Health
Tracks cooling pump MTBF, stove valve condition, and tap hole equipment status against campaign-normalized targets.
Rolling Mill OEE
Live availability, performance, and quality rates calculated against design rolling speed for the current product grade.
Crane Fleet Availability
Real-time uptime across ladle cranes and yard cranes, flagging fleet-wide risk before a single failure stops logistics.
Energy KPIs
Interval-based energy consumption per tonne, tied back to the equipment condition driving inefficiency.
PM Compliance
Scheduled versus completed preventive maintenance by area, with drift flagged before it affects reliability.
Reliability Trend
MTBF and MTTR trending by asset class, showing whether the maintenance program is improving or slipping.
How Often Each KPI Should Refresh
Not every metric needs the same refresh rate. Treating them all the same either floods the dashboard with noise or hides a real problem behind stale numbers.
Metrics tied to safety and immediate production risk refresh in seconds; planning metrics like PM compliance are just as useful reviewed once a day.
Not sure which KPIs belong on your dashboard? Our team will map your blast furnace, rolling mill, and crane data sources to a health dashboard built for your plant.
Schedule Assessment
Monthly Report vs. Real-Time Health Dashboard
The difference isn't just speed — it's whether equipment health is something the plant discusses after the fact, or something it acts on while there's still time to prevent the failure.
Monthly Maintenance Report
- Health picture is 30 days stale by the time anyone reads it
- Built manually from spreadsheets pulled across departments
- Same view for the GM and the technician on the floor
- Root cause investigation starts after the breakdown
30+ days
typical lag before a health issue is even reviewed
→
Real-Time Health Dashboard
- Health score updates as work orders close and sensors report
- Calculated automatically from CMMS and process data
- Plant-wide view for leadership, asset drill-down for technicians
- Threshold alerts open a work order before failure happens
30-60 sec
refresh rate on the metrics that matter most
What Plants Report After Going Live
Mills that move health tracking onto a live dashboard consistently see the same pattern: problems get caught earlier, and the whole team starts working from one trusted number instead of three conflicting ones.
Less unplanned downtime within two quarters
Faster MTTR once technicians see live history on mobile
To establish a reliable KPI baseline from CMMS data
Typical payback period on a plant-wide rollout
We had three systems producing three different OEE numbers — maintenance said one thing, production said another, quality said something else. A live health dashboard gave the whole plant one number everyone actually trusted.
— Steel Plant Reliability Manager
Rolling Out a Health Dashboard
Successful rollouts move through the same four phases, connecting CMMS and process data before layering in threshold alerts and wall displays.
Week 1-2
Data Source Mapping
CMMS and historian audit
Asset criticality ranking
Week 3-4
Baseline Capture
90-day KPI baseline
Data quality verification
Week 5-6
Dashboard Configuration
Health score weighting
Threshold alert setup
Week 7+
Go Live & Refine
Wall and mobile rollout
Continuous threshold tuning
Frequently Asked Questions
What should the top-level number on a steel plant health dashboard show?
A single criticality-weighted score combining availability, OEE, and open critical work orders across blast furnace, rolling mill, and crane assets.
Book a demo to see how the weighting is built.
How fast does a CMMS-driven dashboard actually update?
Sensor-linked KPIs like availability and OEE typically refresh every 30-60 seconds, while MTBF and MTTR recalculate the moment a technician closes a work order.
Do we need new sensors to build a real-time health dashboard?
No. Most plants start with existing process historian and CMMS data, then layer in sensor feeds later.
Sign up for a free account to see what your current data already supports.
Can the same dashboard serve both the plant manager and the technician?
Yes. The plant-wide score is built for leadership review, while drill-down views expose the specific asset and failure history each technician needs on the floor.
How long before a health dashboard shows a reliable trend?
Most plants need about 90 days of consistent CMMS data before KPI trends are stable enough to act on with confidence.
Give Your Plant One Number Everyone Trusts
Stop reconciling three different OEE numbers from three different teams. Oxmaint turns blast furnace, rolling mill, and crane data into one live health dashboard your whole plant can act on.