Maintenance is the single largest controllable cost in steel manufacturing—consuming 10–15% of total production cost and up to 35–40% of operational revenue at struggling facilities. Yet most steel mills treat maintenance as overhead to be minimized rather than a strategic lever to be optimized. The result is a vicious cycle: budgets get cut, preventive work gets deferred, equipment fails more often, emergency repairs cost 3–5 times more than planned work, and total maintenance spending actually increases instead of decreasing. Steel mills achieving bottom-quartile maintenance cost per tonne—as low as $15–18 per tonne—are not the ones spending least on maintenance. They're the ones spending smartest. They've systematically eliminated the premium costs of reactive maintenance, optimized spare parts inventory, extended equipment life through disciplined PM execution, and created organizational structures where maintenance drives production uptime rather than responding to failures. A 3.5 MTPA integrated steel mill typically operates between $20–45 per tonne in annual maintenance cost. The difference between a $20 mill (world-class) and a $40 mill (reactive-dominant) is not equipment age or geography. It's maintenance program maturity, data quality, and organizational discipline. Over a 3.5 million-tonne annual production run, the difference between $25 and $35 per tonne is $35 million—more than enough to fund a comprehensive AI-powered CMMS system, pay back within 11 months, and leave years of operational profit on the table.
Understanding Maintenance Cost Drivers in Steel Plant Operations
Before implementing cost reduction strategies, you must understand where your maintenance dollars are actually flowing. Most steel mills don't have clear visibility. They know total annual maintenance budget and total maintenance headcount, but they cannot articulate what percentage of that budget goes to reactive versus preventive work, which assets consume the most maintenance resources, or where unplanned downtime is concentrated. This visibility gap is the first cost reduction opportunity. Steel mills with mature CMMS systems discover that 45–65% of maintenance spending is reactive (emergency repairs from failures), 25–40% is preventive (scheduled PM), and 10–15% is condition-based (predictive maintenance). Within reactive spending, the breakdown is typically: 40% is equipment failure repairs (bearing replacements, seal replacements, electrical replacement), 30% is unplanned downtime labor (crews standing by waiting for parts or repair authorization), 20% is expedited parts procurement (emergency overnight shipping premiums, expedite fees), and 10% is emergency contractors (overtime labor, out-of-hours call-outs). The asymmetry is severe: a $500 bearing replaced during planned maintenance costs $500 in parts and maybe 2 hours of labor ($150–200). That same bearing failing during production costs $500 in parts, 4–6 hours of labor ($600–900), 3–8 hours of downtime at $260,000+ per hour in lost production value, compressed-air system damage ($5,000), and a 15% quality impact on the next 8 hours of output (additional $40,000+ loss). That $500 part failure costs $350,000+ in total impact. Every dollar deferred from planned maintenance creates $3–5 of future emergency costs. The business case for preventive maintenance is overwhelming—but it requires discipline to fund PM during profitable years when the temptation to cut budget is highest. Book a Demo to see how OxMaint quantifies your maintenance cost drivers and models the financial impact of each improvement strategy.
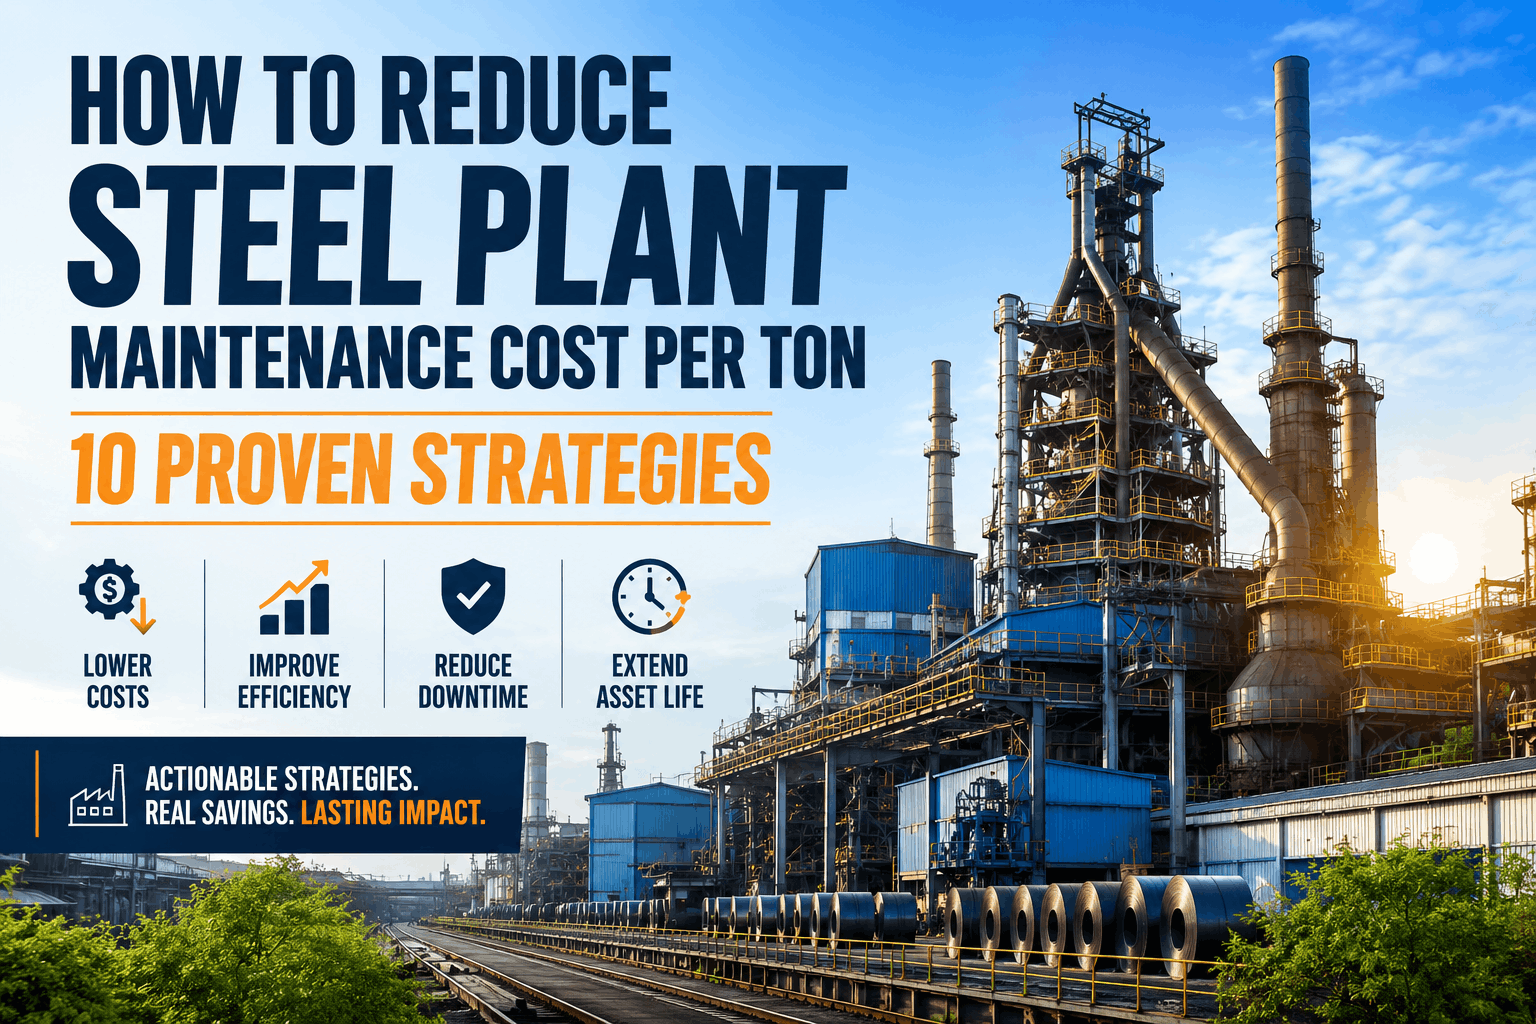
Ten Proven Maintenance Cost Reduction Strategies for Steel Plants
These strategies are ranked by impact potential—estimated annual savings for a typical 3.5 MTPA integrated steel mill. Implementation timelines vary: some deliver impact within 90 days, others require 6–12 months to mature. The total savings potential when all ten strategies are executed systematically is 20–35% maintenance cost reduction—equivalent to $3.5M–$6.2M annually for a mid-size mill. Importantly, most cost reductions come from elimination of expensive emergency repairs and downtime losses, not from reducing overall maintenance spending. World-class mills spend more on planned maintenance than reactive mills; they just spend far less in total because the planned work prevents cascading failures and unplanned downtime. Start Free Trial to implement these strategies within OxMaint's CMMS framework and track savings month-by-month with executive dashboards.
Shift Reactive Maintenance to Preventive Discipline (Potential Savings: $1.8M–$2.4M annually)
Establish PM schedules for all critical and semi-critical assets based on manufacturer recommendations, industry standards, and your facility's operating conditions. Execute PM work on schedule at minimum 85% compliance. For every 5–10% increase in PM execution rate, you prevent 1–2 unplanned breakdowns per asset annually. Across a 500+ asset facility, this compounds into massive downtime avoidance. OxMaint's PM scheduling engine manages frequency, labor allocation, and parts procurement automatically—eliminating the manual coordination that causes half your PM to be missed or rescheduled.
Implement Predictive Maintenance on High-Criticality Equipment (Potential Savings: $1.2M–$1.8M annually)
Deploy condition monitoring sensors on your top 20–30 assets—blast furnace blowers, rolling mill drives, EAF electrodes, ladle metallurgy furnaces, and key pumps. Monitor vibration, temperature, pressure, electrical signature, and acoustic emissions. Use machine learning to predict remaining useful life on bearings, refractory, and electrical components. Schedule maintenance during planned windows aligned with production schedules rather than reacting to failures. Preventing just 4–6 catastrophic failures annually on critical equipment pays back the sensor and analytics investment.
Optimize Spare Parts Inventory and Right-Size Stock Levels (Potential Savings: $600K–$900K annually)
Most steel mills maintain 20–30% excess spare parts inventory—capital sitting idle that could be deployed elsewhere. Using historical failure data and predictive maintenance forecasts, establish optimal stock levels for each critical part. Fast-moving items (bearings, seals, filters) warrant higher stock; slow-moving items (major pump housings, motor casings) warrant lower stock and longer lead times. Automate reorder triggers so parts arrive just-in-time for maintenance execution rather than gathering dust. Eliminate obsolete inventory from retired equipment. Typical optimization reduces carrying cost 15–25% while improving parts availability.
Reduce Emergency Repair Costs Through CMMS-Managed Work Orders (Potential Savings: $400K–$700K annually)
Emergency repairs cost 3–5× more than planned work because of expedited parts, overtime labor, and coordination overhead. By executing PM work on schedule, you reduce the emergency repair queue from 40–50% of total work to 20–25%. Lower emergency volume allows crews to work during normal shift hours, eliminates overtime premiums, and reduces parts expediting costs. OxMaint's CMMS tracks every work order to completion, preventing the lost-job-card problem where work gets done but never recorded—which means you can't verify what was actually done and can't learn from patterns.
Extend Equipment Life Through Early Detection and Condition-Based Maintenance (Potential Savings: $500K–$800K annually)
Equipment failures rarely happen without warning. Vibration increases, temperature trends upward, cycle time lengthens, or power consumption changes before catastrophic failure. Condition monitoring with OxMaint allows you to detect these changes weeks or months early. Address the problem during planned maintenance rather than waiting for failure. Early intervention extends equipment life 15–30% beyond replacement schedules, preventing the massive costs of equipment replacement while the current asset still has functional life remaining.
Eliminate Maintenance Backlog and Hidden Deferred Work (Potential Savings: $300K–$600K annually)
Most steel mills have 150–300 hours of deferred maintenance work on the books—PM tasks not yet scheduled, repairs postponed due to production pressure, or maintenance requests waiting for parts. This backlog represents future failure risk. Each month of deferral compounds the cost—a minor bearing replacement deferred 3 months becomes a major bearing and shaft replacement costing 5× more. Establish a 90-day maximum deferral policy. Never let maintenance requests sit more than 30 days without scheduling. Use OxMaint's backlog visibility to quantify the cost of deferred work and justify budget to execute it.
Improve Maintenance Labor Efficiency and Reduce Mean Time to Repair (Potential Savings: $400K–$650K annually)
Most plants have MTTR (mean time to repair) of 6–12 hours for routine equipment repairs and 24–48 hours for complex failures. Identifying where time is lost—waiting for parts, waiting for PM authorization, waiting for co-workers, or waiting for production to schedule a maintenance window—is the first step. Optimize work order information so technicians have complete instructions and parts lists before arriving at the equipment. Pre-stage common parts near work areas. Establish fast-track maintenance windows during shift transitions. Reduce average MTTR by 15–20% across all equipment classes and you save 8–12 hours of labor daily.
Leverage Root Cause Analysis to Eliminate Recurring Failures (Potential Savings: $250K–$500K annually)
If a bearing fails three times in 18 months, the real problem is not the bearing—it's the underlying cause: misalignment, contamination, inadequate lubrication, thermal stress, or design issue. Most steel mills replace the bearing without investigating the root cause, so the same failure repeats. Mandatory root cause analysis on all failures >$10K or >1 hour downtime identifies these patterns. Once identified, permanent corrections (realignment, improved sealing, design modification) prevent the failure class entirely. Three to five major root cause investigations yield permanent fixes that eliminate 5–10% of future failure frequency.
Optimize Maintenance Workforce and Reduce Contractor Spending (Potential Savings: $200K–$450K annually)
Many steel mills engage outside contractors for 15–25% of maintenance work—typically at 2–3× the cost of equivalent internal labor. This is justified only for specialized skills (advanced diagnostics, major rebuilds, specialized certifications). For routine maintenance and emergency repairs, internal crews should handle 80%+ of the work. Invest in training and cross-skilling so you have sufficient capacity internally. Audit contractor spend—many mills don't realize how much goes to outside resources. Shifting 20% of contractor work to trained internal crews saves 30–50% on that work's cost.
Track and Benchmark Maintenance Cost Per Tonne Monthly (Potential Savings: $100K–$300K annually from behavioral change)
What gets measured gets managed. Most steel mills calculate maintenance cost per tonne quarterly or annually—too infrequently to identify trends or intervene. Track it monthly by equipment class, by production line, by cost category (PM, emergency, contractor, spare parts). Compare your facility's cost per tonne against global benchmarks. Visibility alone typically drives 5–10% cost reduction as teams see their performance and feel accountability. OxMaint's monthly dashboards make cost per tonne visible to every stakeholder—giving you a monthly scorecard that drives continuous attention to cost discipline.
Measuring and Tracking Maintenance Cost Reduction Progress
Cost reduction means nothing without measurement. Establish a baseline—your current maintenance cost per tonne across all spending categories. Track monthly actuals against that baseline. Attribute savings to specific initiatives so you can quantify which strategies are delivering return and which need adjustment. Common tracking categories: PM labor cost per tonne, emergency repair labor cost per tonne, spare parts cost per tonne, contractor spending per tonne, and unplanned downtime hours per tonne. Each category should trend downward month-over-month as your initiatives mature. Year 1 typically delivers 8–12% cost reduction. Year 2 delivers additional 5–10% as initiatives compound and behavioral change deepens. By Year 3, world-class mills have stabilized at sustainable cost per tonne levels.
Establish Maintenance Cost Baseline and Benchmark Against Industry
Calculate your current maintenance cost per tonne: Total Annual Maintenance Spending / Annual Production in Tonnes. Break it down by category: preventive, emergency, spare parts, contractor, and overhead. Research global benchmarks for your equipment type and production volume. Identify which categories are above industry average—these are your target reduction areas.
Prioritize the Three Highest-Impact Cost Reduction Strategies
Don't attempt all ten strategies simultaneously. Prioritize the three that are most applicable to your facility's current challenges. If your mill is reactive-dominant (40%+ emergency work), Strategies 1 and 2 are priorities. If your spare parts inventory is bloated, prioritize Strategy 3. Start with high-impact, moderate-implementation initiatives. Success builds momentum for subsequent strategies.
Implement CMMS-Based Work Order Discipline and PM Execution
Use OxMaint to schedule all PM work, track completion against schedule, and maintain complete job records. Establish target PM compliance at 85%+ and monitor weekly. Every job card must document work done, parts used, labor hours, and completion time. This discipline is the foundation for all subsequent cost reductions—you cannot improve what you don't measure.
Execute Root Cause Analysis on All Major Failures and Implement Permanent Corrections
Establish a decision rule: any failure costing >$10K or causing >1 hour downtime requires documented root cause analysis within 48 hours. Use the analysis to identify permanent corrections that prevent the failure class. Track repeat failures—if you see the same failure three times in 12 months, you have a systemic problem that requires capital investment or redesign.
Report Monthly Maintenance Cost Per Tonne and Progress Against Targets
Generate executive-level monthly reports showing maintenance cost per tonne for the current month, year-to-date, and previous year. Show cost breakdown by category. Compare against your improvement targets. Identify which cost categories are trending favorably and which need intervention. Use this monthly discipline to maintain stakeholder focus on cost reduction.
Frequently Asked Questions: Maintenance Cost Reduction for Steel Plants
What percentage of maintenance budget should go to preventive versus reactive work?
World-class plants operate at 70–80% preventive, 15–25% emergency, 5–10% condition-based. Most plants starting cost reduction programs are 35–50% preventive, 40–50% emergency. The shift happens as PM discipline improves and emergency frequency drops.
How much does emergency maintenance cost compared to planned maintenance?
Typically 3–5× more when you include parts expediting, overtime labor, and downtime production loss. A $500 bearing replacement during planned maintenance costs ~$700 total. The same bearing failing unexpectedly costs $3,500+ including emergency parts, labor premium, and lost production.
How long until I see maintenance cost reduction results?
First month brings visibility (5% reduction from behavioral change). Months 2–4 bring PM discipline improvements (8–12% reduction). Months 5–12 bring emergency reduction and inventory optimization (15–20% total reduction). Year 2 brings predictive maintenance maturity (additional 5–10% reduction).
Should I reduce maintenance headcount to cut costs?
No. Cost reduction comes from elimination of expensive emergency repairs and unplanned downtime, not from cutting crews. Adequate crews executing planned maintenance cost less in total than understaffed crews dealing with emergencies. Right-size your crews to support your target PM compliance rate.
How do I justify maintenance budget increases to finance when total costs are down?
Show the financial impact of deferred maintenance and failures avoided. Every $1 invested in planned maintenance saves $3–5 in emergency costs. Frame maintenance spending as investment with quantified return—downtime avoided, production capacity retained, equipment life extended.
Can OxMaint help me identify which maintenance strategies will have the most impact?
Yes. OxMaint analyzes your current maintenance data, failure patterns, cost distribution, and PM compliance to recommend which strategies will yield the highest return for your facility. The platform shows projected savings for each initiative so you can prioritize smartly.
How often should I recalculate maintenance cost per tonne?
Monthly is ideal for tracking trends and catching cost inflation early. Weekly is possible if your plant has daily cost accounting. At minimum, quarterly review prevents you from missing three months of adverse trends. OxMaint calculates continuously so you can review on whatever frequency suits your governance.
What benchmark should my facility target for maintenance cost per tonne?
Global benchmarks for integrated steel mills range $15–18/tonne for world-class, $22–28/tonne for good performers, $30–35/tonne for average, and $40+/tonne for reactive-dominant. Your target depends on your facility age and equipment type, but reducing toward the good performer range is achievable within 24 months.