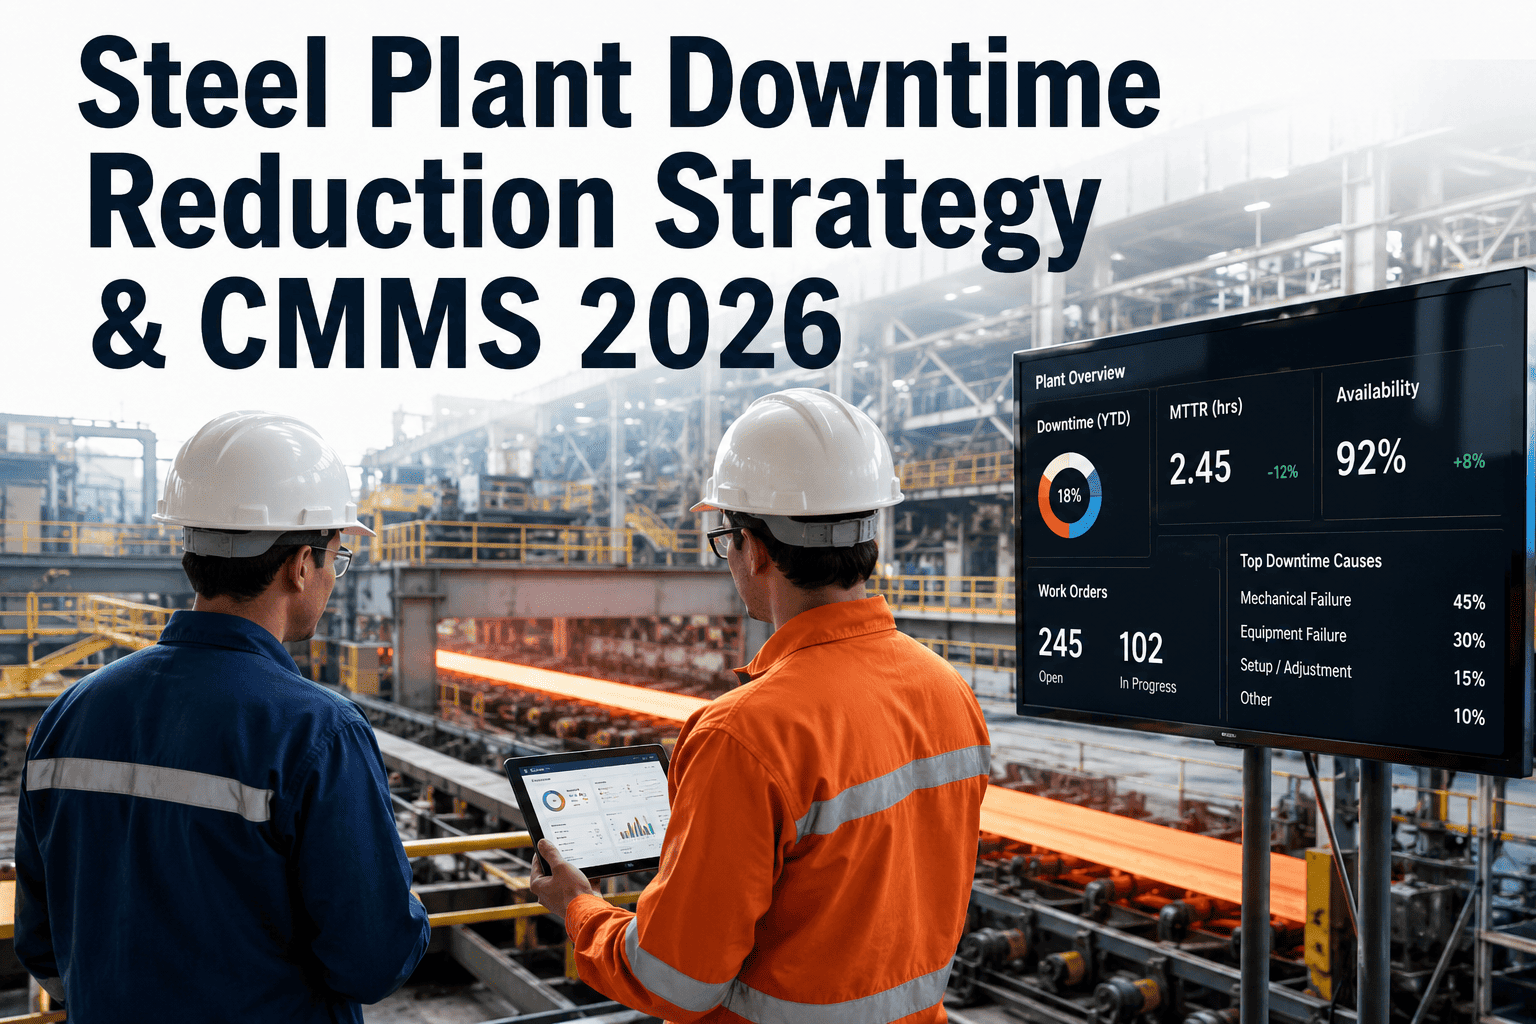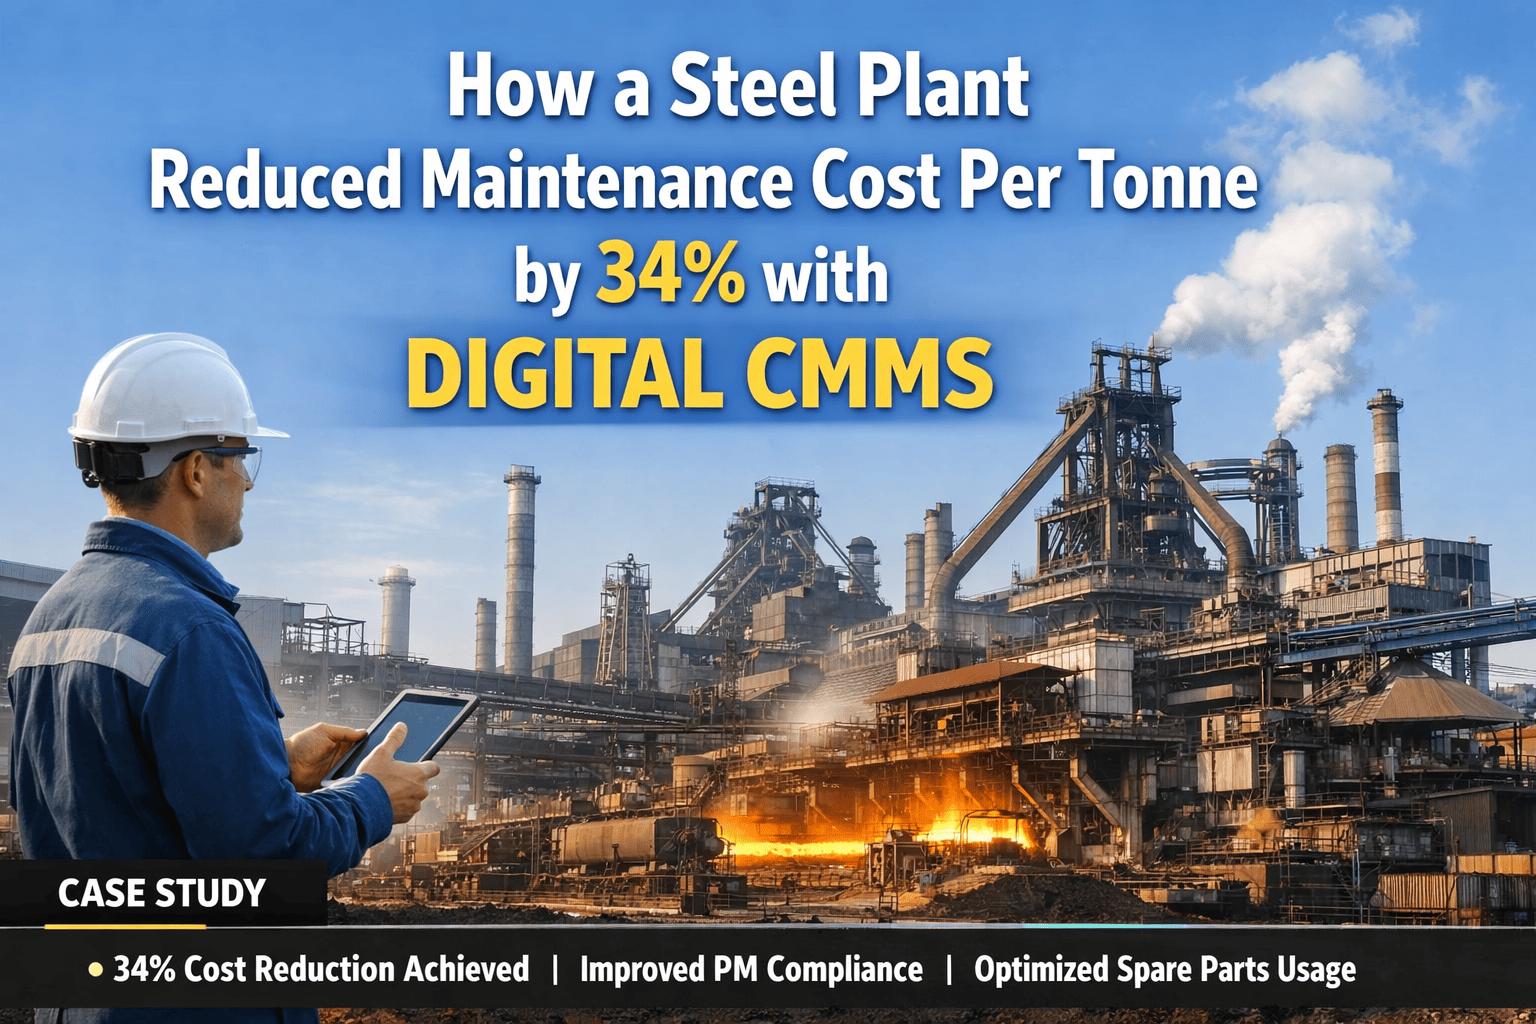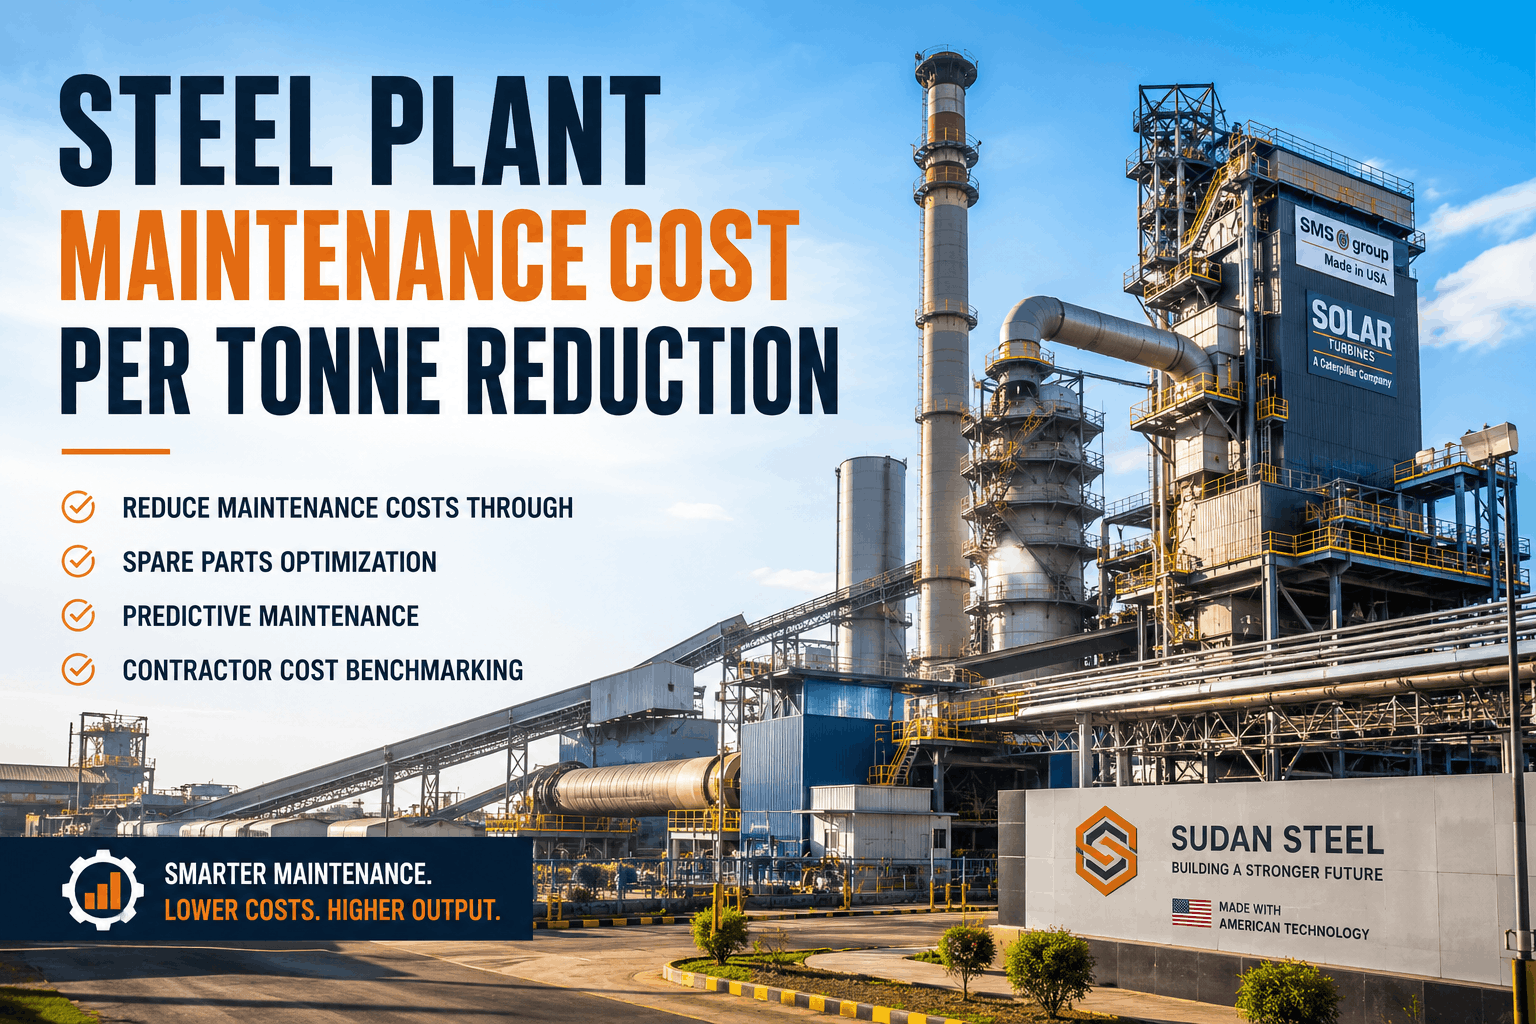
Steel plant maintenance cost per tonne is the single most comprehensive financial metric in steelmaking. It integrates labor efficiency, spare parts optimization, emergency repair reduction, extended equipment life, and unplanned downtime elimination into one number. A well-managed integrated steel mill operates at $20–45 per tonne in annual maintenance costs. The difference between a $20/tonne plant and a $40/tonne plant is not equipment age, geography, or raw material prices — it is maintenance program maturity, data quality, and organizational discipline around planned vs. reactive work. Over a 3.5 million-tonne annual production run, a $10/tonne improvement represents $35 million in recovered operating margin annually. This margin is often enough to fund a comprehensive AI-powered CMMS platform, pay back within 11–14 months on the first prevented critical failure, and then compound as downtime avoidance accumulates across your entire asset base. Sign Up Free to track maintenance cost per tonne automatically using OxMaint's financial analytics, turning cost reduction from a manual annual exercise into a real-time operational discipline.
The Hidden $35M in Your Maintenance Budget
Most steel plants track total annual maintenance spend, total maintenance headcount, and little else. They cannot articulate what percentage of that budget goes to reactive vs. preventive work, which assets consume the most maintenance resources, or where unplanned downtime is concentrated. This visibility gap is the first cost reduction opportunity. Steel mills with mature CMMS systems discover that 45–65% of maintenance spending is reactive (emergency repairs from equipment failure), 25–40% is preventive (scheduled PM), and 10–15% is condition-based (predictive maintenance). Within that reactive spending, the breakdown is: 40% is equipment failure repairs (bearing replacements, seal replacements, electrical replacement), 30% is unplanned downtime labor (crews standing by waiting for parts or repair authorization), 20% is expedited parts procurement (emergency overnight shipping premiums, expedite fees), and 10% is emergency contractors (overtime labor, out-of-hours call-outs). Book a Demo to see how OxMaint's financial analytics attribute maintenance cost to specific assets and work types — transforming your maintenance budget from a black box into an actionable cost reduction roadmap.
Six Levers for Steel Plant Maintenance Cost Reduction
Cost reduction in steel plant maintenance requires attacking multiple dimensions simultaneously. Reactive work reduction cuts emergency labor and expedite parts costs. PM compliance improvement extends equipment life and prevents cascading failures. Spare parts optimization balances stocking costs against parts availability. Contractor cost management reduces the premium labor burden. Labor efficiency tracks where crews spend time and identifies skill gaps. And unplanned downtime elimination directly protects production margin. A CMMS that tracks all six levers simultaneously — not in isolation — enables maintenance finance teams to make evidence-based investment decisions about where to focus cost reduction effort. Sign Up Free to implement cost reduction discipline across your entire maintenance operation.
Reactive Work Elimination Through PM Execution Discipline
Every PM executed on schedule prevents 1–2 unplanned failures annually per asset. For every 5–10% improvement in PM completion rate, you prevent one additional failure that would have cost 5–15× the PM cost. OxMaint surfaces the ROI of PM execution in real time — when a blast furnace cooling pump PM is delayed by one week, the system models the risk: "this delay increases failure risk probability by 8% over the next 30 days, valued at $150K in potential unplanned downtime cost." PM scheduling shifts from nice-to-have to urgent when the downtime cost is visible.
Spare Parts Optimization: Right Parts, Right Time
Over-stocking ties up capital and warehouse space. Under-stocking forces emergency overnight procurement at 3–5× the standard parts cost. OxMaint forecasts parts demand 6–12 weeks ahead based on MTBF trends, seasonal patterns, and scheduled PM. Automatic purchase orders trigger when stock drops to reorder points, replacing the manual tracking that leads to either excessive inventory or emergency shortages. For a facility with $2–5M in spare parts inventory, optimized stocking typically frees 15–25% of capital while reducing procurement expedite costs 40–50%.
Equipment Life Extension and Capital Deferral
A rolling mill bearing with disciplined PM extends life 15–30% beyond the baseline replacement interval — deferring a $500K bearing replacement 2–3 years. For an asset-intensive facility managing hundreds of bearings, hydraulic packs, and drive motors, the compounding deferral across all equipment extends 5–10 year capital replacement plans by 12–18 months. This creates both near-term cash preservation and long-term capital budget relief. OxMaint's equipment health trending surfaces which assets are candidates for life extension vs. replacement.
Contractor Cost Management and Labor Optimization
Contractors typically cost 2–3× internal labor rates due to overhead, insurance, and coordination expense. OxMaint surfaces contractor utilization by work type — which tasks actually require specialized contractor skills vs. which could be handled by trained internal crews. Many plants discover 30–40% of contractor spend is for work that could be performed internally with modest skills development investment. Retraining internal crews to handle routine contractor work (refractory lining, hydraulic pack rebuilds) shifts work from $200/hour contractor rates to $50–70/hour internal labor.
Labor Efficiency Tracking and Skill Gap Identification
OxMaint captures actual labor hours on work orders, repair duration by equipment class and failure type, and crew productivity metrics. Compare one crew's MTTR on bearing replacement against another crew's MTTR for the same task. If crew A averages 3 hours and crew B averages 5 hours, the gap is skill variance, not equipment variance. Structured training targeting crew B's skill gaps compresses repair times and reduces total labor spend without adding headcount. This lens-on-labor is invisible to plants managing crews as generic "maintenance hours" buckets.
Unplanned Downtime Elimination and Production Margin Protection
Every hour of unplanned blast furnace downtime costs $50–300K in lost margin depending on production rates and product mix. A rolling mill stoppage cascades into caster backup and finishing line delays, multiplying the impact. OxMaint's predictive maintenance reduces unplanned downtime by detecting degradation 2–8 weeks ahead of failure, enabling planned intervention during scheduled windows rather than emergency stops during production peaks. The ROI case is mathematically simple: preventing one critical failure pays for years of CMMS operation and predictive maintenance infrastructure.
Maintenance Cost Per Tonne Benchmarks and Financial Planning
Understanding where your facility sits relative to industry benchmarks is the starting point for cost reduction strategy. World-class integrated mills operate below $35/tonne. Median performers sit at $45–60/tonne. Reactive-heavy operations may sit at $70–100/tonne. Your baseline position determines the target-setting and investment decisions for CMMS, condition monitoring, and workforce development. A plant at $50/tonne has a clear economic case to invest in technology that shifts the mix toward predictive work — the payback is directly visible. This table shows maintenance cost composition across typical mills, enabling you to diagnose where your specific costs are concentrated.
| Cost Category | World-Class (<$35/t) | Median Performance ($50/t) | Reactive-Heavy ($75/t) | Cost Reduction Lever |
|---|---|---|---|---|
| Preventive labor | $8–12/t | $10–15/t | $8–12/t | PM execution discipline + labor efficiency |
| Reactive labor | $5–8/t | $12–18/t | $28–40/t | Reactive work elimination (highest impact) |
| Parts and materials | $8–10/t | $12–15/t | $18–25/t | Spare parts optimization + life extension |
| Contractors | $3–5/t | $8–12/t | $12–20/t | Internal skills development + contractor mgmt |
| Unplanned downtime impact | $1–2/t | $8–15/t | $9–15/t | Predictive maintenance + PM compliance |
10-Point Maintenance Cost Reduction Roadmap
Cost reduction is a multi-year discipline, not a one-time initiative. The highest-impact reductions typically come in the first 12–18 months (reactive work elimination, PM compliance improvement, contractor cost management), with continued gains over 3–5 years as equipment life extension and efficiency improvements compound. Book a Demo to map your specific facility's cost structure and baseline a reduction roadmap that reflects your current starting position and financial targets.
Frequently Asked Questions: Steel Plant Maintenance Cost Reduction
What is the realistic maintenance cost per tonne for a new CMMS deployment at a 3.5 MTPA integrated mill?
Year 1 (baseline + PM enforcement): $45–55/tonne. Year 2 (PM compliance improving, condition monitoring deployed): $40–48/tonne. Year 3+ (reactive work down 40%, equipment life extended, labor efficiency improving): $28–36/tonne. The $10–15/tonne improvement over 3 years compounds into $35–52M in recovered annual margin at 3.5 MTPA production.
How does unplanned downtime cost get calculated into maintenance cost per tonne?
Unplanned downtime cost = (hourly production loss in tonnes × selling price per tonne × gross margin %) / annual tonnes produced. For a blast furnace at $50/hour loss × 85% gross margin, each unplanned downtime hour represents $42.50/tonne in lost margin. Over a year with 10 unplanned stoppages averaging 4 hours each, unplanned downtime impacts cost by $170/tonne — often the single largest maintenance cost driver, though invisible on P&L.
What percentage cost reduction should a plant expect in the first 12 months of CMMS deployment?
Typical first-year reductions: 8–12% from PM compliance improvement and reactive work elimination. Year 2 adds 5–10% from contractor cost management and spare parts optimization. Year 3+ adds 3–8% from equipment life extension and condition-based maintenance maturity. Total 3-year reduction: 15–30%, with the largest gains concentrated in months 6–18 of implementation.
How does OxMaint calculate cost by asset and help identify which assets are cost drivers?
OxMaint accumulates all maintenance costs (labor, parts, contractor, downtime impact) against specific assets. A blast furnace cooling system may show $800K annual spend; a rolling mill bearing $200K. Trend over time — if cooling system costs are rising 20% annually while MTBF is declining, the cost-MTBF correlation signals replacement or redesign is needed. This asset-level cost visibility drives capital allocation decisions toward the assets where maintenance investment delivers highest ROI.
Can OxMaint integrate with our existing ERP and financial systems to automatically flow maintenance cost data?
Yes — OxMaint integrates with SAP, Microsoft Dynamics 365, and most standard ERP systems via API connections. Maintenance costs captured at work order closure flow automatically to your GL accounts, eliminating manual data entry and enabling month-end cost accounting to close without lag or manual adjustment.