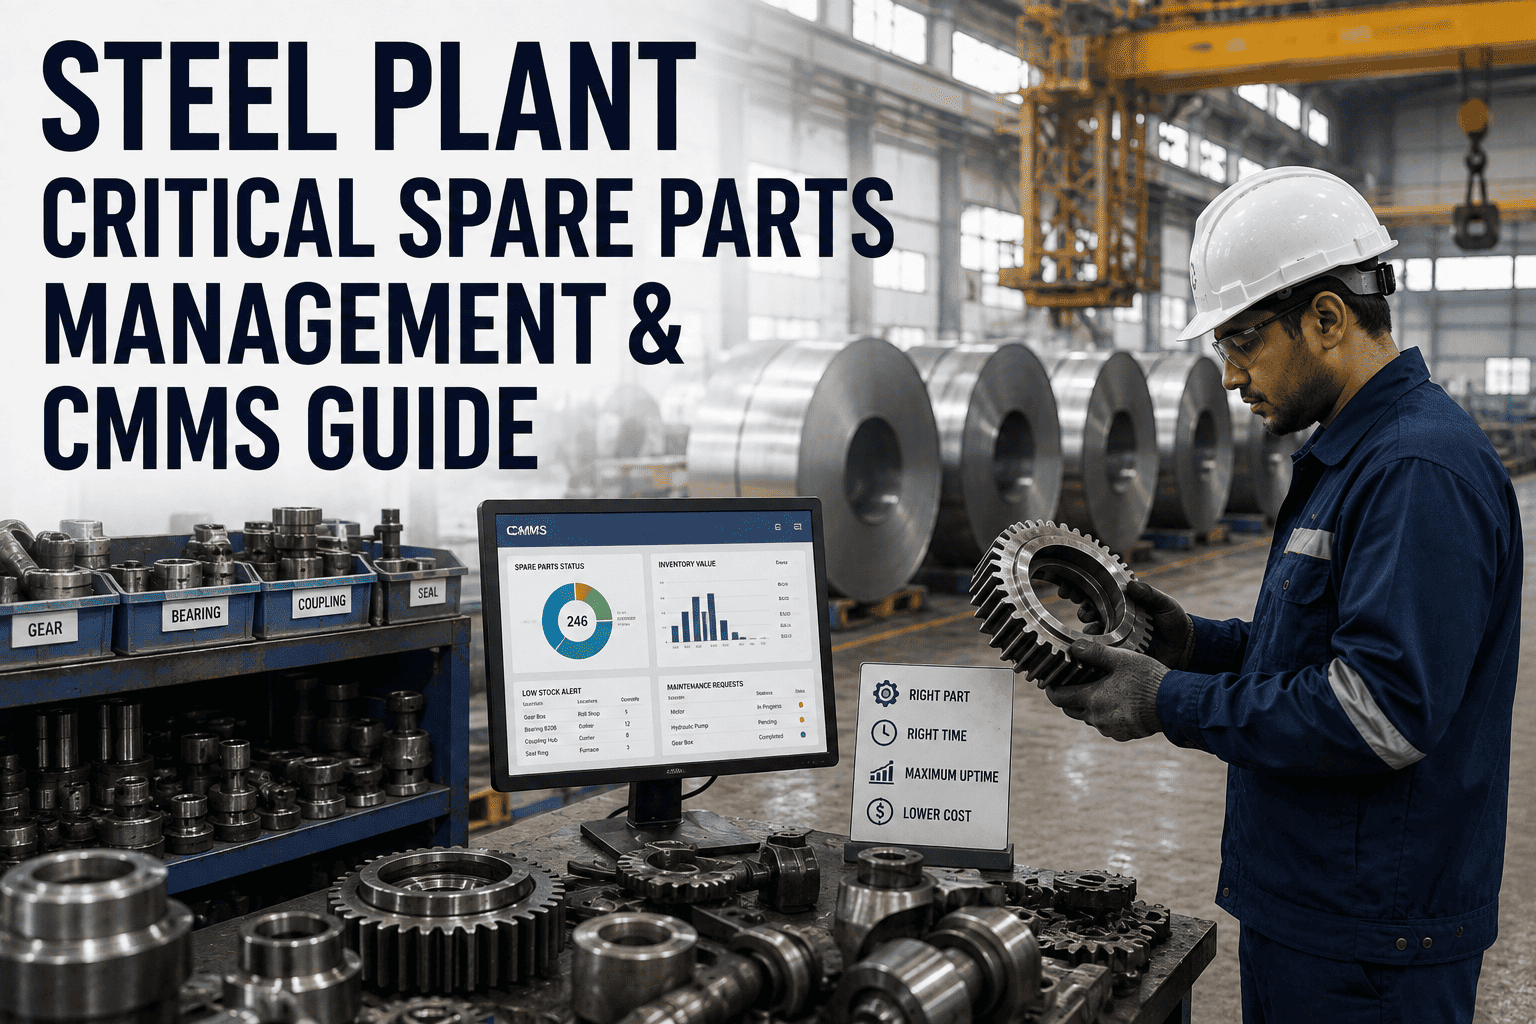
A steel plant's spare parts warehouse is either a strategic asset that prevents million-dollar production losses — or a graveyard of dead stock consuming capital that could be invested elsewhere. The typical integrated steel plant carries $8–25 million in spare parts inventory across 15,000–40,000 unique SKUs, yet consistently experiences stock-outs on the exact parts needed during critical failures while simultaneously holding $2–6 million in obsolete or slow-moving inventory that hasn't been touched in years. The problem isn't spending too much or too little on inventory — it's spending on the wrong items. CMMS-driven spare parts management connects every part in the warehouse to the equipment it serves, the failure history that predicts when it will be needed, the vendor lead times that determine when to reorder, and the criticality classification that decides how much safety stock to carry — transforming inventory from a static warehouse function into a dynamic reliability strategy that ensures the right part is available at the right time without burying capital in parts that will never be used.
Inventory Health Score
Optimally stocked — 75%
Over/under stocked — 20%
Critical gap or obsolete — 5%
Warehouse Snapshot
24,680
Unique SKUs
$14.2M
Total Inventory Value
$3.8M
Dead Stock (no movement 24+ months)
342
Items Below Reorder Point
97.1%
Service Level (parts available when needed)
2.8×
Annual Inventory Turns
ABC Classification: Not Every Part Deserves the Same Attention
A steel plant warehouse contains 24,000+ SKUs, but managing all of them with equal attention is impossible and wasteful. ABC classification based on CMMS consumption data and criticality scoring ensures inventory effort is proportional to impact — intensive management for the vital few, efficient systems for the many.
A
8% of SKUs
72% of value
Critical & High-Value
Compressor bearings, hydraulic servo valves, transformer bushings, specialty refractory, caster mold plates, roll bearings, main drive motor components, large gearbox internals, custom-fabricated items with 12+ week lead times.
▸ Individual item tracking with serial numbers and condition documentation
▸ Reorder triggered by CMMS consumption forecast, not just min/max levels
▸ Safety stock calculated from vendor lead time + failure probability
▸ Quarterly review by reliability engineering — adjust quantities based on equipment condition data
B
22% of SKUs
22% of value
Moderate Value & Regular Consumption
Standard bearings, pump seals, gasket sets, contactors, relays, instrumentation, standard hydraulic hoses, common valve types, coupling elements, filter cartridges for critical systems.
▸ Min/max stocking with automated reorder through CMMS purchase requisition
▸ Semi-annual review cycle — adjust based on 12-month consumption trending
▸ Vendor-managed inventory where possible to reduce carrying cost
C
70% of SKUs
6% of value
Low Value & High Volume
Fasteners, O-rings, welding consumables, lubricant cartridges, cable ties, general filters, safety hardware, common fittings, cleaning supplies, PPE, general-purpose tools.
▸ Bulk reorder with generous safety stock — cost of stock-out exceeds carrying cost
▸ Annual review only — simplify management to minimize administrative cost
▸ Kanban or visual replenishment systems for high-frequency consumables
The Stock-Out Cascade: What Happens When the Part Isn't There
A stock-out on a critical spare part doesn't just delay one repair — it triggers a cascade of escalating costs that multiplies the impact far beyond the part's purchase price. Every stage of the cascade adds cost that could have been avoided by carrying the correct safety stock level.
Hour 0
Equipment Failure
Hot mill F4 work roll bearing fails during production run. Maintenance team responds immediately. Diagnosis confirmed within 45 minutes.
Production loss begins: $6,000/hour for full mill stoppage
Hour 1
Part Not in Stock
Bearing SKU checked in warehouse system — zero on hand. Last unit consumed 6 weeks ago. Reorder was generated but procurement delayed by purchasing approval backlog.
Emergency sourcing begins. Local suppliers contacted — no stock. Regional search expands.
Hour 6
Emergency Procurement
Bearing located at distributor 400 km away. Emergency courier arranged. Part cost: $4,200 (standard price $2,800 — 50% premium for emergency sourcing). Courier cost: $850.
Total procurement premium: $2,250 above standard cost
Hour 18
Part Arrives — Repair Begins
Bearing arrives after 12-hour delay. Night shift crew begins installation. Overtime labor rate applies — 1.5× standard for 4 technicians working through the night.
Repair complete, mill restarted after 24-hour total outage. Upstream caster had to reduce casting speed to manage slab accumulation. Downstream coating line ran out of material for 8 hours.
Total cascade impact across plant operations
Total Cost of One Stock-Out Event
Production loss (24 hrs × $6,000)$144,000
Emergency part premium$2,250
Overtime labor$2,400
Upstream/downstream disruption$38,000
Total event cost$186,650
The bearing costs $2,800. Carrying one spare in inventory for 2 years costs $560 in holding cost. The stock-out cost $186,650. Return on stocking: 333×.
Every Part Linked to Equipment. Every Reorder Point Calculated. Every Stock-Out Prevented.
OxMaint connects spare parts inventory to the equipment it serves — consumption forecasting from maintenance history, automated reorder when stock reaches calculated minimums, ABC classification from actual usage data, and stock-out risk alerts that flag potential shortages weeks before they become production-stopping emergencies.
Reorder Intelligence: When to Buy, How Much to Carry
Static min/max levels set once and never updated are the most common inventory management failure in steel plants. Equipment ages, failure rates change, vendors merge, lead times shift — but the reorder points stay frozen at whatever someone set 5 years ago. CMMS-driven reorder intelligence recalculates continuously based on actual data.
F-Stand Work Roll Bearing (SKU: BRG-4218)
Class A — Critical
Danger
Reorder
Optimal Range
Excess
Current: 4 units
Min stock (safety)2 units
Reorder point3 units
Max stock6 units
Avg consumption1.2 units / quarter
Vendor lead time8 weeks (confirmed)
Unit cost$2,800
Status: Within optimal range. Next projected reorder: 6 weeks based on consumption forecast.
Caster Mold Copper Plate (SKU: CST-M220)
Class A — Critical
Danger
Reorder
Optimal Range
Excess
Current: 1 unit ⚠
Min stock (safety)2 units
Reorder point3 units
Max stock5 units
Avg consumption0.8 units / quarter
Vendor lead time14 weeks (long-lead)
Unit cost$18,500
ALERT: Below minimum safety stock. Purchase requisition auto-generated 3 days ago. Vendor confirmed delivery in 14 weeks. Risk window: 11 weeks with only 1 unit on hand.
The Obsolescence Problem: $3.8 Million Sitting on Shelves
Every steel plant warehouse contains parts for equipment that has been replaced, modified, or decommissioned — but nobody updated the inventory. CMMS links every spare part to its parent equipment, so when equipment is retired or modernized, the associated parts are automatically flagged for review. Plants cleaning up obsolete inventory should book a free demo to see how CMMS identifies dead stock by linking parts to equipment lifecycle status.
Inventory Age Analysis — Movement-Based Classification
Active (moved in last 6 months)
$7.4M
52%
Healthy inventory. Monitor consumption rates and maintain reorder points.
Slow-Moving (6–18 months since last use)
$3.0M
21%
Review against CMMS equipment status. Many are legitimate insurance stock for low-frequency, high-consequence failures. Verify parent equipment is still in service.
Dead Stock (18–36 months — no movement)
$2.2M
16%
Cross-reference with CMMS: is parent equipment still installed? If yes, evaluate consumption forecast. If no, classify as disposal candidate. Potential recovery through inter-plant transfer or resale: $400K–$800K.
Obsolete (36+ months — equipment decommissioned)
$1.6M
11%
Parent equipment no longer exists in plant. Write off or dispose. Every month these parts remain on shelves costs $13,300 in warehouse space and carrying charges. Immediate action: list for inter-plant transfer or surplus sale.
Vendor Lead Time Intelligence: The Hidden Variable
Reorder points are only as good as the lead time assumptions behind them. A part with a "4-week lead time" that actually takes 10 weeks to arrive creates a 6-week stock-out risk window that no safety stock calculation anticipated. CMMS tracks actual delivery performance against promised lead times for every vendor and every part — building the real-world lead time data that makes reorder points reliable.
Bearing Supplier A — SKF / Timken
On-Time: 94%
Standard deep groove (Class B)
Promised: 10d · Actual avg: 11d
Tapered roller >200mm (Class A)
Promised: 6wk · Actual avg: 7.4wk
Custom bore bearing (Class A)
Promised: 10wk · Actual avg: 13.2wk
CMMS finding: Custom bore bearings consistently arrive 32% later than quoted. Safety stock calculation adjusted from 2 to 3 units to cover actual lead time variability.
Hydraulic Components — Bosch Rexroth / Parker
On-Time: 82%
Servo valve (Class A)
Promised: 4wk · Actual avg: 6.4wk
Hydraulic cylinder seal kit (Class B)
Promised: 5d · Actual avg: 6d
Pump cartridge assembly (Class A)
Promised: 8wk · Actual avg: 11.5wk
CMMS finding: Servo valve lead times increased 60% since last year — vendor supply chain constraint. Reorder point raised from 4 to 6 units. Alternative vendor qualification initiated.
Most steel plants can reduce total inventory cost by 18–30% while simultaneously improving parts availability by restructuring their inventory strategy around CMMS data. The savings come from two directions: reducing excess stock on over-purchased items and preventing stock-out costs on under-purchased items.
Reduce: Capital Freed from Excess
Dispose of obsolete stock (equipment decommissioned)
$1.6M freed
Reduce over-stocked Class B/C items to calculated max levels
$1.1M freed
Consolidate duplicate SKUs (same part, different descriptions)
$420K freed
Vendor-managed inventory for high-volume Class C items
$280K freed
Capital freed: $3.4M
+
Prevent: Costs Avoided by Better Stocking
Stock-out production losses avoided (est. 8 events/year)
$1.2M saved
Emergency procurement premiums eliminated
$380K saved
Overtime labor from delayed repairs avoided
$240K saved
Upstream/downstream cascade disruption prevented
$460K saved
Annual savings: $2.28M
Expert Perspective: The Warehouse Should Serve the Equipment, Not the Other Way Around
I've managed spare parts operations at three steel plants over 19 years, and the pattern is always the same when I walk in. The warehouse has 24,000 SKUs. Nobody knows which parts go to which equipment. The min/max levels were set by someone who left 8 years ago. There's $3–4 million in parts for equipment that was replaced during the last modernization. And the one bearing they actually needed last Tuesday at 2 a.m. wasn't in stock. The fundamental problem is that spare parts inventory has been managed as a warehouse function — count the parts, organize the shelves, process the purchase orders. But it should be managed as a reliability function — stock the parts that the equipment is most likely to need, based on failure data, condition monitoring, and vendor lead time reality. When I connect the spare parts system to the CMMS, three things change immediately. First, every part gets linked to the equipment it serves — so when equipment is decommissioned, the parts are flagged automatically instead of sitting on shelves for years. Second, reorder points are calculated from actual consumption data and actual vendor lead times — not from whatever someone guessed 5 years ago. Third, consumption forecasting uses equipment condition data — if vibration analysis shows a bearing is developing a defect, the CMMS checks whether the replacement bearing is in stock and orders it before the failure occurs. That's the difference between a warehouse and a reliability strategy. The warehouse stores parts. The reliability strategy ensures the right part is available at the moment of need. Every plant I've optimized this way achieved 97%+ service level while reducing total inventory value by 20–30%. Less money on shelves, fewer stock-outs. It sounds contradictory until you understand: the problem was never the total amount spent — it was the allocation.
Link Every Part to Its Parent Equipment in CMMS
This is the foundation. Until every SKU is linked to the equipment it serves, you can't identify obsolete stock, you can't forecast consumption from equipment condition, and you can't calculate reorder points from failure probability. Start with Class A parts — 8% of SKUs covering 72% of value.
Audit Actual Vendor Lead Times Against Purchase Orders
Pull the last 12 months of purchase orders and compare promised delivery dates to actual receipt dates. You'll find that 30–40% of vendors consistently deliver later than quoted — and your reorder points are based on the quoted lead times. Adjust reorder points to actual lead times and your stock-out rate drops immediately.
Run a Dead Stock Audit — It's Probably $2M+ Sitting There
Query every part with zero movement in 24+ months. Cross-reference against CMMS equipment register. If the parent equipment has been replaced, modernized, or decommissioned, the part is a disposal candidate. Most plants recover $400K–$800K through inter-plant transfers and surplus sales — and free up warehouse space that was storing air.
Every Part Linked. Every Level Calculated. Every Dollar Justified. Every Stock-Out Prevented.
OxMaint transforms spare parts inventory from a static warehouse into a dynamic reliability strategy — equipment-linked parts databases, consumption forecasting from maintenance history, automated reorder with vendor lead time intelligence, ABC classification from actual usage, obsolescence detection from equipment lifecycle data, and the service-level dashboards that prove the right part is always there when it matters.
How does CMMS improve spare parts inventory management in steel plants?
CMMS improves spare parts management by connecting every part in the warehouse to the equipment it serves, creating a living relationship between inventory and reliability. This connection enables five capabilities impossible with standalone warehouse systems. First, equipment-linked inventory means every SKU is tied to specific equipment assets — when a piece of equipment is decommissioned or modernized, all associated spare parts are automatically flagged for review, preventing the dead stock accumulation that typically consumes $2–6 million in steel plant warehouses. Second, consumption forecasting based on maintenance history predicts when parts will be needed by analyzing failure frequency, PM schedules, and equipment condition trends — rather than relying on static min/max levels that were set years ago. Third, automated reorder triggers generate purchase requisitions when stock reaches calculated reorder points, with reorder quantities optimized by actual vendor lead times rather than quoted lead times. Fourth, ABC classification is built from actual CMMS consumption data and equipment criticality scoring, ensuring management attention is proportional to impact. Fifth, condition-based ordering uses predictive maintenance data to pre-order parts before failures occur — if vibration analysis indicates a bearing defect developing over 4–6 weeks, the CMMS checks stock and orders the replacement bearing immediately.
What is ABC classification for spare parts in a steel plant?
ABC classification divides spare parts inventory into three tiers based on a combination of annual consumption value, equipment criticality, and failure consequence. Class A parts (typically 8% of SKUs representing 72% of inventory value) include critical, high-value items such as compressor bearings, hydraulic servo valves, caster mold plates, and custom-fabricated components with long lead times — these receive individual item tracking, consumption-based reorder forecasting, quarterly reliability engineering review, and safety stock levels calculated from failure probability and actual vendor lead time. Class B parts (22% of SKUs, 22% of value) include standard bearings, pump seals, contactors, and common valve types — these are managed through automated min/max reorder with semi-annual review and vendor-managed inventory where possible. Class C parts (70% of SKUs, 6% of value) include fasteners, O-rings, consumables, and general supplies — these use bulk reorder with generous safety stock (since carrying cost is minimal) and simple visual replenishment systems. CMMS builds this classification dynamically from actual consumption data rather than static assignment, and reclassifies parts automatically when consumption patterns change.
How much does a spare parts stock-out cost in a steel plant?
The cost of a single stock-out on a critical spare part in a steel plant typically ranges from $50,000 to $300,000 per event, depending on the production unit affected and the time required to source the part. A detailed cost breakdown for a typical stock-out event (hot mill roll bearing, 24-hour total delay) includes production loss at $6,000 per hour for a full mill stoppage ($144,000), emergency part procurement premium of 40–60% above standard pricing ($1,500–$3,000), emergency courier or freight costs ($500–$2,000), overtime labor for crews held on standby or working after-hours ($1,500–$4,000), and upstream and downstream cascade disruption as caster adjusts speed and downstream lines run out of material ($20,000–$60,000). Against these costs, carrying a single spare bearing in inventory costs approximately $560 per year in holding charges (capital cost, warehouse space, insurance, and handling). The return on stocking is typically 100–400× the annual holding cost per stock-out event prevented. CMMS data shows that a typical integrated steel plant experiences 6–12 significant stock-out events per year, representing $800,000 to $2.4 million in annual avoidable costs.
How do you identify and eliminate obsolete spare parts?
Obsolete spare parts are identified through CMMS equipment lifecycle linking — every spare part is connected to the equipment it serves, so when equipment is decommissioned, replaced, or modernized, all associated parts are automatically flagged for disposition review. The identification process works in four layers. First, automatic flagging: when equipment status changes to "decommissioned" or "replaced" in CMMS, all linked spare parts are immediately flagged as "review for obsolescence." Second, movement-based analysis: parts with zero consumption in 24+ months are classified as dead stock and cross-referenced against CMMS equipment register to determine if the parent equipment is still in service. Third, technology obsolescence: parts for which the original manufacturer has discontinued production or support are flagged regardless of movement — these represent supply chain risk even if the parent equipment is still operating. Fourth, disposition: confirmed obsolete parts are routed through a disposition workflow — inter-plant transfer to facilities with similar equipment, surplus sale through industry networks, or write-off and disposal. Typical results from a first-time obsolescence cleanup at a steel plant: $1.5–4 million in inventory identified as obsolete, $400K–$800K recovered through transfers and sales, and 15–25% of warehouse space freed for active inventory.
What is the ROI of CMMS-driven spare parts optimization?
CMMS-driven spare parts optimization delivers ROI from two simultaneous directions: capital freed from excess and obsolete inventory, and costs avoided through prevention of stock-outs. On the capital side, a typical integrated steel plant frees $2.5–4.5 million in the first year through disposal of obsolete stock ($1–2 million), reduction of over-stocked Class B and C items to calculated maximum levels ($800K–$1.5 million), consolidation of duplicate SKUs ($200–500K), and transition to vendor-managed inventory for high-volume, low-value items ($200–400K). On the cost avoidance side, annual savings of $1.5–3 million come from preventing 6–10 stock-out events per year that would have caused production losses ($800K–$1.8 million), eliminating emergency procurement premiums ($250–500K), avoiding overtime labor from delayed repairs ($150–300K), and preventing upstream and downstream cascade disruptions ($300–600K). Combined first-year value typically ranges from $4–7 million against implementation costs of $100–200K for CMMS configuration, data cleansing, and initial ABC classification — representing a 20–40× return on investment in year one, with $1.5–3 million in recurring annual savings thereafter.