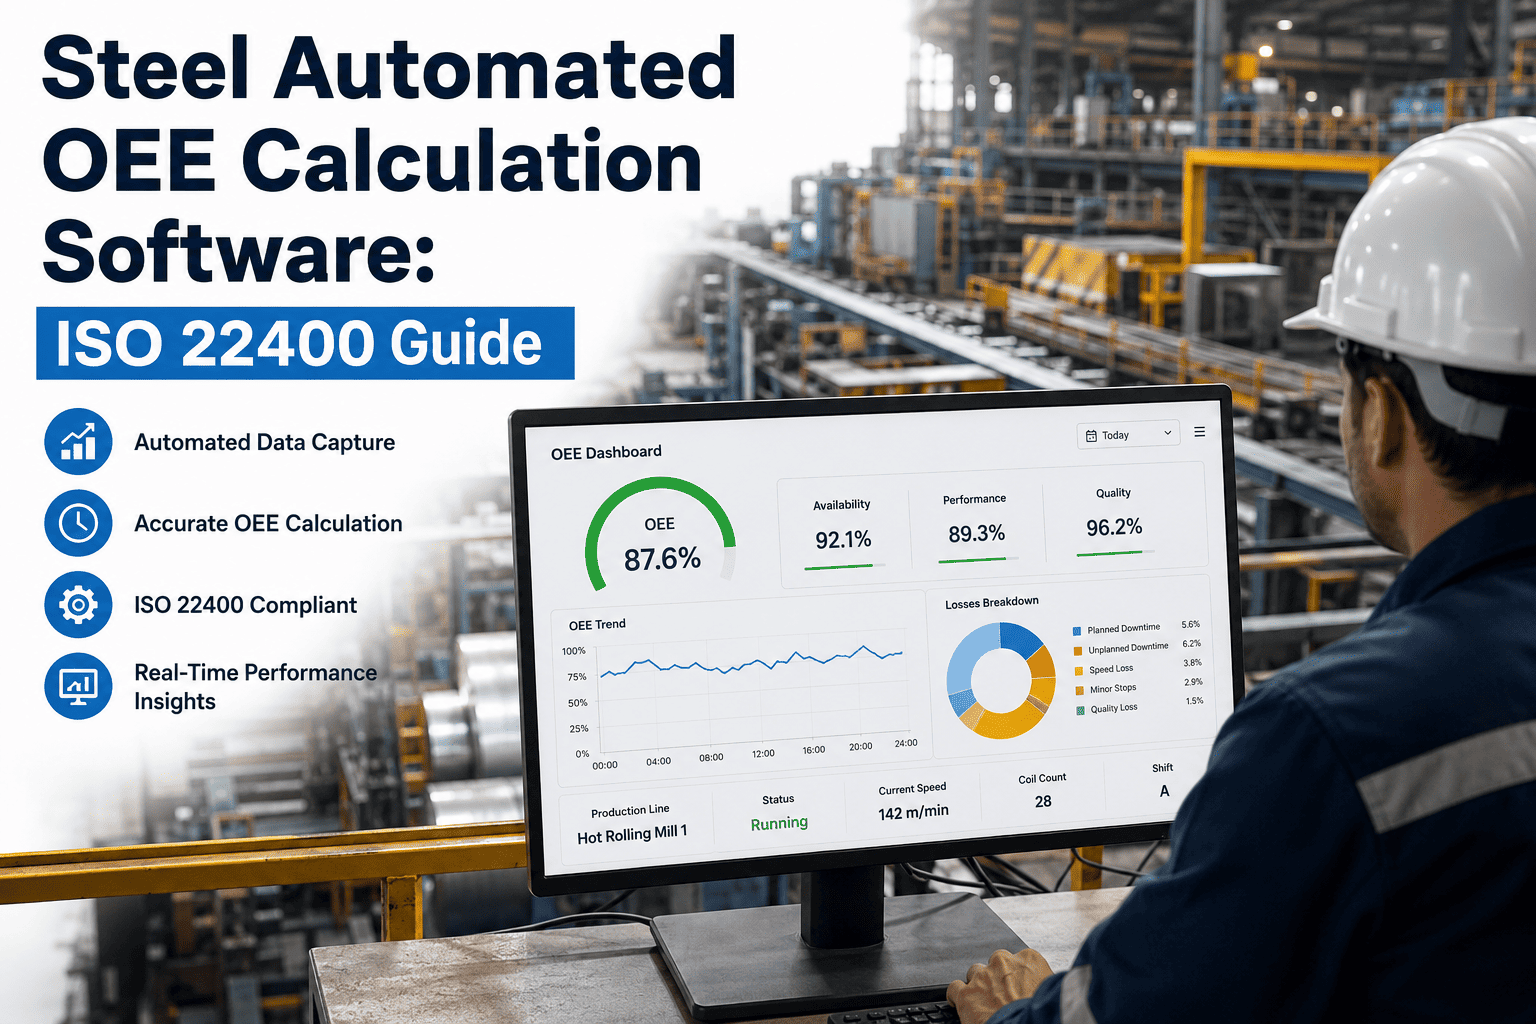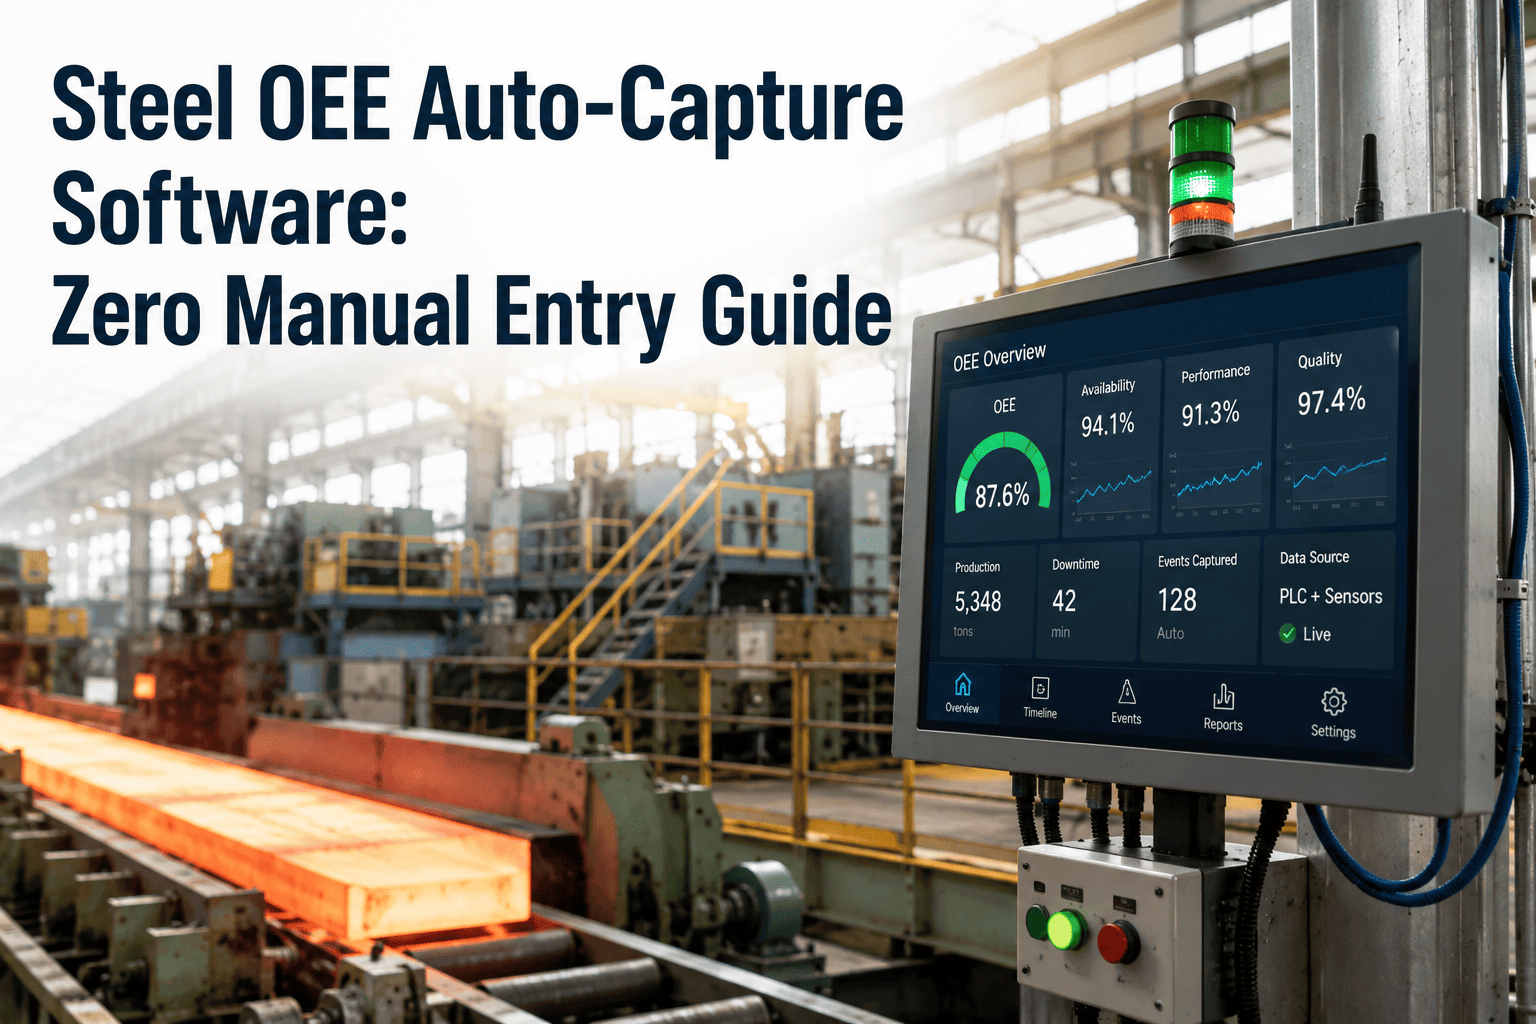
A steel plant that tracks OEE on paper is not tracking OEE — it is tracking whatever the operator remembered to write down at the end of a twelve-hour shift. Manual logs typically capture only 60 to 70 percent of actual downtime, because a thirty-second jam on the finishing line or a two-minute sensor fault on the caster gets reset and forgotten before anyone reaches for a pen. Multiply that gap across three shifts, six weeks, and forty machines, and the number on the plant manager's dashboard stops meaning anything close to what actually happened on the floor. Auto-capture removes the pen entirely: the PLC already knows when a line stopped, how long it ran below rated speed, and how many parts came off the end, and OxMaint reads that signal directly into work orders and OEE calculations without an operator touching a keyboard.
Zero Manual Entry
Stop Trusting OEE Numbers Built From Memory
OxMaint pulls downtime signals, cycle counts, and quality data straight from your PLCs and historian — no shift-end spreadsheet, no operator recall bias, no missed micro-stops.
Why OEE Falls Apart at the Point of Entry
OEE is built from three numbers — Availability, Performance, and Quality — and manual entry corrupts all three in different ways before the math even starts. Availability suffers because operators log the stoppages they remember and round the ones they don't, so a caster that actually stopped nine times in a shift shows up as four. Performance suffers because "running" and "running at rated speed" look identical on a paper log — a mill limping along at sixty percent of line speed gets recorded the same as one running flat out, which hides the single biggest source of lost tonnage in most steel operations. Quality suffers because scrap and rework get tallied at the end of the shift from memory or from a paper tag pile, long after the coil that caused it has already moved three stations down the line. None of these are operator failures — they're the predictable result of asking a person to do a machine's job with a clipboard. A rolling mill operator managing coil changes, gauge alarms, and a dozen other priorities in real time simply cannot also be a precise, unbiased data logger every ninety seconds, and no amount of training or discipline changes that math. The fix isn't a better form or a stricter policy — it's removing the step where a human has to notice, remember, and transcribe something a sensor already recorded automatically the moment it happened.
A
Availability
Manual logs miss stops under five minutes almost entirely. PLC state signals capture every stop, down to the second, with no threshold to hide behind.
P
Performance
Paper can't distinguish full speed from reduced speed. Encoder and cycle-count data flags every minute a line runs below rated throughput.
Q
Quality
End-of-shift scrap tallies lose the connection to the exact heat or coil. Inline quality signals tag defects to the asset and moment they occurred.
The Losses Manual Tracking Never Sees
Twenty thirty-second stops in an hour add up to ten minutes of lost production — a full sixth of that hour gone — and almost none of it shows up on a paper log, because no operator is going to write down twenty separate entries between coils. These are the Six Big Losses framework's minor stoppages and speed losses, and across steel plants they are consistently the largest and least visible category of OEE loss. The bars below show where the gap between what gets logged and what actually happens tends to be widest — and it's not the dramatic two-hour breakdown that gets missed, since everyone notices and documents that one. It's the quiet, repetitive interruptions that blend into the background of a normal shift, the ones a supervisor would describe as "the line runs like that sometimes" without ever quantifying how much tonnage that pattern is actually costing over a month.
Approximate share of each loss category left out of shift-end manual logs across comparable steel operations. Long stoppages get written down; everything shorter and quieter usually doesn't.
What Auto-Capture Actually Pulls Off the Floor
Auto-capture is not one data feed — it's four, and a plant only gets a trustworthy OEE number when all four are wired in and reconciled against each other. Cycle counts alone tell you throughput but not why it dropped. PLC fault codes alone tell you a stop happened but not how it affected quality downstream. The value shows up when the four sources are stitched into a single event, timestamped once, and tagged to one asset — not four separate reports that a supervisor has to mentally cross-reference at the end of the week, which is effectively how most plants operate today even after they've installed the sensors to do better.
PLC State and Fault Signals
Run, idle, down, and fault states read directly off the controller over OPC-UA, Modbus, or S7, capturing every stoppage regardless of duration and eliminating the five-minute threshold that hides micro-stops on paper logs.
Encoder and Cycle-Count Data
Actual line speed and part counts pulled straight from encoders and counters flag reduced-speed running the moment it starts, instead of an operator estimating throughput at the end of a shift.
Inline Quality and Scrap Signals
Gauge, camera, and sensor readings tag a defect to the exact coil, heat, or blank the instant it's detected, so scrap gets attributed to the right cause instead of a shift-end guess made from a pile of rejects.
Historian Timestamp Reconciliation
All three streams are matched to a single clock so a downtime event, the speed drop before it, and the scrap it caused show up as one connected story instead of three disconnected numbers on three different reports.
What Accurate Data Actually Changes on the Floor
An accurate OEE number is not the point — it's the input to every decision that follows it, and that's where auto-capture pays for itself well beyond the dashboard. Maintenance planning stops being reactive once fault codes are tied to real frequency counts instead of a supervisor's recollection of "that thing keeps happening." A hydraulic fault that fires eleven times a week looks very different from one that fires twice a month, and only automatic capture tells the two apart reliably. Quality teams stop chasing scrap after the fact once a defect is tagged to the exact coil and process step that caused it, which turns a monthly scrap review from a guessing exercise into a targeted fix. Production scheduling improves once planners can see which lines are genuinely reliable at rated speed versus which ones are technically "up" but running slow, a distinction that never shows up on a simple uptime percentage. None of this requires a new team or a new reporting cadence — it requires the same OEE number the plant already tracks to finally be built from what happened, not from what someone had time to write down. Plants that make this switch tend to describe the same arc: a rough first month of confronting a lower, more honest number, followed by several quarters of steady, measurable gains as the same fault codes, speed patterns, and defect sources get worked down one at a time instead of staying buried in a spreadsheet nobody had time to fully reconcile.
M
Maintenance
Fault frequency by asset replaces gut-feel prioritization, so the worst-offending equipment gets attention first, backed by a real count instead of a hunch.
Q
Quality
Defects trace back to the coil, heat, or blank that produced them, turning a monthly scrap report into a specific, fixable root cause.
S
Scheduling
Planners see which lines actually run at rated speed versus which ones are "up" but slow, and schedule orders against real capacity, not nameplate capacity.
Built for Steel Assets
Connect Your PLCs, Encoders, and Quality Sensors in One Place
OxMaint reconciles downtime, speed, and scrap data into a single OEE number your maintenance and production teams can both trust — and turns every fault signal into a work order automatically.
The Week Your OEE Number Gets Worse — On Purpose
Almost every plant that switches from manual to automatic OEE capture sees the number drop, often by fifteen to twenty percentage points, in the first one to two weeks. This is not the process getting worse. It is measurement becoming honest for the first time. Manually reported OEE runs systematically eight to twelve points higher than the automated figure, because every missed micro-stop and every reduced-speed run that never made it onto a clipboard was quietly padding the old number. Plants that don't expect this drop often panic and question the new system instead of the old one — but the drop is the single strongest signal that auto-capture is working. What comes with it is usually more valuable than the number itself: a small handful of fault codes, sometimes as few as four, frequently turn out to be responsible for the large majority of total stoppages, a pattern that was completely invisible when downtime was being reconstructed from memory at the end of a shift and averaged across a month in a spreadsheet nobody had time to double-check. Once that pattern is visible, engineering teams stop guessing at root cause and start fixing the two or three things actually driving the loss.
The temptation after seeing that first drop is to treat it as a one-time correction and move on, but the more useful habit is to keep watching the gap between what the plant assumed and what the sensors report. Steel lines drift — a bearing that was fine in January is not the same bearing in July, and a reduced-speed pattern that shows up only on the night shift tells you something about staffing or handoffs that a monthly average will never surface. Plants that treat the accurate baseline as a starting point rather than a finish line consistently find a second and third round of hidden loss in the months after the initial rollout, simply because the data keeps talking even after the first obvious fixes are made, and each round tends to be a little smaller and a little less obvious than the last, which is exactly why it stayed hidden for so long in the first place.
Our OEE dropped eighteen points the week we turned on auto-capture, and for about three days everyone assumed the sensors were wrong. They weren't. We'd been running at reduced speed on the pickling line for two years and nobody wrote it down because it never technically stopped.
Plant Operations Manager — Integrated steel producer, cold rolling division
Frequently Asked Questions
Does auto-capture eliminate the need for operators to log anything?
No. Machines detect that a stop happened and how long it lasted; operators still assign the reason code when the cause isn't obvious from the signal alone, which keeps the human judgment where it's actually useful. See how OxMaint splits detection and classification without adding data-entry burden.
Why would our OEE number go down after switching to auto-capture?
Because the old number was inflated by every micro-stop and speed loss that never got written down. The drop reflects more accurate measurement, not worse production performance.
What signals does OxMaint actually need from our floor?
PLC run/idle/down states, encoder or cycle-count data, and any inline quality or scrap sensor output, typically over OPC-UA, Modbus, or an existing historian connection — no new hardware in most steel plants.
How does auto-captured downtime turn into a maintenance work order?
A qualifying fault signal opens a work order automatically, tagged to the asset and timestamped to the second, so maintenance is dispatched before an operator would have finished writing the event down manually.
Is this only useful for large integrated mills?
No. Any line with a PLC and a counter benefits, since the accuracy gap between manual and automatic capture exists at any scale, from a single finishing line to a full integrated mill. Book a demo to see it against your own line data.
See Your Real Number
Find Out What Your OEE Actually Is — Not What the Logbook Says
OxMaint auto-captures downtime, speed, and quality data straight from your PLCs and turns every loss into a traceable, actionable work order.