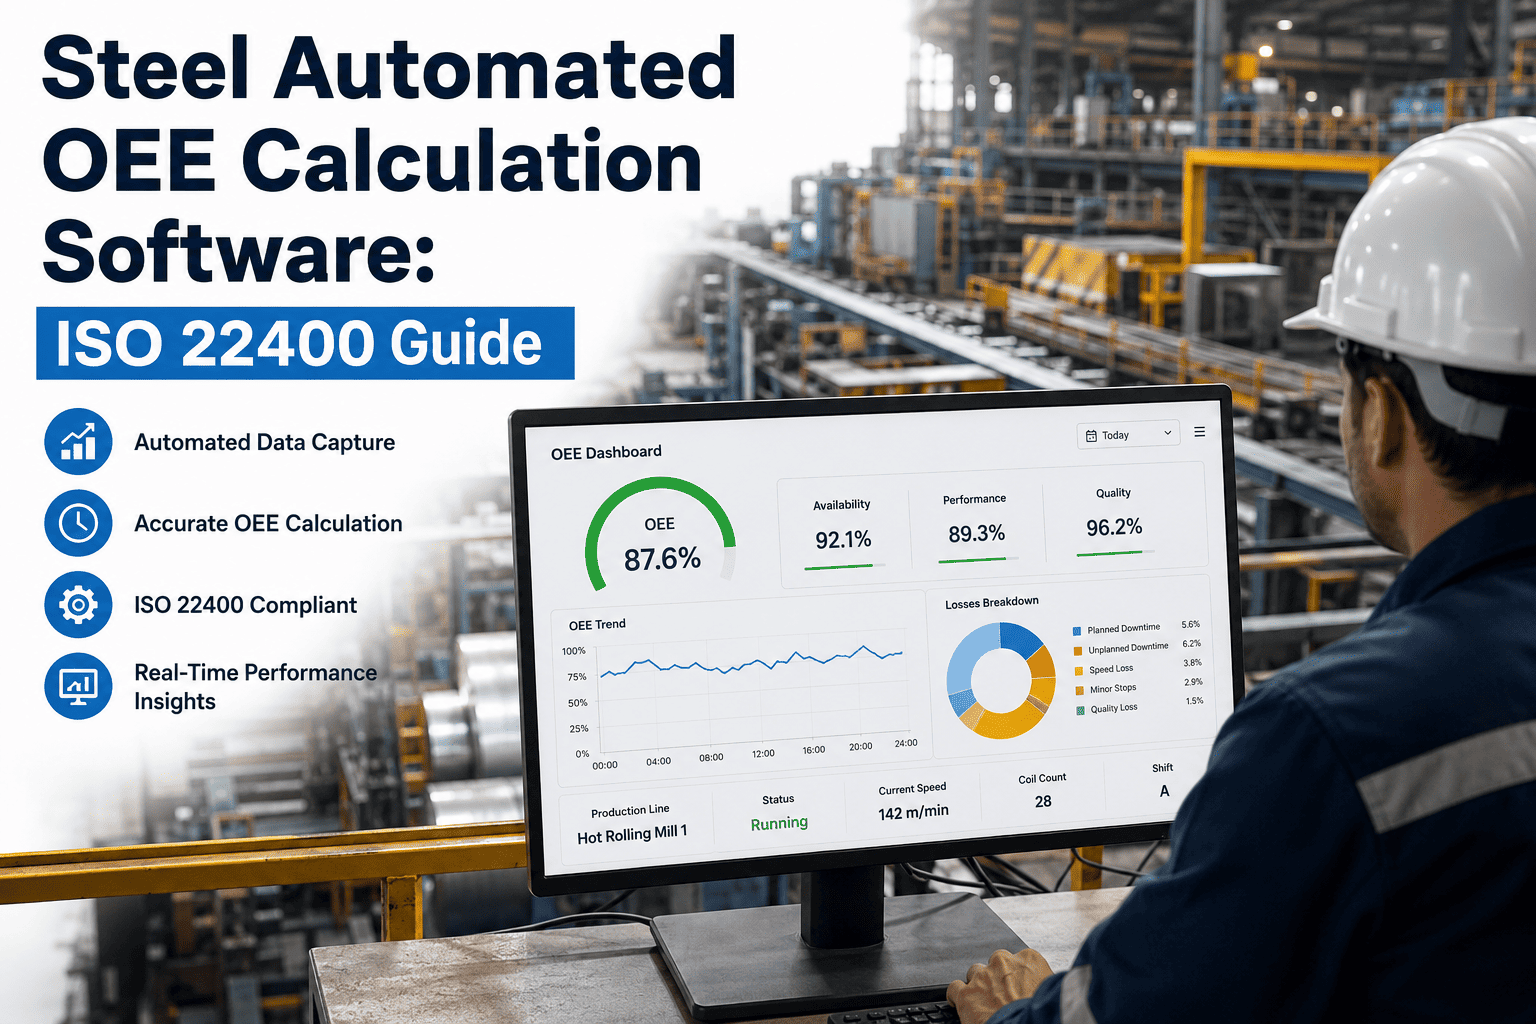
A rolling mill supervisor in Indiana checks OEE once a shift, usually from a whiteboard tally that mixes the outgoing crew's rough guess at downtime with a hand count of rejected coils. The mill has reported roughly 71% OEE for eighteen straight months, a number nobody has recalculated and nobody could defend if a customer or an insurer asked how it was built. Somewhere in that gap sits the real figure, sitting in PLC signals nobody is reading and reject counts nobody is logging against the shift that produced them. Most steel plants that move from a whiteboard tally to an automated, ISO 22400-aligned calculation find their true Availability figure sitting six to nine points below the estimate, because unlogged micro-stops never make it into a manual count. OxMaint's OEE engine pulls Availability, Performance, and Quality straight from PLC and MES signals and scores every line the same way, every shift, without a spreadsheet in between — you can see how it maps to your own lines at app.oxmaint.ai.
Automate ISO 22400-Aligned OEE Before Your Next Shift Report
Availability, Performance, and Quality calculated straight from PLC signals — no whiteboard, no spreadsheet reconciliation, no argument between plants about whose formula is right.
65%
Typical industry-median OEE across steel production lines still using manual or partial tracking
34
Standardized KPIs defined under ISO 22400-2, with OEE built from three of its core component ratios
8-14pt
Typical OEE improvement steel lines see within the first year once losses are attributed automatically instead of estimated
The Three Components ISO 22400 Actually Measures
OEE looks like one number on a dashboard, but ISO 22400-2 defines it as three separate ratios multiplied together, and each ratio points to a different department. A line stuck at 80% OEE because of a weak Availability score has a maintenance and changeover problem. The same 80% driven by a weak Performance score has a line-speed and scheduling problem. Driven by weak Quality, it has a process-control and raw-material problem. A single blended number hides which of the three is actually dragging the line down, which is exactly why the standard insists on reporting them separately rather than collapsing them into one score too early. Configure your own thresholds for each component at app.oxmaint.ai.
Availability
Operating Time ÷ Planned Production Time
Measures every minute lost to breakdowns, changeovers, and unplanned stops against the time the line was scheduled to run. In steel plants this is usually where the biggest single loss hides, because short stops under the reporting threshold never get logged manually.
Performance
Actual Output ÷ Theoretical Output at Standard Speed
Compares real throughput against the ideal cycle time engineering specified for that product and pass schedule. Reduced-speed running, minor jams, and setpoint drift all show up here before they ever become a stoppage worth writing on a whiteboard.
Quality
Conforming Output ÷ Total Output
Tracks the share of coil, billet, or bar that meets specification on the first pass, separating scrap and rework from good product. A drop here usually traces back to raw-material variation or a process parameter that drifted mid-shift.
Stop Debating Whose OEE Number Is Right
OxMaint calculates Availability, Performance, and Quality against the same ISO 22400-2 time-state model on every line, every shift, so a number from your hot mill means the same thing as a number from your cold mill.
From PLC Signal to ISO 22400 KPI — How the Automation Works
Automated OEE calculation is not a dashboard bolted onto your existing spreadsheet — it replaces the spreadsheet's reasoning entirely. The pipeline below shows how a raw PLC signal becomes a defensible, standard-aligned number your operations team can act on inside the same shift instead of the following morning.
Step 1
Signal Capture
Run status, speed, and reject counts are read directly from PLC and MES tags per line, timestamped to the second and linked to the active work order automatically.
Step 2
Time-State Mapping
Every minute is classified as Planned Busy Time, Operating Time, or a named loss category, following the ISO 22400 time-state model so changeovers and cleaning are never miscounted as breakdowns.
Step 3
Component Calculation
Availability, Performance, and Quality are computed from the mapped time-states and production counts, then multiplied to produce OEE for the shift, the line, and the product grade.
Step 4
Loss Attribution
Every point lost from 100% OEE is tagged to a named cause — a specific downtime code, a speed deviation, or a scrap reason — so the top loss driver is visible without a root-cause meeting.
Step 5
Dashboard and Alert
Supervisors see the live number and the trend through the shift, and a threshold breach on any component triggers an alert before the shift ends, not after the report is filed the next day.
Steel OEE Benchmarks by Line Type
Where a line sits against these figures usually decides which loss category to attack first. These benchmarks reflect typical ranges reported across steel production lines and should be adjusted for your own product mix, alloy grade, and line configuration.
Line Type
Median OEE
Top Quartile OEE
Biggest Loss Driver
Primary ISO KPI
Hot Strip Mill
63%
84%
Roll-change downtime
Availability
Cold Rolling Line
67%
86%
Speed loss on gauge change
Performance
Galvanizing Line
61%
82%
Coating rejects
Quality
Billet Caster
68%
87%
Ladle changeover
Availability
Bar and Rod Mill
64%
85%
Minor jams and threading
Performance
What Automated OEE Does to Your Numbers
The value of automating OEE calculation is not a prettier chart — it is that Availability, Performance, and Quality stop being estimates and start being audit-ready facts your operations team, your corporate office, and your insurer can all trust equally.
Availability Gains
Micro-stops recovered into visibility
4-7 pts
Time to first accurate baseline
One shift
Changeover reduction with SMED targeting
15-25%
Performance Gains
Speed-loss events surfaced per shift
Real-time
Setpoint drift caught before scrap
Same shift
Typical throughput recovery
3-6%
Quality Gains
Reject reason logged per event
Automatic
First-pass yield improvement
2-5 pts
Time to trace scrap to root cause
Minutes, not days
We used to argue in the Monday meeting about whose mill had the real number. Once every line calculated OEE the same way against the same time-state model, the argument disappeared and the conversation moved to what was actually causing the loss.
— Operations Manager, integrated steel producer, Midwest US
Frequently Asked Questions
Does ISO 22400 define one official OEE formula every plant must use?
No. The standard defines a common time-state model and vocabulary for Availability, Performance, and Quality so results are comparable, but exact loss categories still need configuring for your plant. OxMaint ships with a steel-specific starting map you can adjust at
app.oxmaint.ai.
What data does OxMaint need to start calculating OEE automatically?
Run status, speed, and reject count signals from your existing PLC or MES tags are enough to start. No new sensors or line hardware are required for most steel lines already running basic automation.
How is a manually tracked OEE number usually wrong?
Manual tallies miss short stops below the reporting threshold and round output and reject counts, which typically inflates Availability and hides the real Quality loss. Automated calculation removes both sources of error.
Can OxMaint separate OEE by product grade on the same line?
Yes — OEE, and each of its three components, can be filtered by work order, product grade, or shift so a Performance dip tied to one alloy does not get blended into the line-wide average.
How fast can a steel plant see its first ISO 22400-aligned OEE number?
Most plants with existing PLC connectivity see their first automated Availability, Performance, and Quality numbers within days of setup. A
demo call can walk through your specific tag list before you commit to anything.
Calculate OEE the ISO 22400 Way — Starting Today
Every line, every shift, one shared definition of Availability, Performance, and Quality — built for steel plants that are tired of arguing about the number instead of fixing the loss.
34
ISO 22400 KPIs supported
8-14pt
typical first-year OEE gain