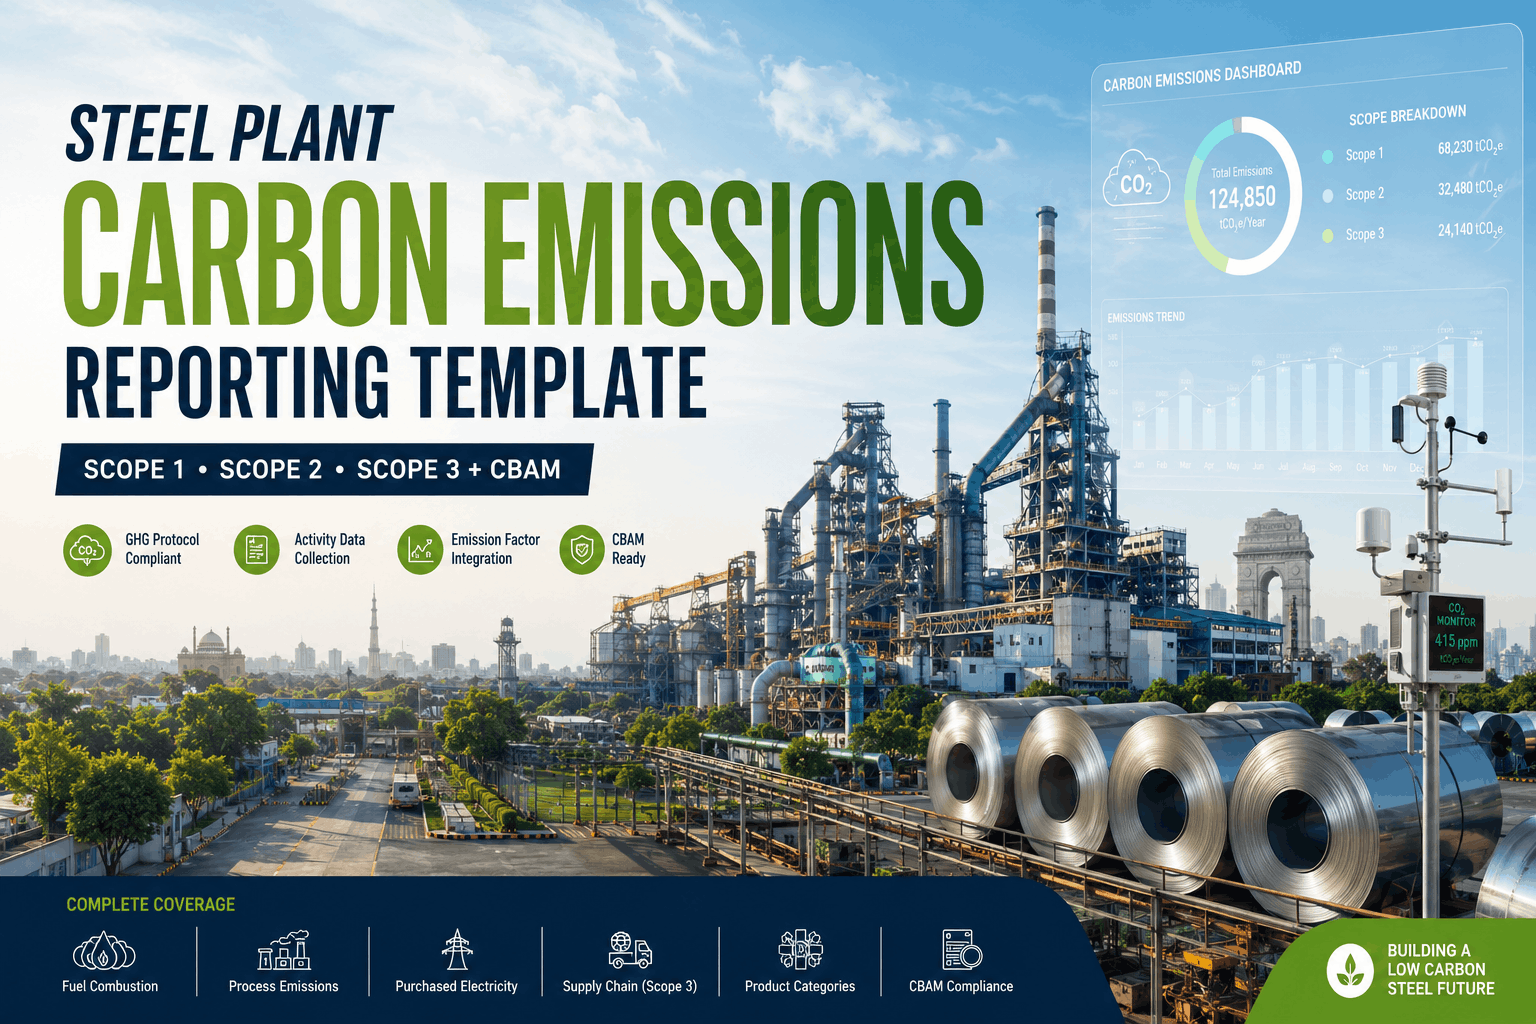
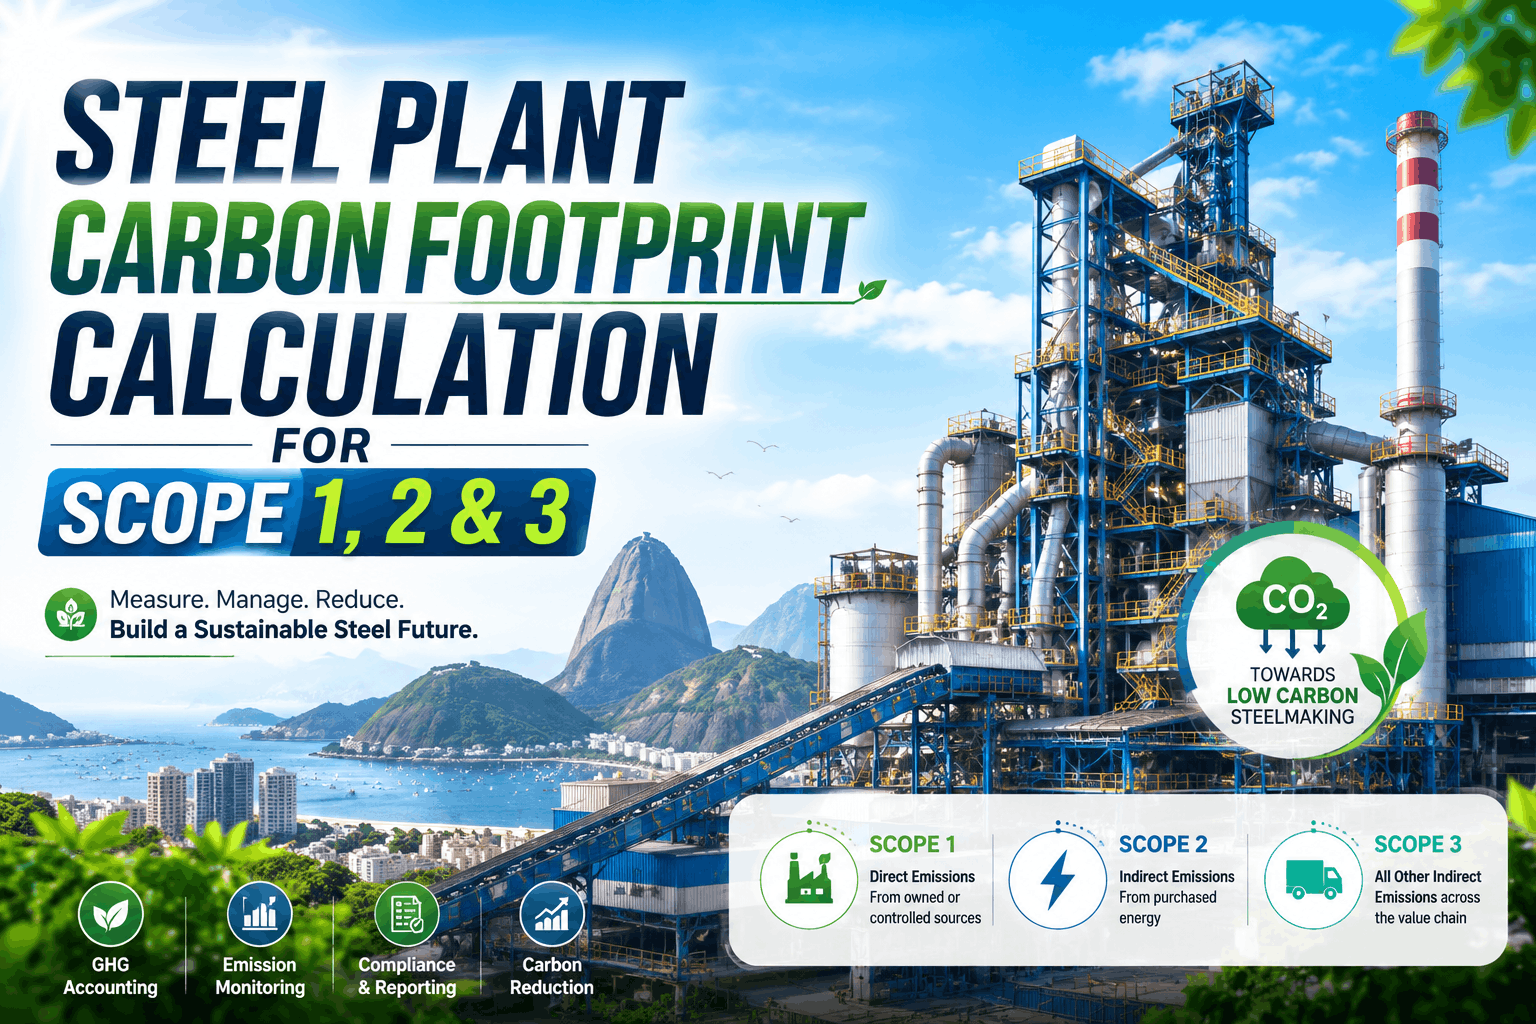
Steel plants emit roughly 1.85 tonnes of CO2 for every tonne of steel produced — making the industry responsible for 7–9% of global carbon output. Yet most facilities still track emissions through disconnected spreadsheets, manual meter reads, and quarterly estimates that bear little resemblance to what the furnace, rolling mill, and coke battery are actually emitting on any given shift. When your ESG report goes to auditors, investors, or regulators, those gaps become liabilities. Sign up for Oxmaint to connect real furnace and energy data to audit-ready ESG reporting — automatically.
Why Steel Plant ESG Reports Keep Failing Investor and Regulatory Scrutiny
Most steel plants generate emissions data in silos — furnace teams track energy one way, environmental teams log gas readings another way, and procurement keeps supply chain data in a completely separate system. The result is an ESG report assembled from mismatched sources, riddled with estimation errors, and impossible to audit at the asset level. Investors now demand Scope 1, 2, and 3 transparency tied to actual operational data. Start tracking your emissions in Oxmaint and generate reports directly from your CMMS work order and energy records.
Most steel plants estimate 63% or more of their reported emissions from fuel consumption ratios rather than direct measurement at the source — creating material misstatements that regulators are starting to penalize.
Steel producers with no CMMS integration consistently underreport Scope 3 emissions from raw material procurement, logistics, and downstream processing by 5 to 12 times actual — a gap that destroys ESG credibility.
The average mid-size steel plant spends 280 hours per year manually compiling ESG data from spreadsheets, maintenance logs, and meter records — before a single report is written or reviewed.
Scope 1, 2 & 3 Carbon Tracking Checklist for Steel Plants
Use this checklist to audit which emission sources your CMMS is currently capturing — and which are creating blind spots in your ESG reports. Each section maps to actual steel plant assets and processes with direct impact on reported emissions totals.
These are the highest-volume direct emissions in any integrated steel plant. Blast furnace gas, coke oven gas, and natural gas combustion in reheating furnaces account for 70–80% of total Scope 1 output. Every maintenance event on these assets affects emissions figures.
-
Blast Furnace Gas Combustion Log gas flow rates, temperature setpoints, and combustion efficiency per shift. Link to PM work orders on stoves and blowers. -
Coke Oven Battery Emissions Track pushing, quenching, and charging events. Each operation generates measurable CO2 and methane that must be logged per oven ID. -
Reheating Furnace Natural Gas Log fuel consumption per furnace per heat cycle. Burner PM records directly correlate with combustion efficiency and reported emissions. -
Ladle & Tundish Preheating These often-overlooked burner systems contribute 3–5% of total Scope 1. Attach gas meter readings to work orders.
Steel making releases CO2 through chemical reactions independent of fuel burning — primarily limestone calcination in the blast furnace and basic oxygen converter. These process emissions must be tracked separately and cannot be reduced by switching fuel sources alone.
-
Limestone & Flux Calcination Log limestone charge weights per heat. The CO2 release from CaCO3 decomposition is calculable and must appear in Scope 1 reporting. -
BOF / EAF Steelmaking Reactions Carbon content of hot metal and scrap charge directly determines process CO2. Link heat records to each cast. -
Sinter Plant Coke Combustion Sinter strand fuel rate and bed depth data generate directly reportable process emissions. Attach to maintenance records per strand ID.
Electric arc furnaces and auxiliary systems consume enormous grid electricity — EAF plants can have 80–90% of emissions classified as Scope 2. Market-based and location-based reporting methods produce dramatically different totals, so asset-level meter data is essential for both calculations.
-
Electric Arc Furnace Power Consumption Log kWh per heat, electrode consumption, and transformer load. Link energy records to each work order for full lifecycle traceability. -
Rolling Mill & Auxiliary Drive Energy Sub-meter drive systems individually. Poorly maintained rolling equipment uses 15–25% more energy — a direct emissions penalty. -
Compressed Air & Cooling Systems Compressed air leaks and cooling tower pump inefficiency are common hidden Scope 2 sources — log findings during preventive maintenance rounds.
Scope 3 is now mandatory under the EU CSRD and increasingly required by major steel buyers. Iron ore mining, coking coal transportation, limestone quarrying, and downstream steel fabrication all generate attributable emissions that investors and customers are demanding steel mills quantify and disclose. Sign up to connect procurement and logistics data to your ESG dashboard.
-
Raw Material Procurement Emissions Log supplier emission factors for iron ore, coking coal, scrap, and alloys. Attach to purchase order records for per-heat attribution. -
Inbound Logistics Distance, transport mode, and cargo weight for each material shipment generate attributable transport emissions — link to supplier records. -
Downstream Customer Processing Steel sold to automotive, construction, and fabrication customers carries downstream processing emissions. Document product carbon intensity per grade. -
Waste & Slag Disposal Steel slag, dust, and sludge transported to landfill or processing sites generate transport and processing emissions requiring documentation.
An accurate emissions inventory is only valuable if it can be packaged into GHG Protocol-compliant, audit-ready ESG disclosures. This section covers the reporting controls that convert your CMMS data into investor-grade carbon transparency documentation.
-
Emission Factor Library Maintenance Maintain current IPCC, IEA, and regional grid emission factors within the CMMS. Expired factors are a primary source of ESG audit findings. -
Boundary Definition Documentation Equity share vs. operational control boundary selection must be documented and consistently applied across all reporting periods. -
Third-Party Verification Data Package Assemble verifier-ready evidence: meter calibration records, work order timestamps, fuel delivery invoices, and production logs — all linked in the CMMS.
Steel producers committing to SBTi targets or Paris Agreement pathways must show measurable annual progress — not just disclose current emissions. CMMS data forms the operational backbone for tracking carbon intensity per tonne against reduction targets. Book a demo to see how Oxmaint tracks your decarbonization KPIs in real time.
-
Carbon Intensity KPI Dashboard Track tCO2e per tonne of steel month-over-month. Link intensity trends to specific maintenance actions and operational changes. -
Green Investment Project Tracking Log hydrogen injection trials, EAF upgrades, and waste heat recovery installations as separate project records with emissions impact measurement. -
Annual Target vs. Actual Variance Generate automated variance reports comparing actual emissions to SBTi or internal reduction targets — with drilldown to specific facilities and assets.
Your CMMS is Already Your Most Powerful Carbon Reduction Tool
Poorly maintained combustion equipment runs 15–30% less efficiently than designed. Burner detuning, fouled heat exchangers, and steam leaks directly inflate the CO2 intensity of every tonne you produce. Plants that connect maintenance scheduling to emissions monitoring consistently outperform their decarbonization targets without major capital spend.
Spreadsheet-Based ESG Reporting vs. CMMS-Integrated Carbon Tracking
The difference between manual and CMMS-driven emissions reporting is not just efficiency — it is the difference between defensible data and estimated guesswork that fails investor and regulatory scrutiny.
Swipe horizontally to see full comparison
Stop Estimating. Start Reporting Actual Steel Plant Emissions.
Oxmaint connects your furnace records, energy meters, and work orders to produce GHG Protocol-compliant ESG disclosures — automatically. No spreadsheet assembly. No estimation gaps.
How Oxmaint Builds Your Steel Plant ESG Reporting Foundation
Every feature in Oxmaint's carbon tracking module is built around one principle: emissions data must trace back to an actual asset event, not an assumption. Create your account and connect your first furnace in under 30 minutes.
Real-Time Emissions Dashboard
View Scope 1, 2, and 3 emissions by asset, production area, or shift — updated in real time from CMMS sensor feeds and work order completions. Carbon intensity per tonne is calculated automatically against your production output.
Automated ESG Report Builder
Generate GRI, TCFD, and GHG Protocol-formatted reports directly from your CMMS data. Emission factors are maintained within the platform and applied automatically — no manual lookups or spreadsheet formulas required.
Maintenance-to-Emissions Correlation Engine
See exactly how burner PM deferrals, heat exchanger fouling, or combustion tuning events affect your reported emissions. Every work order closure is linked to its downstream carbon impact — so your maintenance team becomes part of the ESG strategy.
Audit-Ready Evidence Package
Third-party ESG assurance requires meter calibration certificates, inspection timestamps, and data lineage documentation. Oxmaint automatically assembles these into verifier-ready packages — cutting assurance preparation time from weeks to hours. Book a demo to see the audit package workflow.
What Steel Operations Leaders Are Saying
We were spending three months every year just compiling the data for our annual ESG submission. Half of it was estimated because we had no way to connect furnace records to emissions without manual transcription. The first time we ran Oxmaint's carbon report from actual CMMS data, we found our Scope 1 figures had been underreported by nearly 18% — and our blast furnace maintenance backlog was the primary driver. Fixing the PM schedule cut our reported intensity by 11% in one quarter.
Steel Plant Carbon Tracking — Frequently Asked Questions
Your Investors and Regulators Are Waiting for Defensible Steel Emissions Data
CBAM charges, investor ESG mandates, and SBTi commitments are converging on the steel industry at the same time. Oxmaint gives your plant the operational data foundation to meet all three — with carbon tracking built into your existing CMMS workflows, not bolted on as a separate compliance burden.