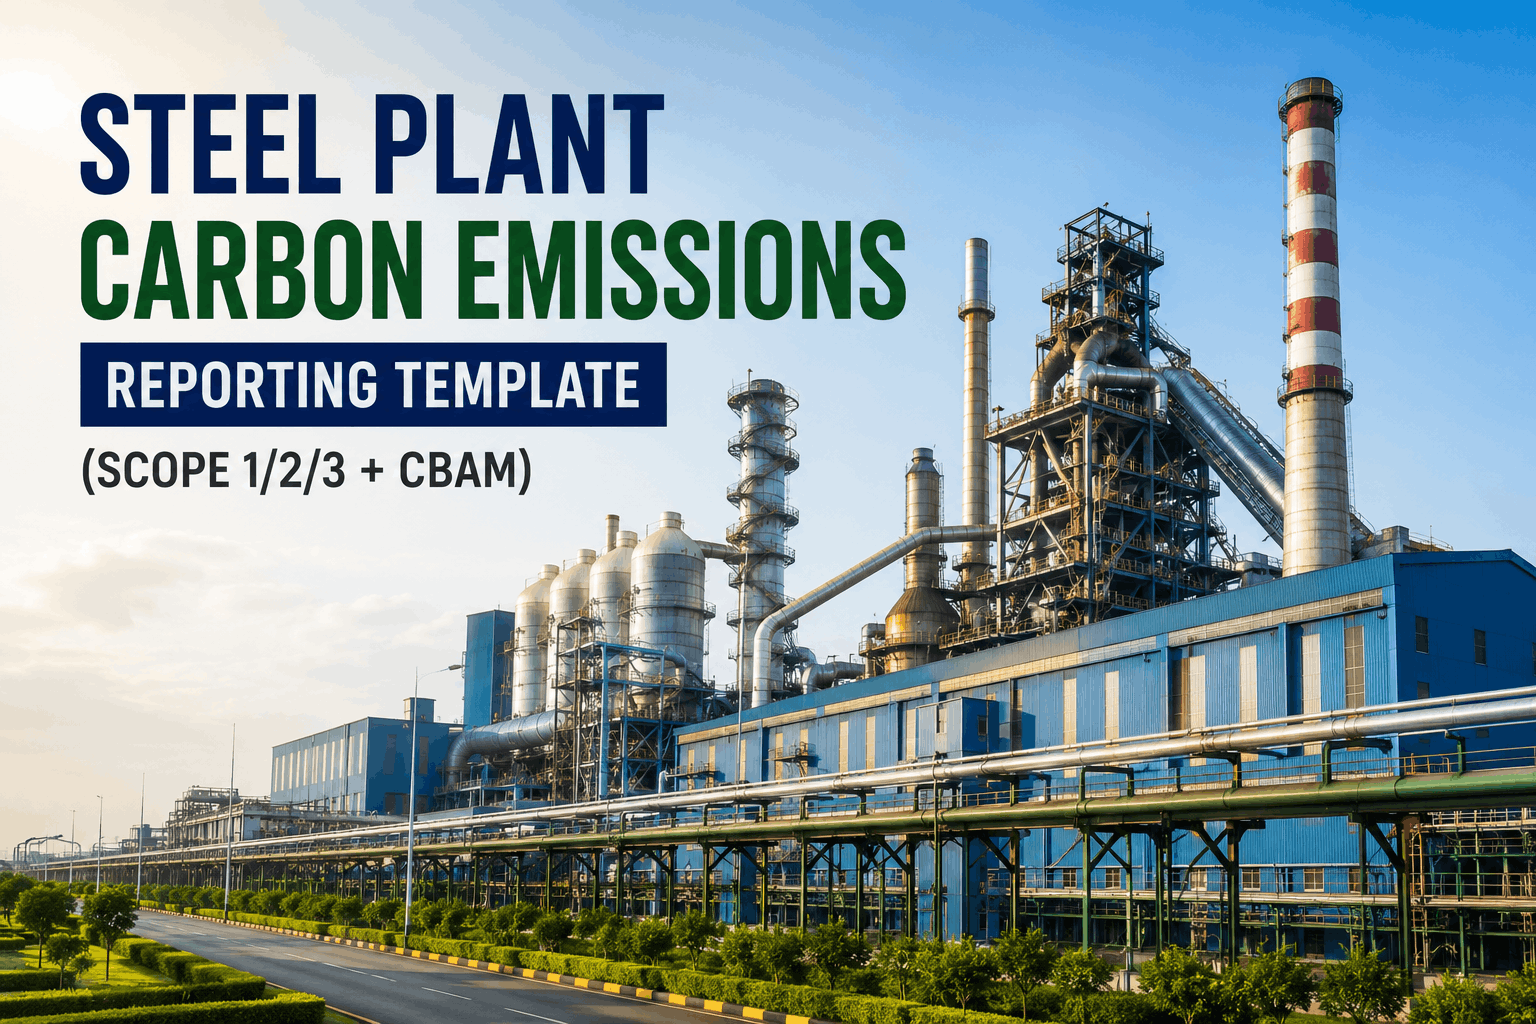
Steel Plant Carbon Footprint Calculation for Scope 1 2 and 3
By Alex Jordan on June 25, 2026
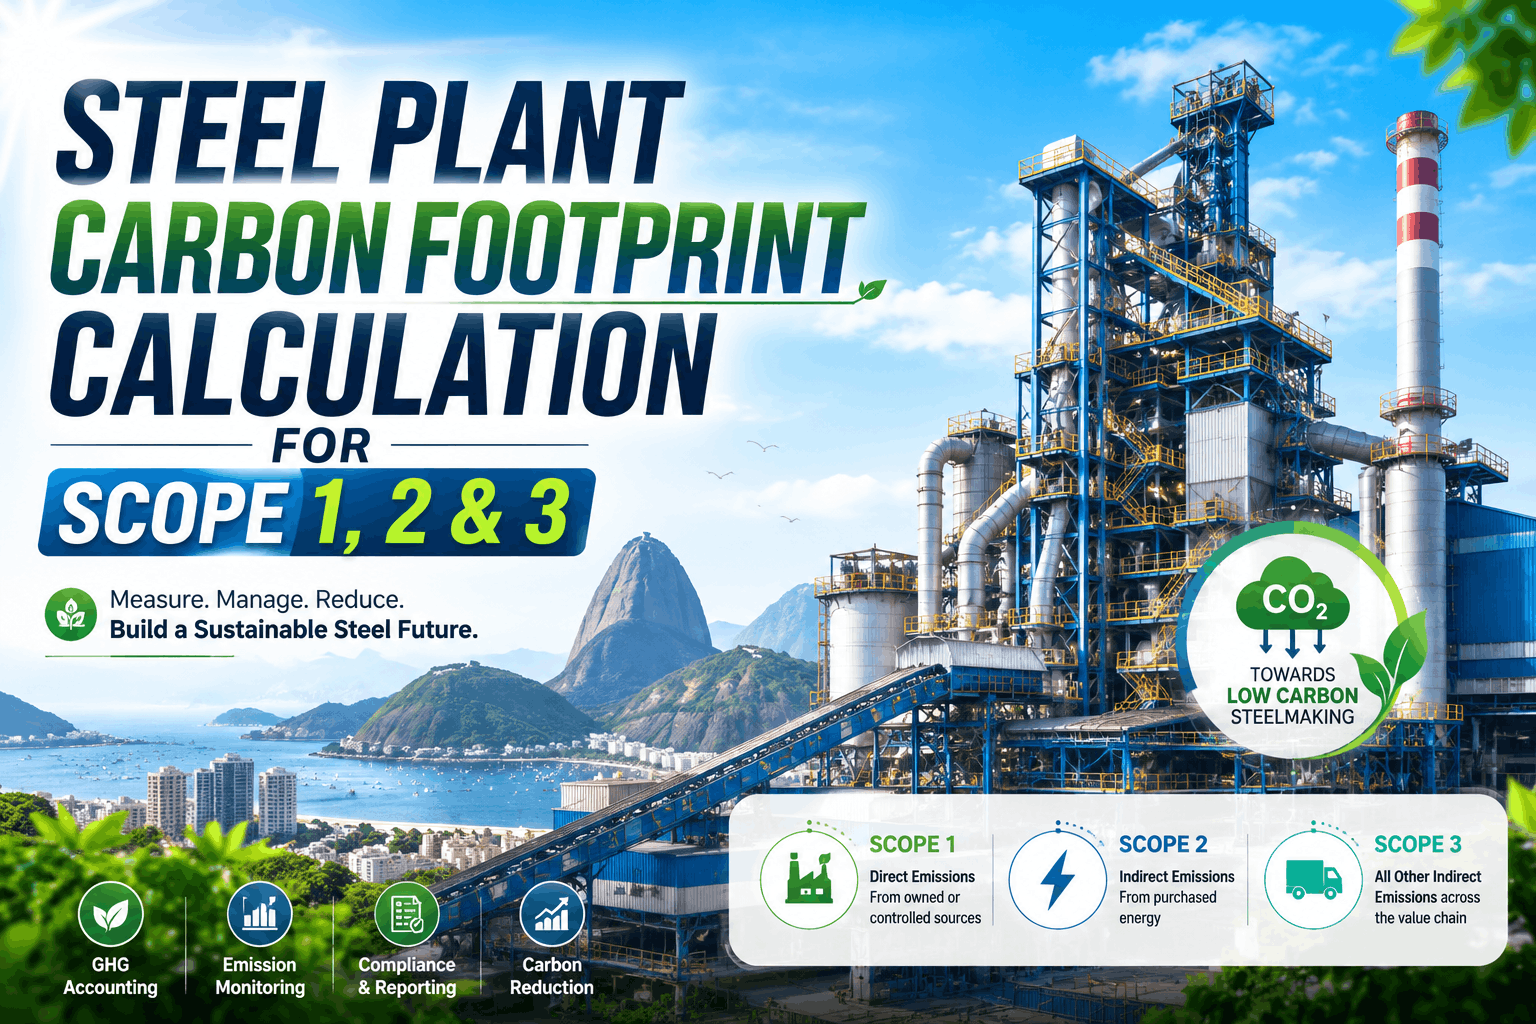
Steel plant carbon footprint calculation has become mandatory across North America, Europe, and increasingly in Asia-Pacific regions. The GHG Protocol divides steel emissions into three scopes: direct emissions from fuel combustion and process reactions (Scope 1), indirect emissions from purchased electricity (Scope 2), and supply chain emissions from raw materials to end-of-life treatment (Scope 3). A typical integrated steel plant producing 500,000 tonnes annually generates 800,000–1,200,000 tonnes of CO2 equivalent — with Scope 1 representing 70–75% of total emissions. OxMaint's Carbon Footprint Engine integrates activity data collection, emission factor management, and real-time calculation dashboards — converting production metrics into verified Scope 1, 2, and 3 carbon reports without manual spreadsheet reconciliation. Every ton of steel produced now requires certified carbon accounting for customer contracts, regulatory compliance, and sustainability reporting.
Measure and verify direct emissions from iron-making and steel-making, purchased electricity impacts, and supply chain carbon — building EPA-ready, GHG Protocol-compliant footprint reports with real-time monitoring dashboards and supplier carbon tracking.
70–75%Scope 1 emissions from fuel and process in steel production
15–20%Scope 2 indirect emissions from purchased electricity per plant
10–15%Scope 3 supply chain and transportation emissions
800K–1.2MAnnual CO2e for 500K-tonne integrated steel mill
Five Steel Plant Emission Sources — Scope 1, 2, and 3 Breakdown
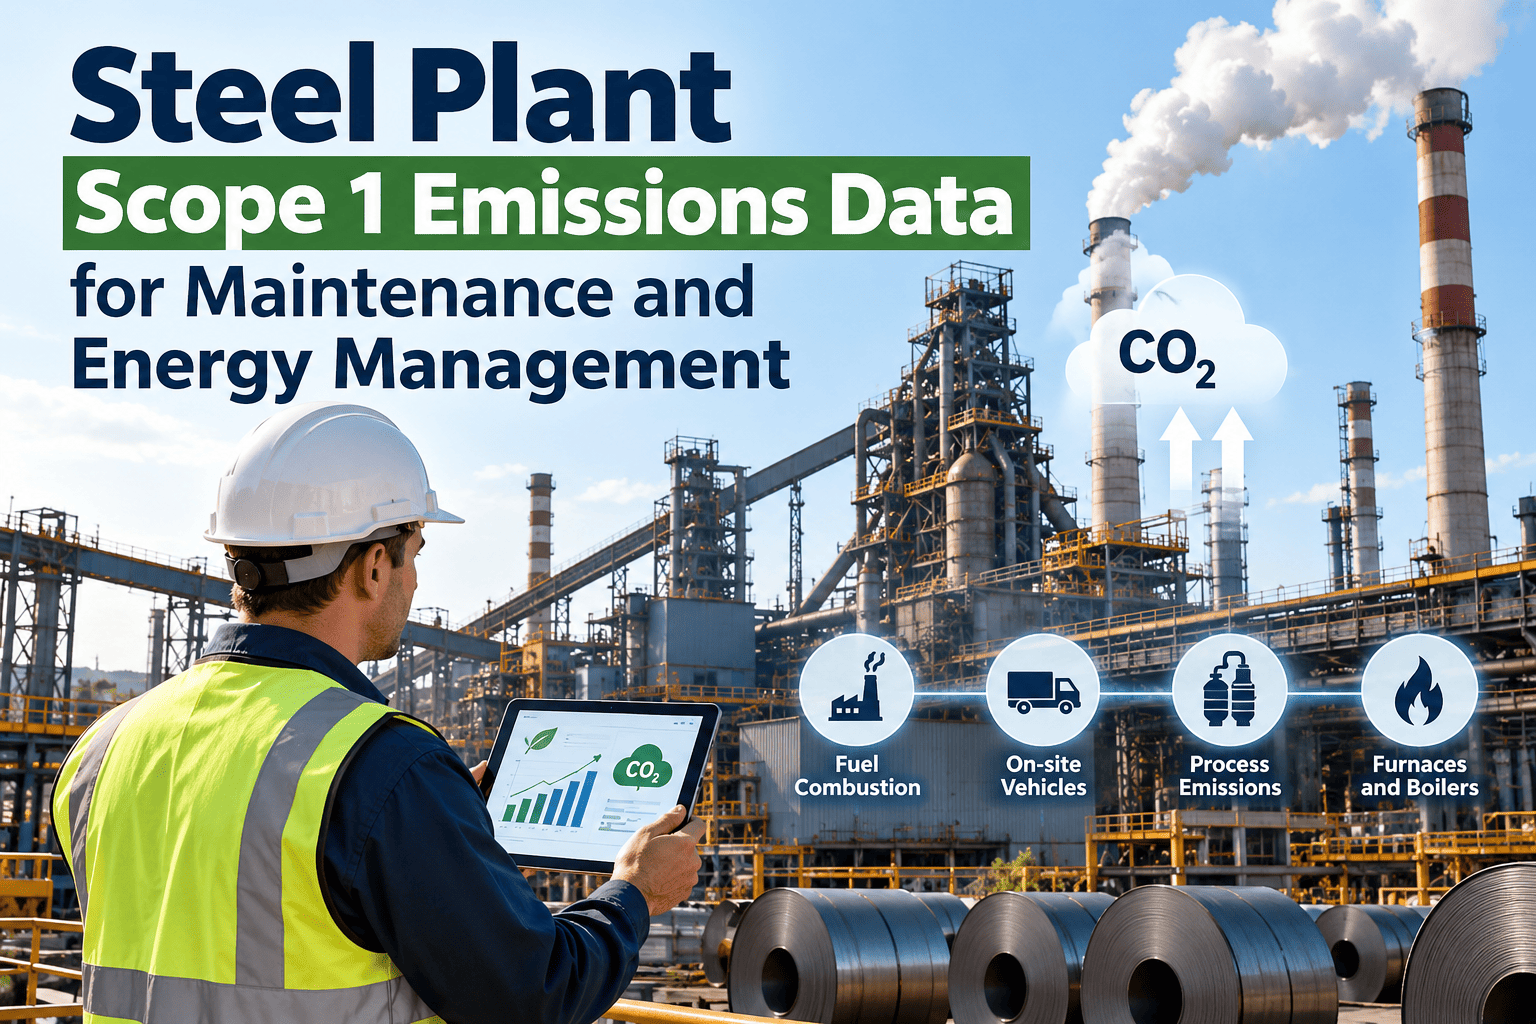
Steel manufacturing creates emissions across three distinct scopes. Scope 1 includes direct combustion of blast furnace coke, coke oven gas (COG), linz-donawitz gas (LDG), and natural gas — plus process emissions from limestone calcination and iron oxide reduction. Scope 2 captures purchased electricity used in electric arc furnaces, rolling mills, and facility operations. Scope 3 encompasses upstream emissions from iron ore mining and pelletization, coal and coke production, scrap steel sourcing, alloy manufacturing, transportation across the supply chain, product use in customer applications, and end-of-life recycling. OxMaint collects activity data at the process level — fuel consumption, electricity metering, steam generation, and waste streams — then applies GHG Protocol-certified emission factors to calculate verified footprints per tonne of steel produced.
Scope 1: Direct Combustion & Process Emissions (70–75% of total)
Blast Furnace Fuel Combustion
Coke combustion in BF for iron reduction — measured in kilograms of coke per tonne of hot metal produced. Emission factor: 3.1–3.4 kg CO2/kg coke burned.
Coke Oven Gas (COG) Combustion
By-product gas burned for heat in sintering, reheating furnaces. Volume measured in Nm³; emission factor: 1.87–2.05 kg CO2/Nm³ COG.
Limestone Calcination (Process Emissions)
Chemical decomposition of CaCO3 in BF slag — not combustion. Measured in tonnes limestone added. Emission factor: 0.44–0.48 kg CO2/kg limestone.
LDG & BOF Gas Combustion
Linz-Donawitz gas from steelmaking furnace combustion; BOF blowing air. Measured in Nm³. Emission factor: 1.65–1.85 kg CO2/Nm³.
EAF Natural Gas & Fuel Oil
Melting and reheating in electric arc furnaces; auxiliary fuel use. Measured in cubic meters or litres. Emission factor: 1.9–2.0 kg CO2/Nm³ gas, 2.65–2.75 kg CO2/litre oil.
Uncontrolled release of process gas during coke pushing and BF casting — typically 2–4% of total Scope 1. Measured by abatement system efficiency; emission factor: variable per source.
Scope 2: Purchased Electricity (15–20% of total)
EAF Melting Electricity
Direct electric arc furnace power consumption — typically 400–600 kWh per tonne of steel. Emission factor: 0.15–0.85 kg CO2/kWh depending on grid carbon intensity (coal-heavy vs. renewable-rich).
Rolling Mill Motors & Compressors
Continuous & reversing mill drives, air compressors, pumps. Annual consumption: 50–150 GWh per plant. Same emission factor as grid electricity.
Process Gas Cleaning & Fan Power
Bag filters, scrubbers, fans for emissions control equipment. Estimated 5–10% of total Scope 2 for a steel plant with modern abatement.
Steam & Hot Water Systems
Purchased steam from external providers; on-site boiler electricity. Assigned proportionally based on energy balance.
Scope 3: Supply Chain Emissions (10–15% of total)
Upstream: Iron Ore Mining & Pelletization
Extraction, crushing, agglomeration of iron ore pellets — 0.2–0.5 tonnes CO2 per tonne of pellets delivered to steel plant.
Upstream: Coal Mining & Coke Production
Mining, beneficiation, and coking of thermal coal — 0.8–1.2 tonnes CO2 per tonne of coke (includes process emissions from coking).
Upstream: Alloy & Scrap Sourcing
Production emissions from ferrochrome, ferromanganese, molybdenum suppliers; scrap collection and sorting. Varies 0.3–2.0 tonnes CO2 per tonne depending on alloy type.
Upstream: Transportation of Raw Materials
Rail, truck, and ship transport of ore, coal, scrap from suppliers — typically 0.05–0.15 tonnes CO2 per tonne of material delivered.
Downstream: Product Transportation & Logistics
Finished steel distribution to warehouses and customers; handling and repackaging. 0.02–0.10 tonnes CO2 per tonne depending on distance and mode.
End-of-Life: Recycling & Landfill
Remelting of scrap, landfill gas management, demolition energy. Typically 0.01–0.05 tonnes CO2 per tonne of product reaching end-of-life.
Carbon Footprint Calculation Methodology — Step-by-Step Process
Steel plant carbon accounting follows the GHG Protocol formula: Emissions = Activity Data × Emission Factor. Activity data includes measurable quantities (fuel consumed in kilograms, electricity in kilowatt-hours, raw materials in tonnes) collected from process instrumentation, energy meters, and material receipts. Emission factors are published by the EPA, IPCC, and industry-specific databases for each fuel type, process, and electricity grid region. The calculation workflow starts by establishing the organizational boundary — determining which facilities and processes are included in the footprint (equity share, operational control, or financial control). Next, activity data is collected at source: continuous monitoring of fuel flows into boilers and furnaces, electricity metering at the main distribution board, raw material weights at receiving, and supplier invoices for purchased goods. These data points are then multiplied by location-specific or fuel-specific emission factors. For Scope 1, factors vary by fuel type (coke vs. natural gas vs. heavy fuel oil). For Scope 2, factors change with electricity grid composition — a steel plant in coal-heavy regions may see 0.8 kg CO2/kWh, while renewable-rich grids report 0.2 kg CO2/kWh. Scope 3 calculations require supplier engagement to collect upstream emissions data or use industry benchmarks. Annual recalculation with improved data refines accuracy each year.
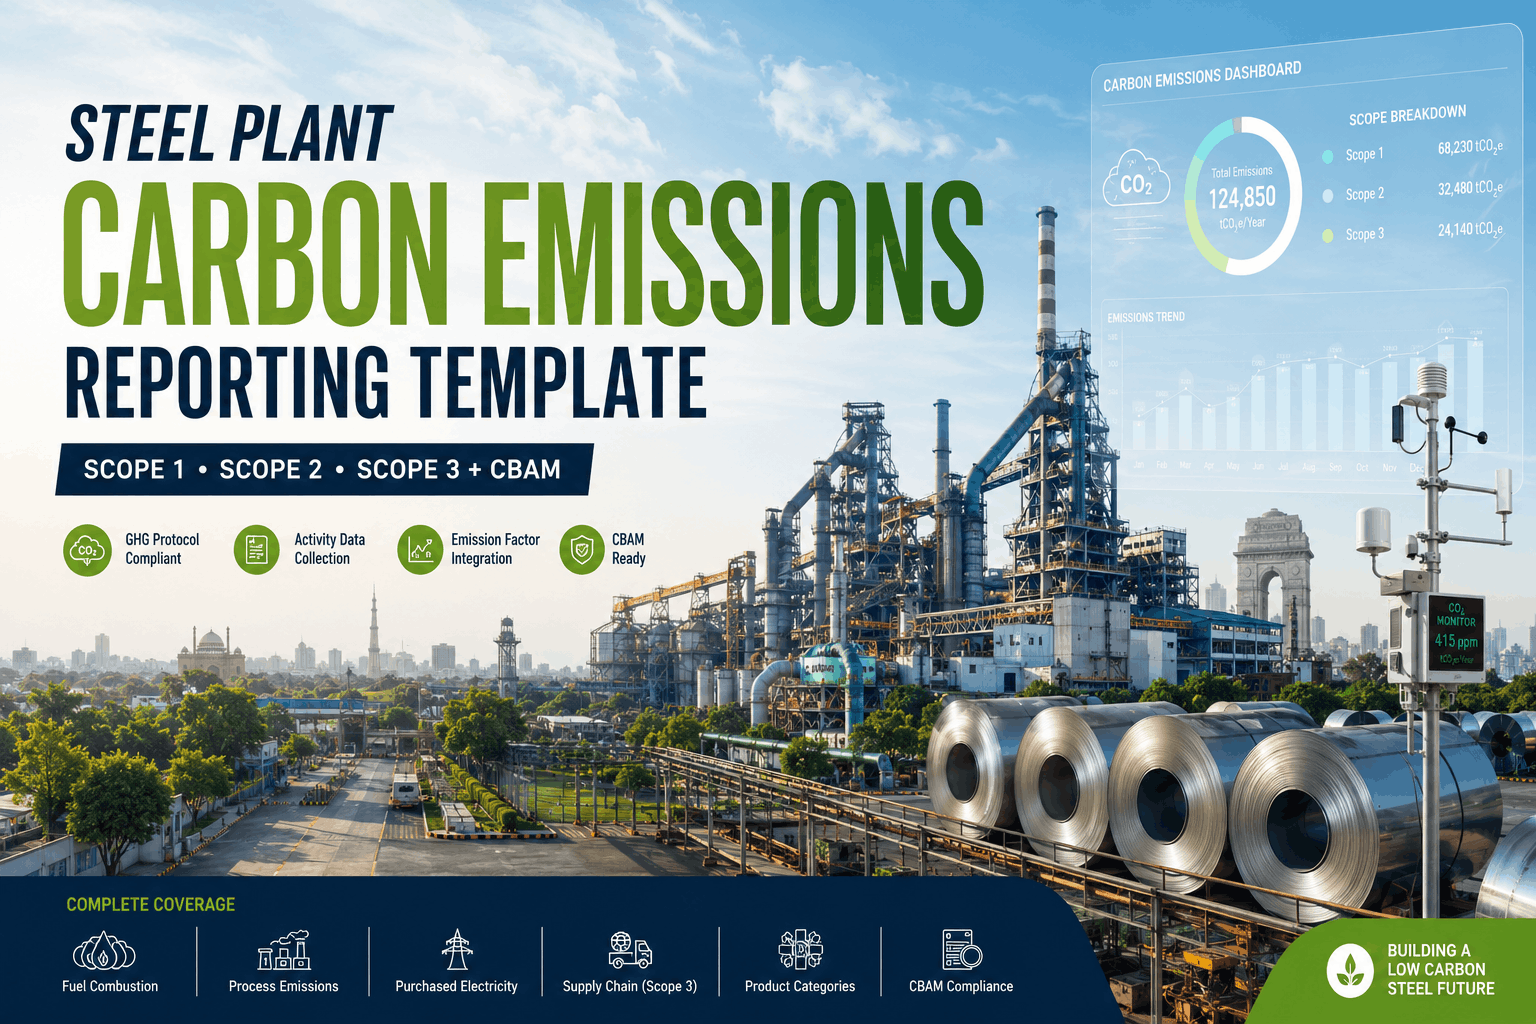
Manual spreadsheet-based carbon accounting creates data silos, transcription errors, and audit risk. Modern steel plants require software that connects directly to operational systems: energy management systems (EMS) for electricity metering, manufacturing execution systems (MES) for production metrics and raw material consumption, SCADA systems for fuel flow measurement, and supplier portals for Scope 3 emissions data. OxMaint's Carbon Footprint Engine integrates these data sources in real-time, applying GHG Protocol-certified emission factors, and generating compliance-ready reports for EPA, CDP, and Science Based Targets initiative (SBTi) submissions. The system maintains an audit trail of all activity data inputs, calculates annual and monthly footprints with variance analysis, and flags anomalies (a 20% spike in fuel consumption, an unexpected grid carbon intensity change) for investigation. For Scope 3, OxMaint includes a supplier engagement portal where raw material vendors submit carbon data — iron ore producers provide pellet production emissions, coal suppliers share mining and coking data, and transportation providers log distance and fuel mode. The platform then consolidates Scope 3 data, validates against benchmarks, and rolls it into the total plant footprint. Quarterly updates to emission factors (as grid carbon content changes or EPA revises methodology) are applied automatically across historical and forward-looking calculations.
Real-Time Activity Data Collection
Connect to EMS, MES, SCADA, and meter gateways to automatically pull electricity consumption, fuel rates, and production volumes — no manual data entry required.
GHG Protocol Emission Factors
Built-in database of EPA, IPCC, and industry-specific emission factors for all fuel types, electricity grids, and supply chain materials — updated annually.
Scope 3 Supplier Portal
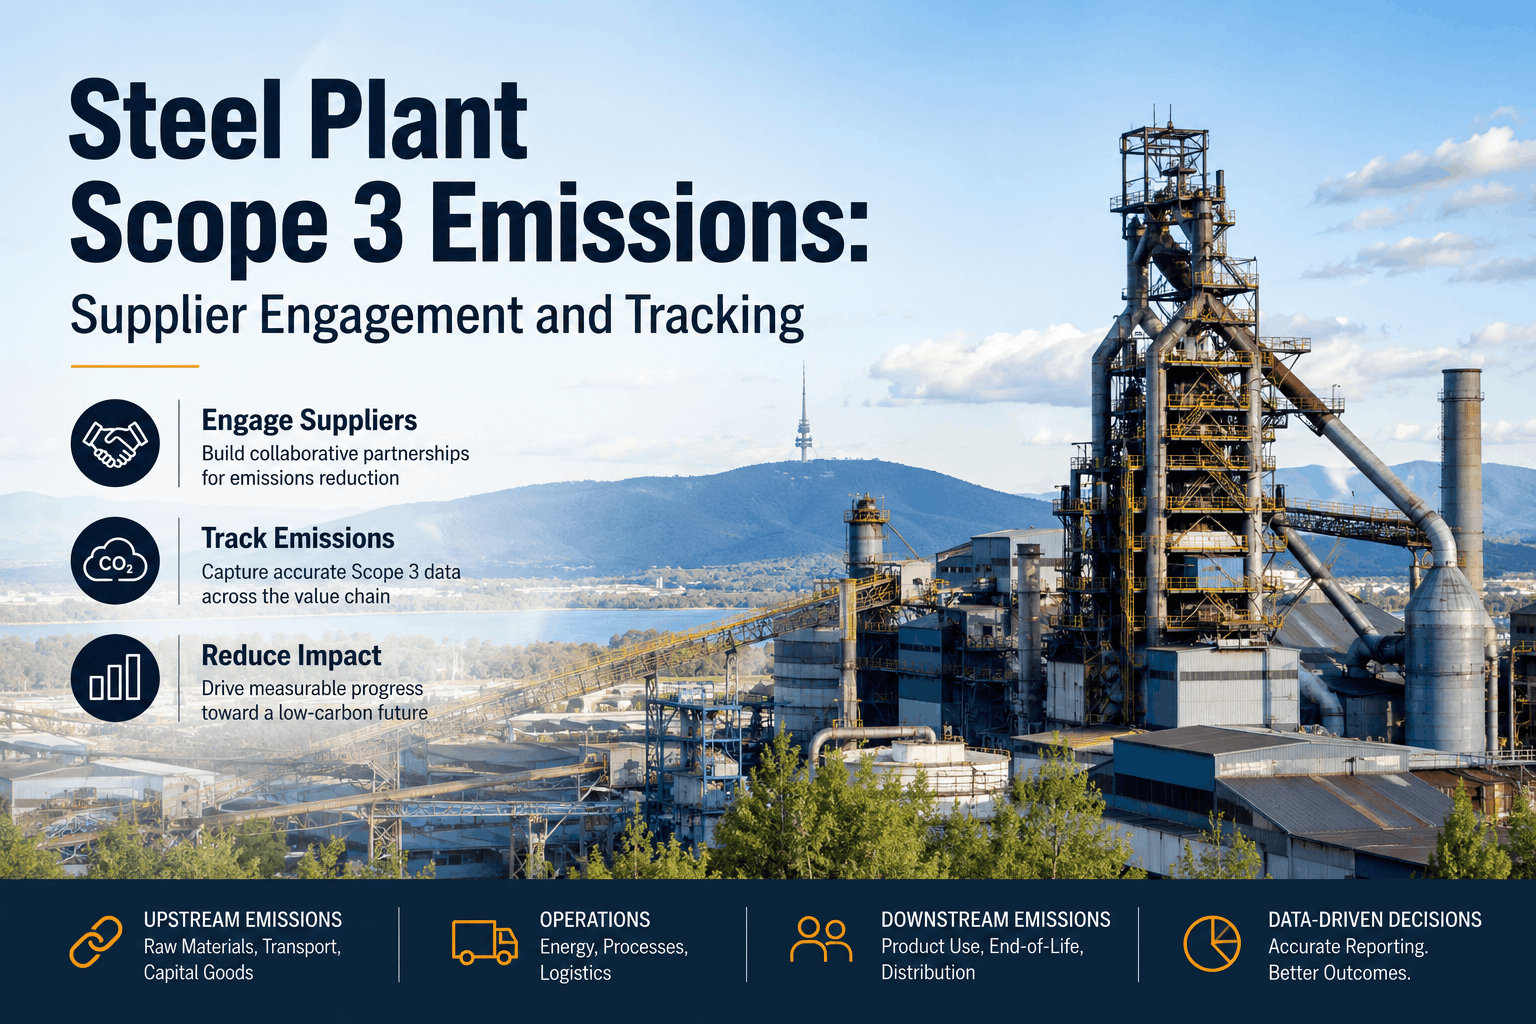
Engage suppliers to report carbon emissions from ore, coal, and alloy production; platform aggregates data and validates against industry benchmarks for accuracy.
Compliance Reporting Dashboards
Generate EPA, CDP, and SBTi-compliant reports with audit trails; annual, quarterly, and monthly footprint tracking with variance analysis.
Carbon Intensity Benchmarking
Compare tonnes CO2 per tonne of steel produced against industry benchmarks; track improvement trends and identify reduction opportunities.
Anomaly Detection & Alerts
Real-time alerts for unusual fuel consumption, grid carbon content shifts, or supplier data gaps — investigate and correct before month-end reporting.
Reducing Scope 1 emissions in steel production requires process improvements and fuel switching. Blast furnace efficiency upgrades — hot blast stoves with ceramic liners, bell-less charging systems, and oxygen enrichment — reduce coke consumption by 5–8%. Switching from coke to alternative reducing agents (natural gas, hydrogen pilot projects, biomass) can further cut 10–15% of BF fuel needs. EAF plants can cut Scope 1 by transitioning to 100% scrap charging and off-peak melting. Scope 2 reductions come from electrifying heating processes, replacing natural gas-fired furnaces with electric induction heaters, and sourcing renewable electricity through power purchase agreements (PPAs). A steel plant in Texas or California can reduce Scope 2 by 40–60% by signing 10-year wind or solar PPAs. Scope 3 reductions require supplier engagement: negotiating long-term contracts with low-carbon iron ore producers (those using renewable energy in pelletization), specifying low-carbon coke from suppliers investing in coke oven gas recovery, and consolidating transportation routes to minimize upstream logistics emissions. Some plants are piloting low-carbon scrap sourcing and establishing circular economy partnerships with automotive and construction sectors to maximize recycled content in their products.
Reduction Strategy
Scope(s) Impacted
Potential Reduction
Investment & Timeline
Blast Furnace Hot Blast Upgrade
Scope 1
5–8% coke reduction
$15–25M per BF, 2–3 years
Natural Gas Injection in BF
Scope 1
8–12% coke offset
$8–12M retrofit, 1.5 years
Power Purchase Agreement (Wind/Solar)
Scope 2
40–60% electricity emissions reduction
Long-term PPA (10 years), no upfront capital
Electric Induction Reheating Furnaces
Scope 1 & 2
25–35% heating fuel reduction
$20–30M per furnace, 2 years
Low-Carbon Ore & Coke Sourcing
Scope 3
10–15% supply chain emissions
Contract negotiation, ongoing supplier engagement
Hydrogen Pilot in EAF/BF
Scope 1
15–20% pilot-scale reduction (scaling uncertain)
$30–50M pilot, 3–5 years
Transportation Route Consolidation
Scope 3
5–8% logistics emissions
Logistics software, 6–12 months
Frequently Asked Questions on Steel Carbon Footprint Calculation
What is the difference between Scope 1, 2, and 3 emissions in steel production?
Scope 1 covers direct emissions from fuel combustion in furnaces and process reactions (limestone calcination) — the largest portion at 70–75%. Scope 2 includes purchased electricity emissions from the grid powering EAF and rolling mills. Scope 3 encompasses supply chain emissions from ore mining, coal production, supplier transportation, and end-of-life recycling.
How are emission factors determined for steel plant fuels?
Emission factors are published by the EPA, IPCC, and industry bodies based on fuel composition analysis. For coke, factors account for carbon content and combustion efficiency; for electricity, factors reflect grid carbon intensity (coal-heavy regions show 0.8 kg CO2/kWh, renewable-rich grids 0.2 kg CO2/kWh). OxMaint maintains updated factor libraries matching your regional grid and fuel specifications.
Can we calculate carbon footprint if we purchase electricity from multiple grids?
Yes — if a plant receives power from two regions with different carbon intensities, apply the appropriate grid factor to each portion. OxMaint auto-splits electricity purchases by region and applies location-specific factors, then sums to total Scope 2 emissions.
What is carbon intensity in steel, and how do we benchmark it?
Carbon intensity is tonnes CO2 per tonne of steel produced. Global average is 1.85 tonnes CO2/tonne; integrated BF-BOF mills run 1.8–2.0, EAF plants 0.4–0.8. OxMaint benchmarks your plant against industry peers and tracks year-over-year improvement toward Science Based Targets (SBTi) goals.
How do we engage suppliers to report Scope 3 emissions data?
OxMaint includes a supplier portal where iron ore producers, coal mines, and scrap vendors submit emissions data — reducing manual outreach and consolidating Scope 3 inputs. Suppliers receive templates aligned with GHG Protocol methodology.
What reports can OxMaint generate for carbon footprint compliance?
OxMaint generates EPA GHG reporting, CDP Climate Change questionnaires, and Science Based Targets initiative (SBTi) submissions — all with full audit trails showing activity data sources, emission factors applied, and calculation methodology for third-party verification.
How often should we recalculate our carbon footprint?
Annual calculation is standard for regulatory compliance; monthly or quarterly tracking helps identify reduction opportunities and detect anomalies early. Grid carbon factors change seasonally, so quarterly updates ensure accuracy if emission intensity shifts significantly.
Can we offset Scope 1 and Scope 2 emissions through renewable energy purchases?
Scope 2 can be reduced significantly through wind or solar power purchase agreements (PPAs) — these replace grid electricity with low-carbon sources. Scope 1 offsets (carbon credits from reforestation) are possible but don't reduce actual furnace emissions; process improvements are preferred for true Scope 1 reduction.
"
Our steel plant was generating carbon reports manually across four spreadsheets with no audit trail — compliance reviews took 6 weeks. We integrated OxMaint's Carbon Footprint Engine to auto-collect data from our EMS and SCADA systems. Our EPA and CDP submissions now take 10 days with full traceability. We discovered a 12% reduction opportunity in our Scope 2 through grid carbon benchmarking that would have been invisible in spreadsheets. First-year ROI was immediate through efficiency gains and supplier engagement efficiency.
Operations Director — Integrated Steel Mill, 500K tonnes/year, Pennsylvania, USA
Start Your Steel Plant Carbon Accounting Journey Today.
OxMaint connects your operational data to GHG Protocol-compliant carbon calculations — real-time Scope 1, 2, and 3 reporting with supplier engagement and benchmarking. Free to start. No credit card required. Begin your carbon footprint calculation or schedule a 30-minute consultation with our compliance team.
Turn Operational Data Into Verified Carbon Reports.
Real-time Scope 1, 2, and 3 calculation with GHG Protocol compliance, supplier portal, and benchmarking dashboards.