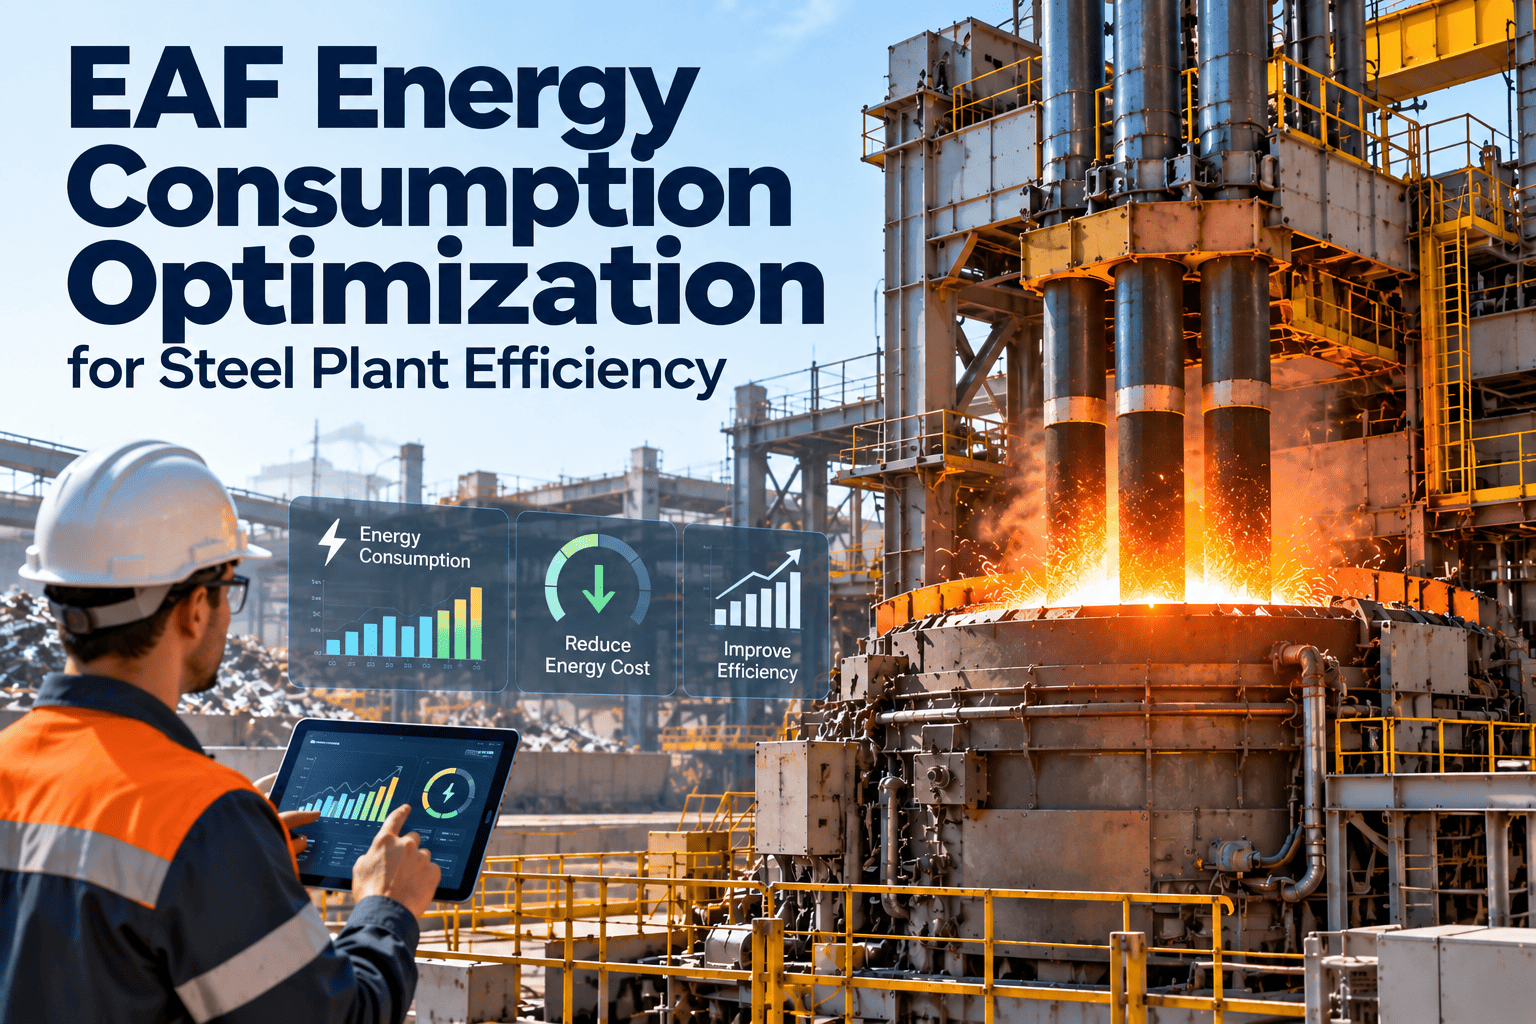
A modern integrated steel plant burns through 18–25 GJ of energy for every tonne of steel it produces. At an energy cost of $8–$12 per GJ, that is $144–$300 in energy spend embedded in each tonne before a single rolling, cutting, or finishing operation begins. The difference between a plant running at 18 GJ/tonne and one running at 24 GJ/tonne — on the same production volume — can exceed $15 million annually in avoidable energy cost. That gap is not primarily a capital investment problem. It is a data visibility problem: most steel plants cannot tell you, in real time, which furnace, which compressor system, or which shift schedule is driving their energy intensity above benchmark. Sign up for Oxmaint to put a live kWh/ton dashboard on your operations floor today.
Where Steel Plant Energy Goes: Consumption by Production Area
Reducing kWh/ton starts with knowing which systems are consuming what share of your energy budget. These CSS-represented consumption shares reflect World Steel Association benchmarks for integrated BF-BOF plants — your actual distribution depends on plant configuration. Sign up for Oxmaint to generate your actual plant-specific energy breakdown from meter data.
Blast furnace, hot blast stoves, BOF, and coke ovens dominate total energy consumption. Combustion efficiency is the primary lever — 1% stack heat loss improvement yields 0.5–0.8 GJ/tonne.
Reheating furnaces, rolling mill drives, and cooling systems account for 12–18% of total plant energy. Slab temperature management between casting and rolling is the largest optimization target.
20% of total plant energy input is dischargeable as recoverable waste heat from flue gases, cooling water, slag, and slab surfaces — but requires maintained heat recovery equipment to capture it.
Compressed air leaks, steam trap failures, fouled heat exchangers, detuned burners, and motor efficiency degradation account for 10–15% of avoidable energy waste across a typical integrated plant.
The Five Maintenance-Driven Energy Levers That Deliver 15–25% kWh/ton Reduction
Energy management in steel plants is inseparable from maintenance management. Every deferred burner tuning, every fouled recuperator, every leaking steam trap represents both a maintenance failure and an energy cost. These five levers are the highest-value maintenance actions for energy performance — each directly trackable and schedulable in a CMMS.
Combustion Optimization — The Single Largest Energy Lever in Steel
Blast furnace hot blast stoves, reheating furnaces, and coke oven underfiring systems together account for 50–60% of total plant fuel consumption. A burner detuned by 3–4% excess air — common after 3–6 months without PM — wastes 4–8% of fuel input as sensible heat up the stack. At 1 million tonnes annual production, that single maintenance gap costs $800,000–$2.4M annually in avoidable fuel spend.
Oxmaint connects flue gas O2 analyzer readings and stack temperature sensors directly to PM scheduling — automatically generating burner tuning work orders when combustion efficiency drifts beyond threshold. Sign up to configure your first combustion efficiency alert.
- Stack O2 above 3.5% triggers burner inspection and retuning work order
- Flue gas temperature trending alerts flag recuperator fouling before efficiency loss compounds
- Combustion tuning records linked to fuel consumption trend for measurable efficiency verification
Waste Heat Recovery — Maintained Systems Recover 3x More Than Neglected Ones
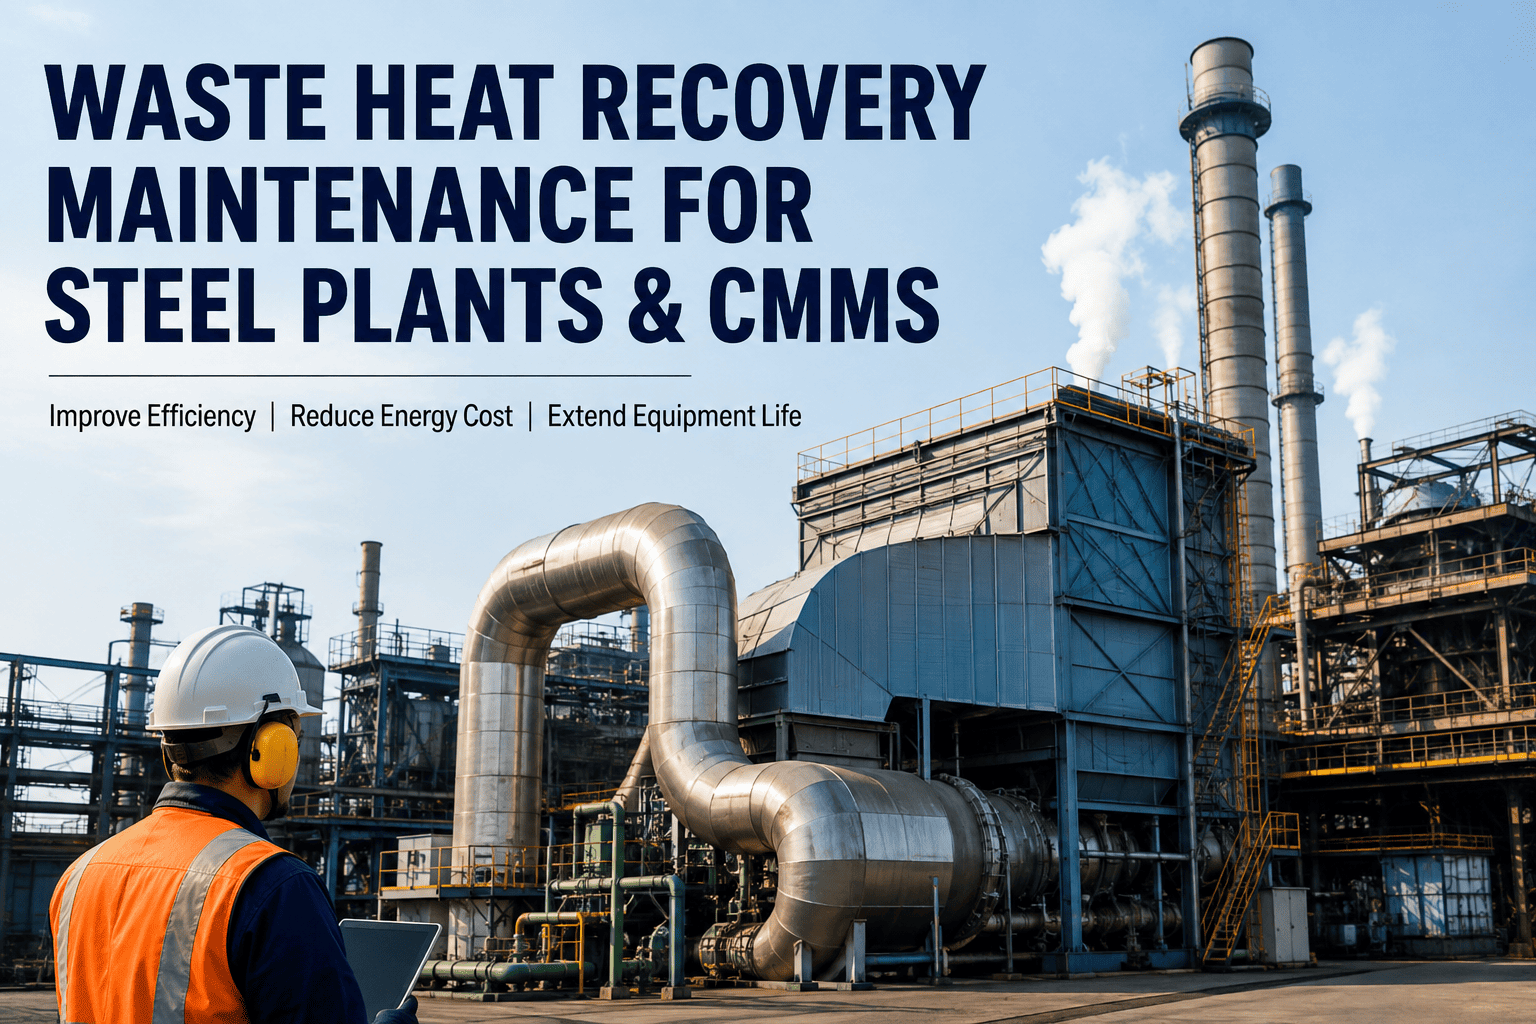
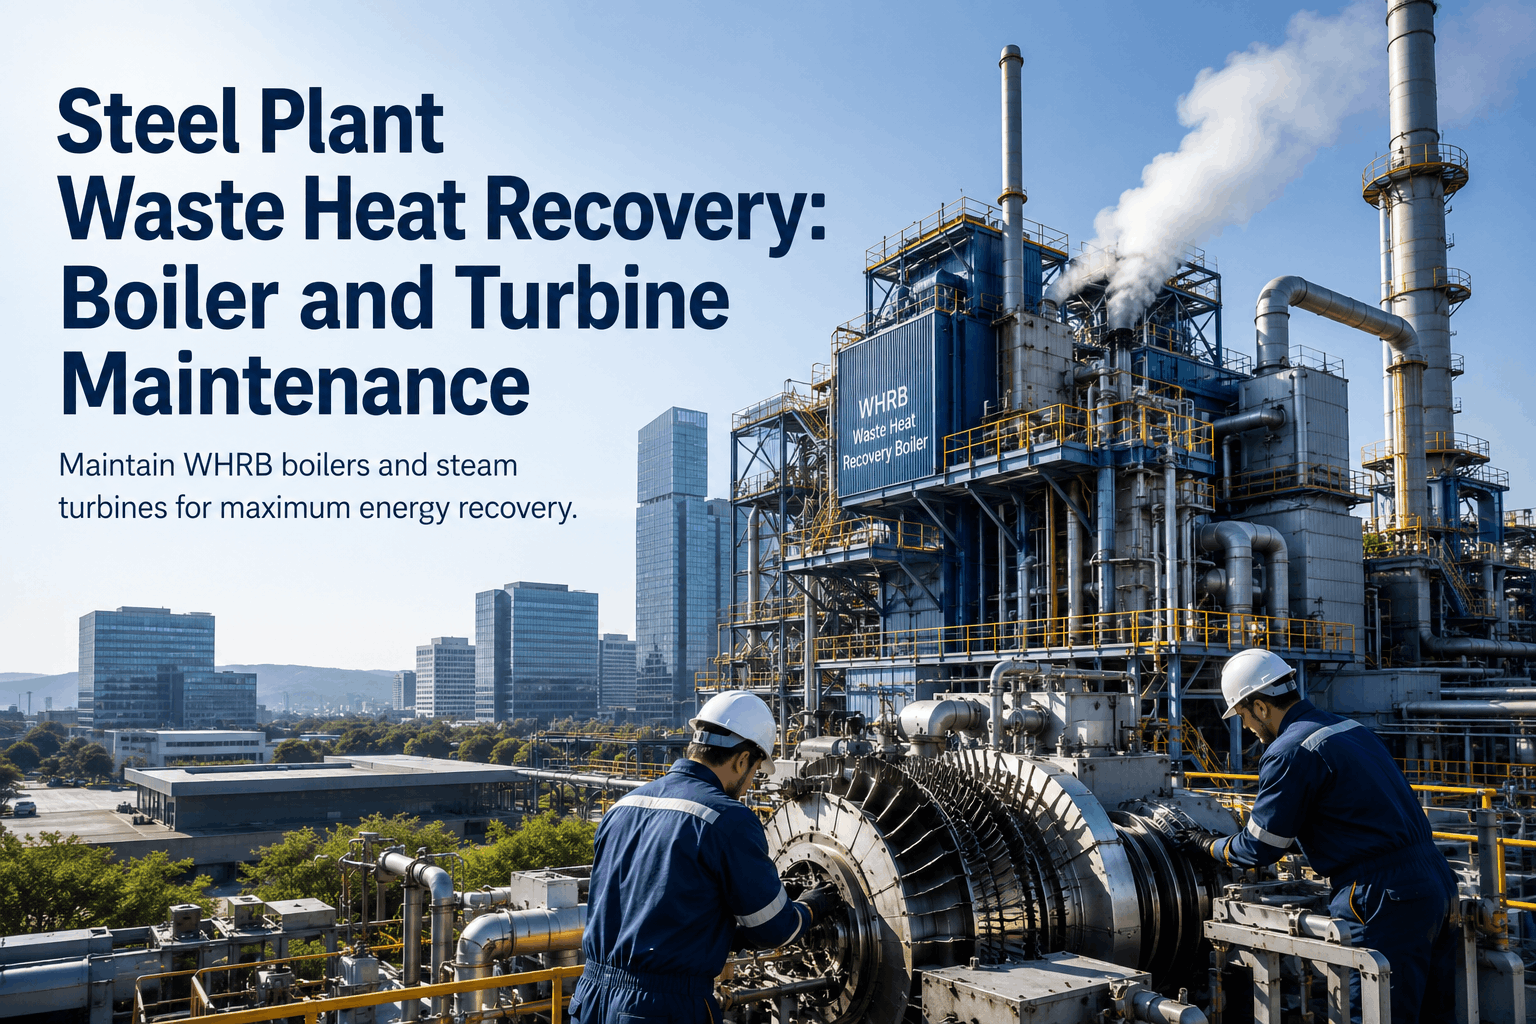
Recuperators, regenerators, waste heat boilers, and hot blast stove heat exchangers lose efficiency progressively through dust fouling, scaling, and tube degradation. A recuperator cleaned quarterly at 88% efficiency recovers 3.2 GJ/tonne of flue gas heat back into combustion air preheat. The same recuperator at 55% efficiency after 18 months without maintenance recovers only 2.1 GJ/tonne — a compounding energy penalty that accumulates across every heat and every year.
CMMS-driven heat exchanger PM schedules with U-value trending alerts catch fouling before it reaches the steep portion of the degradation curve. Book a demo to see Oxmaint's heat recovery efficiency tracking in action.
- U-value trending from inlet-outlet temperature data detects fouling at 90% efficiency — not 55%
- Waste heat boiler drum pressure and steam output trending identifies tube scale buildup
- Scheduled chemical cleaning work orders at 85% threshold prevent the steep efficiency drop
Compressed Air Leak Management — The Fastest Energy Payback in the Plant
Compressed air leakage in steel plants averages 20–35% of generated air — representing a direct electricity waste proportional to compressor capacity. A 1,000 kW compressed air system with 32% leakage wastes approximately 320 kW continuously — equivalent to €180,000–€220,000 in annual electricity cost at industrial rates. Ultrasonic leak detection surveys combined with CMMS-tracked repair work orders typically achieve less than 8% leakage within two survey-and-repair cycles.
Oxmaint tracks leak detection surveys as recurring PM work orders, logs each identified leak with GPS location and estimated flow rate, and tracks repair completion rates. Sign up for Oxmaint to schedule your first ultrasonic leak survey PM.
- Quarterly ultrasonic leak survey work orders with GPS-tagged leak log attachments
- Compressor specific energy trending detects system pressure losses between surveys
- Repair completion tracking ensures no identified leaks persist beyond the next production shutdown
Steel Plant Energy Intensity Benchmarks by Production Area and Route
Knowing your plant's kWh/ton figure is only useful when compared against an accurate benchmark. This table shows industry-standard energy intensity ranges for each major production area — the starting point for identifying where your plant's energy management program needs the most attention.
Swipe to see full benchmark table
Your Energy Dashboard Should Tell You Which Asset Is Costing You Most — Right Now
Oxmaint connects your energy meters, production records, and maintenance history to calculate real-time kWh/ton by process area — automatically flagging deviations that signal equipment degradation or process inefficiency before they become large line items on your energy bill.
What Steel Plants Achieve With AI-Powered Energy Management
The results below come from steel producers who connected energy metering, CMMS maintenance data, and AI analytics into a unified energy management program — not from capital investment in new equipment, but from extracting full performance from existing assets.
Our reheating furnaces were consuming 1.8 GJ per tonne of slab — we thought that was reasonably competitive. After we connected our stack O2 analyzers and furnace temperature sensors to Oxmaint and started tracking combustion efficiency per furnace per shift, we discovered that our night shift averaged 0.3 GJ/tonne higher than day shift because they were running with 20% more excess air to avoid nuisance alarms. Three months of targeted PM on the O2 control loops and burner registers brought us down to 1.4 GJ per tonne — a saving we had been sitting on for years without knowing it existed.
Steel Plant Energy Management — Common Questions
Oxmaint pulls energy consumption data from sub-metered electricity meters, fuel flow meters, and steam generation records — normalized against production output per heat or per shift from the MES or Level 2 system. The kWh/ton (or GJ/tonne) figure updates continuously as production data arrives, broken down by production area. When energy intensity rises above the baseline for any area, Oxmaint automatically generates an investigation work order flagging the deviation — with trend history attached. Sign up for Oxmaint to configure your first energy intensity KPI.
Steel plants that integrate maintenance data with energy monitoring typically identify 8–15% of energy consumption as maintenance-avoidable waste within the first three months. Combustion tuning gaps, fouled heat exchangers, compressed air leaks, and steam trap failures collectively account for most of this. Capturing and systematically eliminating these losses through CMMS-driven PM scheduling delivers 15–25% energy intensity reduction without capital investment in new equipment. The reference data from the US Department of Energy's industrial efficiency programs documents similar ranges across heavy manufacturing. Book a demo to see a projected energy savings estimate for your plant configuration.
Yes. Oxmaint's energy dashboard and carbon tracking module share the same underlying data — energy consumption per tonne from metered sources. The same fuel consumption and electricity records that generate your kWh/ton operational KPI also feed your Scope 1 and Scope 2 embedded carbon calculations for CBAM quarterly reporting and ESG disclosures. Improvements in energy intensity automatically reflect in lower reported embedded carbon — so operational energy optimization and CBAM cost reduction are the same program in Oxmaint, not separate workstreams.
Waste heat recovery PM requires performance-based triggers — not just fixed calendar intervals. A recuperator on a six-week cleaning schedule regardless of actual fouling may be cleaned too late in summer dust conditions and too early in clean-fuel seasons. Oxmaint's energy monitoring layer creates condition-based PM triggers: when U-value trending shows the recuperator at 88% efficiency, it generates the cleaning work order — regardless of whether it has been six weeks or ten weeks since the last cleaning. This approach recovers 10–20% more heat per year than fixed-interval PM by catching the steep part of the fouling curve before it develops.
Most steel plants identify their first energy-saving maintenance actions within the first month of live kWh/ton monitoring — because the data immediately reveals which areas are running above benchmark. The first quick wins (combustion tuning, compressed air leak repair, steam trap replacement) typically deliver 3–5% energy intensity improvement within the first 90 days. The sustained 15–25% improvement builds over 12–18 months as condition-based PM schedules mature and the CMMS maintenance history enables trend-based detection of gradual efficiency degradation. Sign up for Oxmaint to start your energy baseline measurement today.
Every GJ/Tonne Above Benchmark Is Money Leaving Your Plant That a Work Order Could Stop
Steel plant energy waste is not an engineering problem — it is a maintenance visibility problem. Oxmaint gives your team the kWh/ton dashboard, condition-based PM triggers, and energy-maintenance linkage to identify and eliminate avoidable energy losses before they compound into million-dollar annual costs.