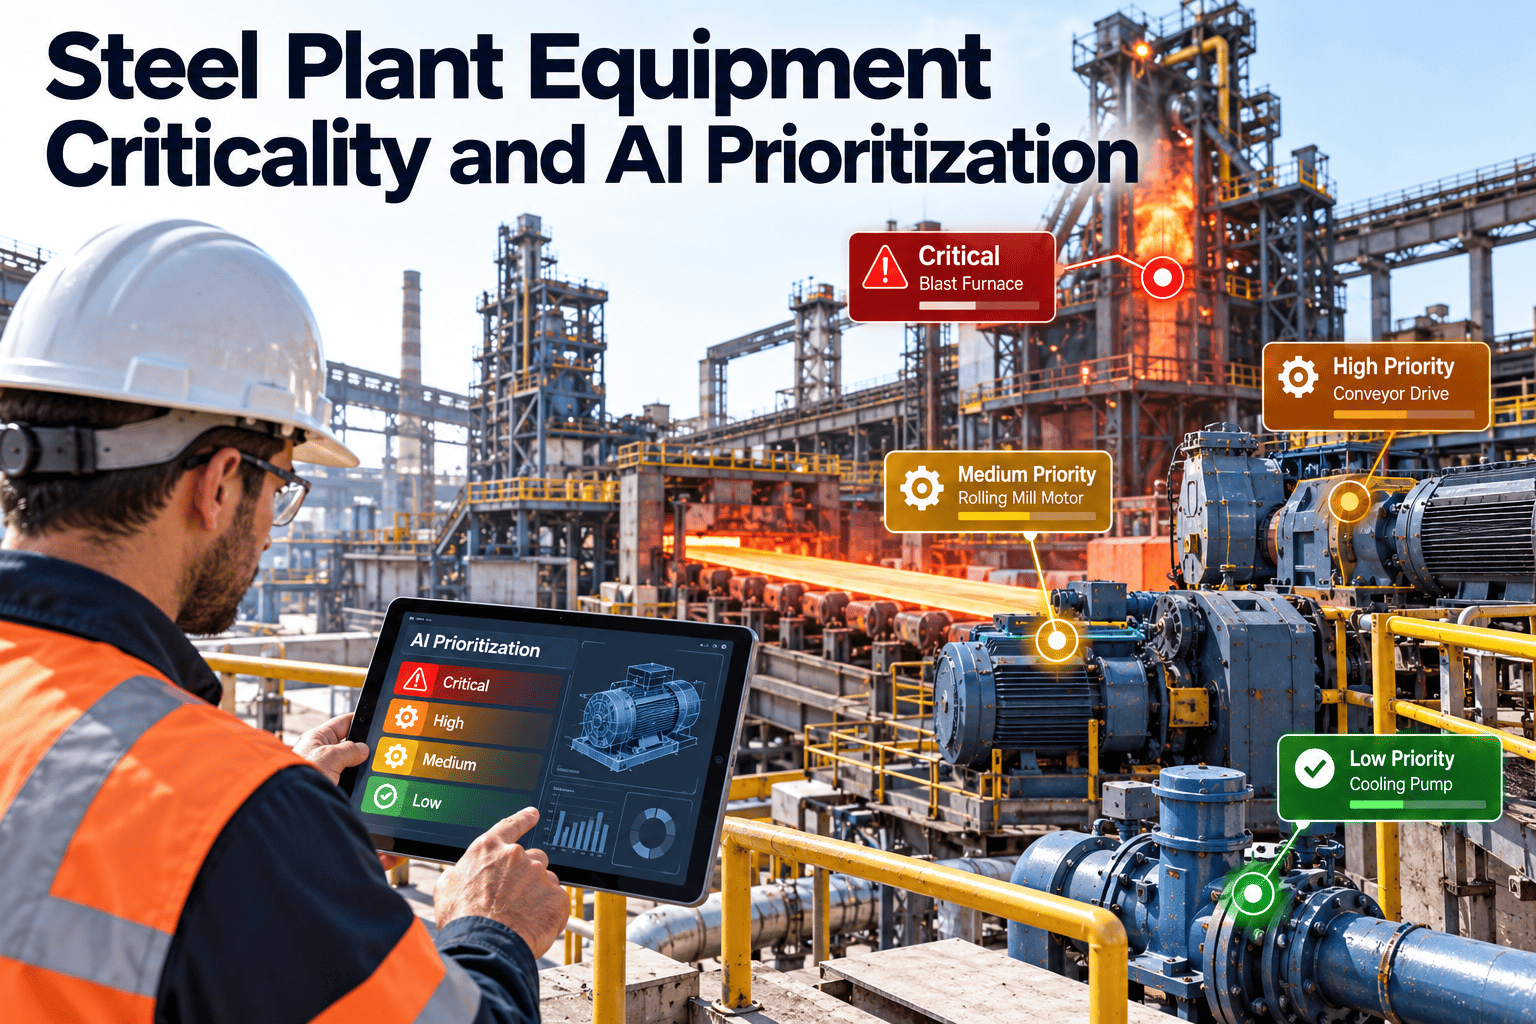
In most steel plants, almost every open work request is labeled urgent. A caster segment drive, a utility pump and a canteen fan all compete for the same crews, and the loudest voice usually wins. Equipment criticality replaces that habit with a ranked, evidence-based order of attention. This guide shows how to score assets, map failure modes, add AI-assisted prioritization and run it through Oxmaint maintenance management software.
Steel Plant Equipment Criticality and AI Prioritization
Rank every asset by the consequence of failure, connect failure modes to the right maintenance task, and let data help decide which work comes first.
The Problem With Everything Being Priority One
Without a shared ranking, planners juggle requests by seniority, noise or last week's breakdown. The result is predictable.
What Makes a Steel Plant Asset Critical
Criticality is the combined effect of failure on safety, production, quality, cost and the environment, adjusted by how hard the asset is to repair or replace. Score each factor with the same scale across the plant.
| Factor | Question to ask | Steel plant example |
|---|---|---|
| Safety | Can failure injure people or release hazardous energy? | Crane hoist brake, process gas valve |
| Production impact | Does failure stop the line or only slow it? | Caster drive with no parallel path |
| Quality | Will failure create off-spec or scrapped product? | Mold cooling, mill thickness control |
| Redundancy | Is there a standby or alternative route? | Duplex pumps versus a single fan |
| Repair time and lead time | How long to restore, including parts? | Large gearbox or transformer |
| Environmental and compliance | Does failure create emissions or regulatory exposure? | Dust extraction fan, water treatment |
| Failure history | How often and how severely has it failed? | Repeat hydraulic leaks on one stand |
From Score to Tier
Add the weighted factor scores and sort assets into tiers. Four tiers are usually enough for people to remember and use.
Failure Modes: Where Criticality Becomes Action
A ranked asset list tells you where to focus. Failure mode and effects analysis (FMEA) tells you what to do there. For each Tier A asset, list how it can fail, what the effect is, how you would detect it early and which task addresses it.
| Asset | Failure mode | Early signal | Maintenance response |
|---|---|---|---|
| Mill reduction gearbox | Bearing or gear wear | Vibration, oil debris, temperature rise | Condition-based task, oil analysis, planned overhaul |
| Caster hydraulic unit | Contaminated oil, valve sticking | Pressure drift, filter differential | Filtration upkeep, valve inspection |
| Overhead crane hoist | Brake wear, rope damage | Brake gap, rope inspection findings | Statutory inspection, replace by criteria |
| Induced draft fan | Imbalance from dust buildup | Rising vibration trend | Cleaning, balancing, bearing check |
| Furnace transformer | Insulation degradation, cooling fault | Dissolved gas, thermography | Testing program, cooling maintenance |
Reliability-centered maintenance in practice
- Match each failure mode to the cheapest task that actually prevents or detects it.
- Where no useful task exists, consider redesign, spares or a run-to-failure decision.
- Review tasks after failures; if a failure was not predicted, the strategy needs revision.
- Keep the analysis in the maintenance system so tasks stay linked to assets.
Where AI Prioritization Helps, and Where It Does Not
AI-assisted prioritization means using data to rank work more consistently than a person can across thousands of assets. It supports planners; it does not replace engineering judgment.
- Ranking open work by asset criticality, safety flag and age
- Spotting repeat failures hidden in thousands of work orders
- Highlighting assets with worsening condition readings
- Suggesting which preventive tasks rarely find defects
- Drafting failure patterns for engineers to confirm
- Overriding safety or statutory inspection requirements
- Running on incomplete or inconsistent asset data
- Approving shutdown decisions without engineer review
- Replacing root cause analysis with a score
- Hiding how a ranking was calculated
Data that makes prioritization trustworthy
Start Ranking Your Assets by Consequence
Build your asset hierarchy, assign criticality and see open work sorted by what matters to production and safety.
A Prioritization Workflow Planners Can Follow
A Simple Priority Rule for Open Work
Combine asset criticality with the condition of the problem. A defect on a Tier A asset outranks a larger defect on a Tier D asset.
| Asset tier | Defect severity: minor | Defect severity: developing | Defect severity: failing |
|---|---|---|---|
| Tier A | Plan this week | Schedule next window | Immediate action |
| Tier B | Plan this month | Plan this week | Schedule next window |
| Tier C | Routine | Plan this month | Plan this week |
| Tier D | Routine | Routine | Plan this month |
Root Cause Analysis for the Failures That Matter
Not every failure deserves a full investigation. Trigger formal root cause analysis by rules, such as any Tier A failure, any safety event or any repeat failure within a set period.
How Oxmaint Supports Criticality-Based Maintenance
- Asset management with a hierarchy that mirrors plant areas and equipment.
- Work orders that carry asset, priority, photos and failure information.
- Preventive maintenance schedules set differently by asset importance.
- Inspections and condition readings feeding condition-based tasks.
- Inventory visibility so critical spares are tracked against Tier A equipment.
- Dashboards and reports showing backlog, repeat failures and downtime by asset.
Measuring Whether Prioritization Works
Common Mistakes to Avoid
- Scoring in a spreadsheet by one person, with no operations input.
- Making too many tiers, so nobody remembers the difference.
- Scoring once and never revisiting after process changes.
- Treating criticality as a label rather than a driver of PM, spares and response.
- Trusting any automated ranking without checking the underlying data quality.
Frequently Asked Questions
Put the Right Work in Front of the Right Crew
Turn criticality scores and failure history into a ranked work queue that protects safety and production first.