Steel mills are asked for ESG numbers that investors, customers and regulators expect to trace back to something real, yet the evidence usually sits in maintenance logs, energy meters and production reports that were never designed to work together. Burner tuning, refractory repair, compressed air leaks, motor efficiency and filter condition all move the energy and emissions lines of a sustainability report long before anyone writes the narrative. Treating maintenance records as the evidence layer turns ESG reporting from an annual scramble into a routine output of daily work. See how Oxmaint maintenance management software links work orders, inspections and asset history to the metrics your ESG team has to defend.
ESG and Green Steel
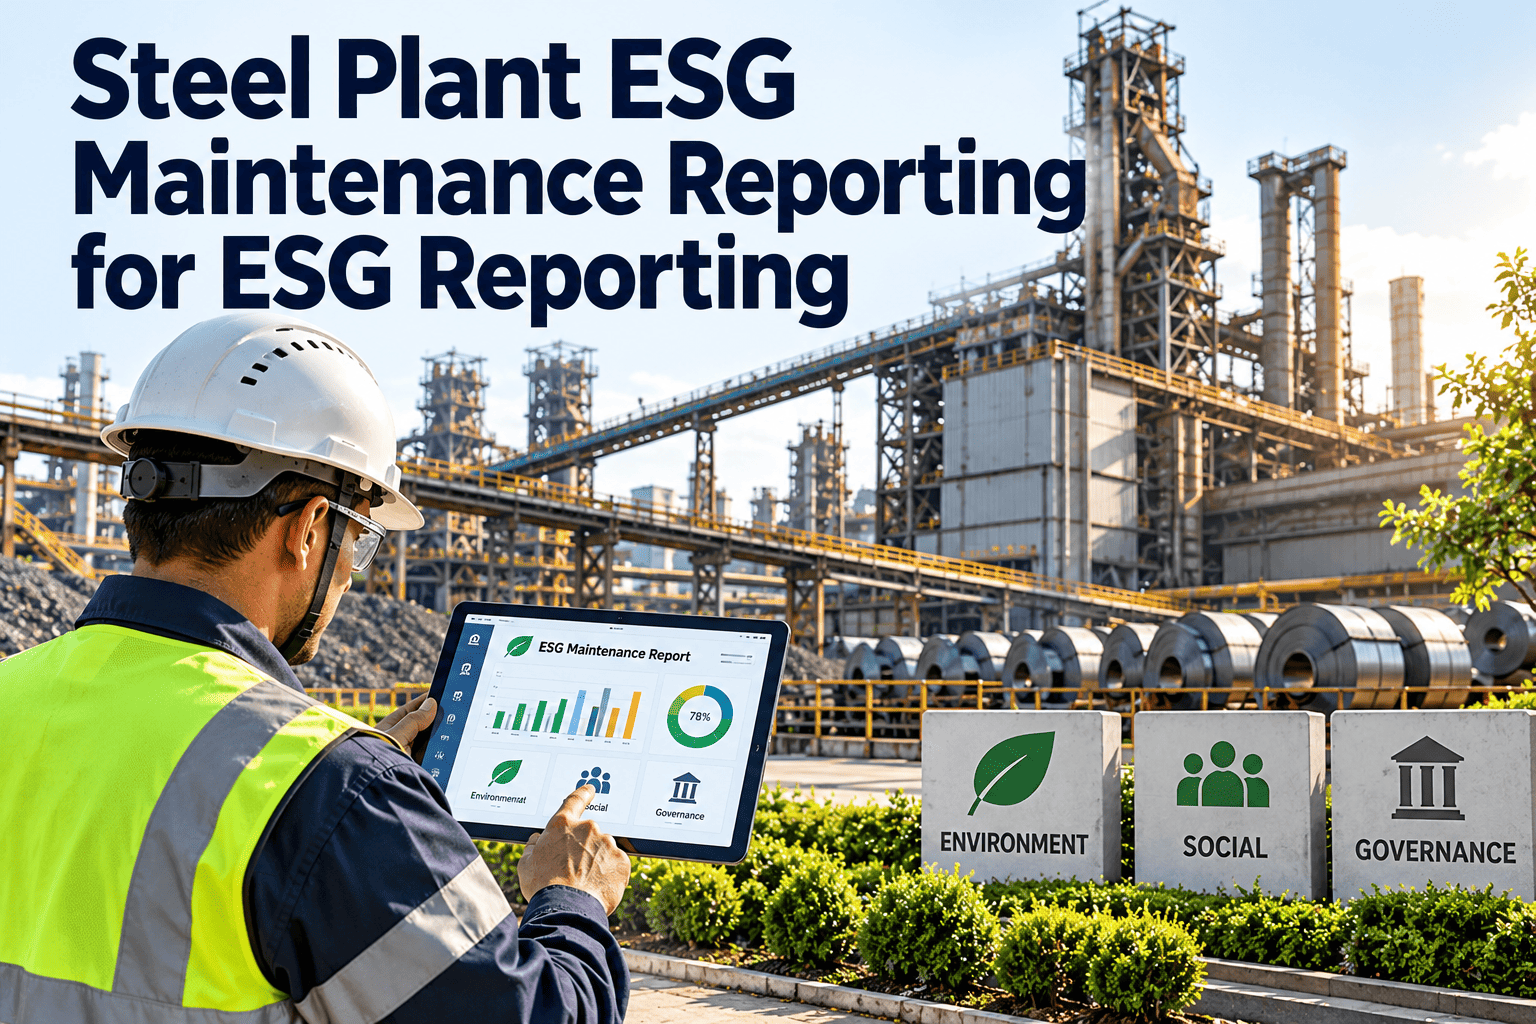
Steel Plant ESG Maintenance Reporting: Turn Work Orders into Defensible ESG Evidence
Energy intensity, Scope 1 and Scope 2 emissions and environmental controls all move with the condition of furnaces, burners, motors, compressors and filters. Oxmaint keeps the work orders, inspections and asset history that prove it.
Asset condition
Burner, motor, compressor, filter or refractory state recorded during an inspection.
Work order
Corrective or preventive task with date, craft, parts used and findings.
Energy effect
Fuel, power or run-hour readings compared before and after the repair.
ESG metric
Energy per tonne, Scope 1 intensity and emission control availability.
Disclosure
CDP answers, sustainability report lines and customer questionnaires with evidence attached.
Why Maintenance Belongs in ESG
ESG numbers are only as strong as the records behind them
Reviewers rarely challenge the headline figure first. They ask how it was calculated, which meters fed it and what changed in the plant during the year. If the answer lives in a spreadsheet owned by one person, the figure is hard to defend.
Gaps that appear in steel mill ESG files
- Efficiency repairs logged on paper with no link to the asset
- Energy figures estimated from utility bills instead of metered by area
- Calibration dates tracked in a separate file nobody checks
- Environmental equipment downtime missing from the operations record
Event to Metric Map
Which maintenance events change which ESG line
Not every work order matters to a sustainability report. These are the events that most directly change fuel burn, purchased electricity or environmental control performance, and the record each one should leave behind.
| Maintenance event | Scope | Metric it moves | Record to keep |
|---|---|---|---|
| Burner tuning and air-fuel ratio check on reheating furnaces | Scope 1 | Fuel per tonne rolled | Calibration entry, readings before and after, work order |
| Refractory and insulation repair on furnaces and ladles | Scope 1 | Heat loss, fuel or power per tonne | Inspection photos, thickness readings, repair order |
| Process gas pipe and valve leak repair | Scope 1 | Fugitive losses and flaring | Leak inspection finding and closure record |
| Compressed air leak repair | Scope 2 | Specific power of compressed air | Leak tag, repair order, compressor load data |
| Motor, fan and pump efficiency corrections | Scope 2 | kWh per tonne | Alignment and vibration readings, run hours |
| Dust collector, bag filter and scrubber maintenance | Environmental control | Emission control availability | Filter change log, differential pressure readings |
| Energy meter calibration | All scopes | Data quality of every intensity figure | Calibration date, method and technician |
Two Different Levers
Scope 1 and Scope 2 respond to maintenance in different ways
Combustion, process gas and furnace condition
- Worn or mistuned burners raise fuel use for the same tonnage
- Failed refractory and insulation push more heat into the shop
- Leaking gas lines and valves create avoidable losses
- Drifting analyzers hide combustion problems from operators
Motors, compressors, fans and pumps
- Misaligned or unbalanced drives draw more power per unit of work
- Compressed air leaks keep compressors loaded for nothing
- Fouled heat exchangers and cooling circuits force pumps to work harder
- Poor power factor and failing VFDs raise consumption and demand
A note on Scope 3
Refractory, lubricants, spare parts and contractor services carry embedded emissions that belong in the value chain inventory. A spare parts and work order history gives the purchasing team the quantities they need instead of estimates.
Efficiency Drift
How a small defect becomes a reporting variance
Drift begins
A burner, seal or drive degrades slowly and nobody sees an alarm.
Intensity creeps
Energy per tonne rises a little each week, hidden by product mix changes.
Month-end surprise
The ESG team sees a variance with no link to any asset.
Cause hunt
Operations and maintenance reconstruct events from memory and paper.
Closed by work order
The fix is logged against the asset, with readings that prove the recovery.
The aim is to move the cause hunt earlier. When inspections capture small deviations and route them to a work order, the variance is explained at the asset level before it reaches the month-end report.
Reporting Maturity
Estimate-based reporting versus record-based reporting
- Efficiency losses found at year-end review
- Maintenance and ESG teams keep separate files
- Meter calibration tracked by memory or email
- Improvement claims rely on engineering judgment
- Audit preparation takes weeks of reconstruction
- Efficiency drift flagged and closed by work order
- One asset record shared by maintenance, energy and ESG
- Calibration scheduled and logged as preventive work
- Improvement claims backed by before and after readings
- Evidence pulled by asset, area or date range on demand
KPI Ladder
Maintenance indicators that support ESG reporting
Energy per tonne by process area
Metered fuel and power divided by output for each line, trended against maintenance events on the same line.
PM compliance on energy-significant assets
Share of scheduled tasks completed on time for furnaces, large drives, compressors and gas systems.
Efficiency work orders closed on time
Energy-related corrective tasks completed within the target window after they are raised.
Leak repair cycle time
Days between a compressed air or gas leak being tagged and the repair being verified.
Meter calibration currency
Percentage of energy and emission meters calibrated within their required interval.
Emission control availability
Hours that dust collectors, scrubbers and filters were in service against hours the process ran.
Frameworks
What each reporting framework expects the plant to prove
| Framework | What it asks for | Maintenance evidence that helps |
|---|---|---|
| GHG Protocol | Scope 1 and Scope 2 inventory with documented methods | Fuel, run-hour and meter records tied to assets |
| ISO 14404 series | Calculation method for CO2 intensity of iron and steel production, built on the worldsteel data collection method | Consistent process boundary data for each area |
| ISO 50001 | Energy management with demonstrated performance improvement | Energy-related corrective actions and calibration history |
| CDP | Emissions figures plus governance and controls | Documented control activities and action closure |
| CSRD and ESRS climate standard | Climate disclosures for companies in scope | Traceable efficiency and transition actions |
| EU CBAM | Embedded emissions for steel entering the EU, with the definitive period running since January 2026 | Installation-level data discipline that supports verification |
Evidence on Demand
Give your ESG team an asset record they can trust
See how work orders, inspections and calibration schedules can sit in one maintenance record that sustainability, energy and operations teams all use.
Rollout Plan
A 90-day path from scattered logs to ESG-ready records
Baseline the energy-significant assets
- List furnaces, drives, compressors, gas systems and emission control equipment
- Register each one in the asset hierarchy with area and owner
- Inventory every energy meter and its calibration status
Build inspection routes and failure codes
- Create mobile inspection routes for combustion, leaks and filter condition
- Add an energy impact category to corrective work order codes
- Schedule meter calibration as preventive maintenance
Review the first evidence pack
- Pull a trial evidence pack by area and reporting period
- Compare energy per tonne against closed efficiency work orders
- Fix gaps in data capture before the next reporting cycle
Where Oxmaint Fits
Maintenance capabilities that feed ESG reporting
Asset management
A single hierarchy for lines, furnaces, drives and meters, so every record has an owner and a location.
Preventive maintenance
Scheduled burner checks, leak surveys, filter changes and meter calibrations that cannot quietly slip.
Mobile inspections
Technicians record readings, findings and photos in the field, so efficiency deviations are captured at the source.
Work orders and corrective maintenance
Findings convert to tracked corrective work with failure codes, labor, parts and closure notes.
Reporting and dashboards
Filter by area, asset or period to show PM compliance, backlog and closure times for the evidence pack.
Inventory
Spare and consumable usage by asset, which supports value chain questions from procurement and reviewers.
Audit Discipline
Six rules that keep ESG evidence audit-safe
- Record readings at the moment of work, never reconstructed later
- Tie every efficiency repair to an asset and a reporting area
- Keep before and after readings with the closed work order
- Calibrate energy meters on a schedule and store the result with the meter
- Lock closed records so the history cannot be edited quietly
- Document the method once and apply it the same way every year
Evidence Pack
What a maintenance-backed ESG evidence pack should contain
An evidence pack is the set of records a reviewer, auditor or customer can open to check a number without asking an engineer to explain it. Building it as a standing report, rather than a project each year, keeps the data honest and the effort small.
| Pack section | Contents | Typical owner |
|---|---|---|
| Asset scope | Register of energy-significant and emission control assets with area, function and criticality | Reliability engineer |
| Measurement integrity | Meter list, calibration dates, method and technician for every energy and emission meter | Instrumentation lead |
| Efficiency actions | Closed corrective work orders with findings, parts, labor and before and after readings | Maintenance planner |
| Preventive program | PM compliance by area for furnaces, drives, compressors and gas systems | Maintenance manager |
| Environmental controls | Inspection and filter records, differential pressure trends and downtime events | Environmental officer |
| Change log | Method changes, boundary changes and equipment replacements that affect year-on-year comparison | ESG manager |
Common Mistakes
Where steel plants weaken their own ESG evidence
- Claiming an energy saving with no metered baseline before the repair
- Comparing months with different product mix and calling it a trend
- Letting a meter run past its calibration date and still using its data
- Closing a work order with no reading, photo or finding recorded
- Changing the calculation method without noting the break in the series
- Taking a baseline reading before every efficiency repair
- Normalizing energy figures by output and product group
- Scheduling calibration as preventive work with a due date
- Requiring a reading and closure note before a task can close
- Recording method changes in a change log kept with the asset data
Normalization matters as much as measurement
A rolling mill running lighter sections burns more fuel per tonne than the same mill on heavier product. Without normalization, a real efficiency gain can disappear in the noise, or a mix change can be mistaken for an improvement.
Plant Floor Reality
Who has to act for the numbers to hold
Technicians and operators
Capture readings and findings during rounds, and tag leaks and abnormal conditions the moment they are seen.
Planners and supervisors
Prioritize energy-related corrective work, keep PM schedules on time and enforce closure standards.
Reliability and energy engineers
Choose which assets are energy significant, review drift trends and confirm that repairs delivered the expected recovery.
ESG and sustainability managers
Pull evidence by period, document the method and answer reviewer questions with records instead of recollection.
FAQ
Steel plant ESG maintenance reporting: common questions
Can a CMMS calculate Scope 1 emissions?
A CMMS does not replace your carbon inventory method. It holds the asset, work order and inspection records that support it, and Oxmaint can keep that evidence in one place.
Which maintenance records matter most to ESG reviewers?
Calibration history for energy meters, completed efficiency repairs with readings, and downtime of emission control equipment. Together they show the data is controlled and the actions were real.
How does maintenance affect Scope 2 emissions?
Scope 2 follows purchased electricity, so leaks, misalignment and failing drives that raise power draw also raise the figure. Fixing them and recording the result gives a traceable reduction.
How do we prove an efficiency repair worked?
Capture a metered reading before the work and another after normal operation resumes, then store both on the closed work order. A short demo shows how to set that up.
Does this help with EU CBAM data requests?
CBAM verification relies on installation-level data that is complete and consistent. Controlled maintenance and meter records make that data easier to defend, though the emissions calculation itself follows the regulation.
Ready for the Next Reporting Cycle
Make your next ESG report the easiest part of the year
Connect maintenance records to the metrics your investors, customers and regulators ask about, and keep the evidence ready all year.