How to Implement Steel Plant Maintenance Metrics Dashboard
By Alex Jordan on June 29, 2026
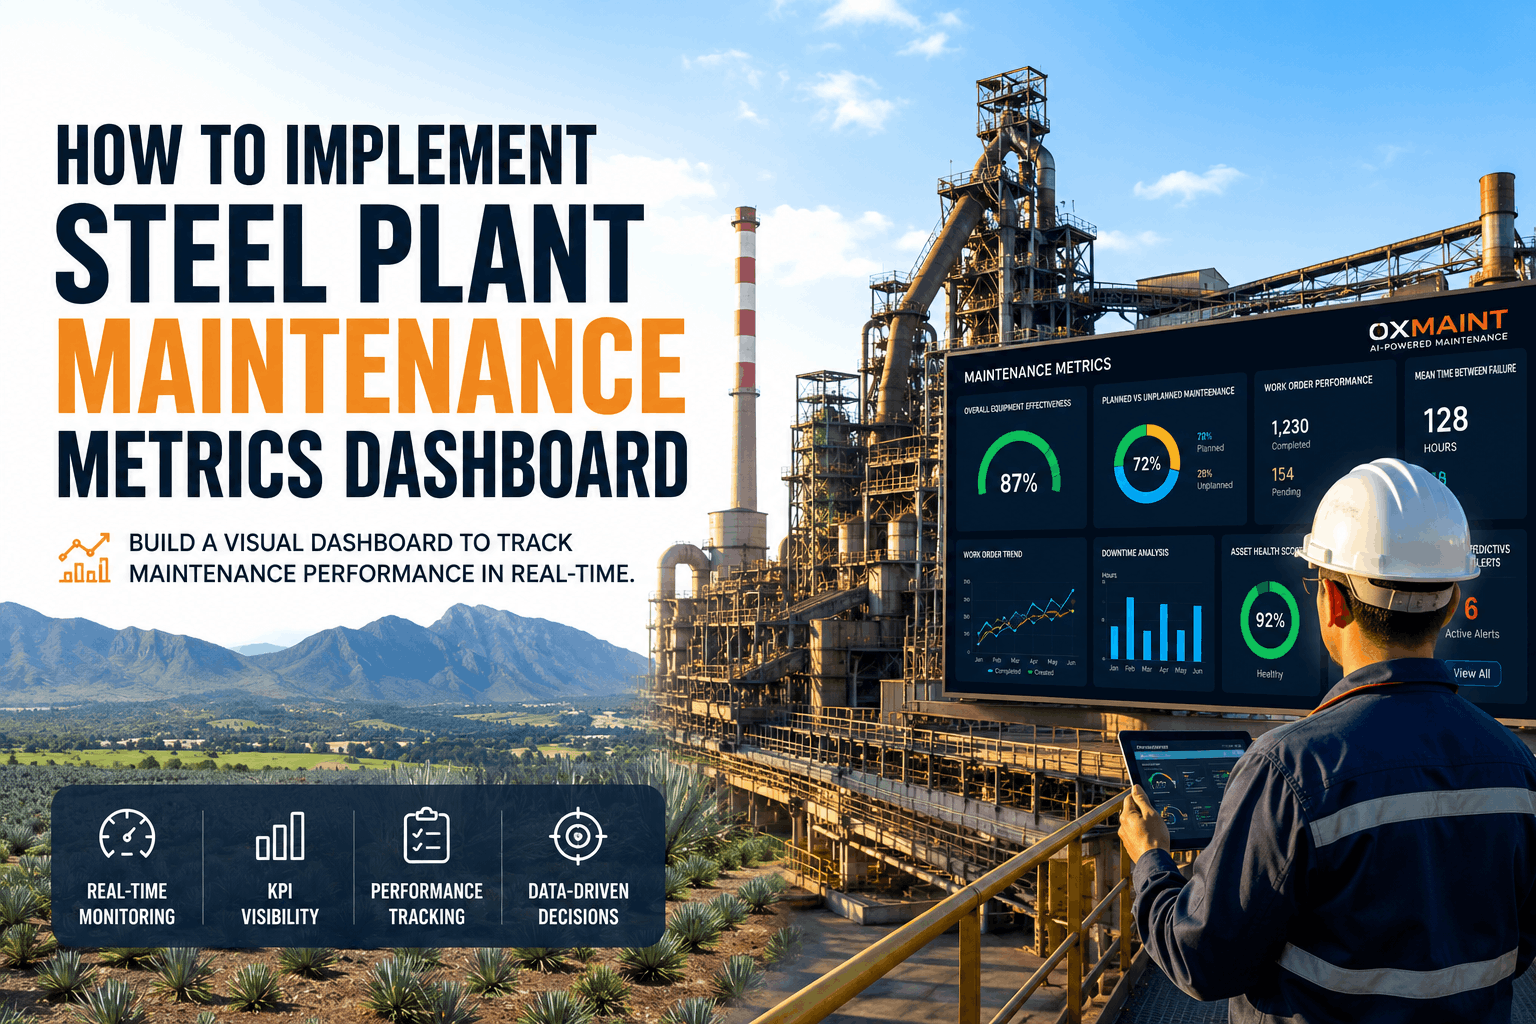
Steel plant maintenance generates massive amounts of data — work orders, sensor readings, downtime logs, and inspection reports. The challenge isn't data collection — it's getting the right information in front of the right people at the right time. A well-designed maintenance metrics dashboard transforms raw data into actionable intelligence. It tells maintenance managers which assets need attention, shows plant leadership where reliability is improving or declining, and gives technicians visibility into their performance. Without a dashboard, data remains scattered in spreadsheets, CMMS reports, and tribal knowledge. With a dashboard, every decision is informed by real-time performance visibility. Sign in to OxMaint to implement maintenance dashboards, or book a demo to see how visual performance tracking drives operational improvement.
Every KPI Visible. Every Trend Tracked. Every Decision Data-Driven.
OxMaint provides real-time maintenance dashboards that visualize asset availability, work order performance, cost metrics, and reliability trends — giving steel plant leadership the visibility needed to drive operational improvement.
per hour cost of unplanned production stoppages at a typical integrated steel plant [citation:2]
40%
maintenance cost reduction possible by moving from calendar-based to condition-based maintenance [citation:5]
86%
improvement in wrench time when maintenance teams have visibility into their performance metrics [citation:11]
47
key performance indicators tracked by leading steel facilities for maintenance performance [citation:11]
$2M+
In annual maintenance cost savings through dashboard-driven performance visibility at a major steel producer — by tracking corrective-to-preventive ratios, MTBF trends, and PM compliance, maintenance leadership identified and eliminated root causes of chronic equipment failures [citation:2].
Maintenance Dashboard Components — What You Need to Track
Dashboard KPIs · 5 Critical Categories
Steel Plant Maintenance KPIs
Availability
OEE — Overall Equipment Effectiveness
Mechanical availability by asset
Downtime rate (%)
Rolling mill availability
Reliability
MTBF — Mean Time Between Failures
MTTR — Mean Time To Repair
Failure frequency by asset
Repeat fault patterns
Cost
Maintenance cost per tonne
PM vs CM cost ratio
MRO inventory turnover
Contractor spend ratio
Compliance
PM completion rate
Schedule compliance
Corrective work percentage
Work order backlog
Benchmark Your Facility — Industry Performance Standards
Cost Benchmarks
Top-quartile facilities achieve maintenance costs below $12 per tonne of crude steel production, while bottom-quartile facilities exceed $24 per tonne — a 2x differential that translates to tens of millions of dollars annually [citation:11].
Availability Benchmarks
Top performers achieve OEE above 85%, rolling mill availability above 94%, and BF/EAF mechanical availability above 96%. Bottom performers lag significantly — below 65% OEE and below 86% rolling mill availability [citation:11].
Top performers achieve PM completion rates above 95% and planned work percentages above 85%. Bottom-quartile facilities fall below 75% PM completion and below 55% planned work [citation:11].
Dashboard Implementation Roadmap — From Data to Decision
OxMaint Dashboard Implementation · 4-Phase Process
Phase 1
Define KPIs
Identify the 10-15 metrics that matter most for your facility. Prioritize availability (OEE, downtime), reliability (MTBF, MTTR), cost ($/tonne, PM/CM ratio), and compliance (PM completion, backlog) [citation:9].
→
Phase 2
Establish Baseline
Capture current performance data for each KPI over 3-6 months. Compare against industry benchmarks to identify improvement opportunities. Top-quartile performance establishes the target for each metric [citation:11].
→
Phase 3
Configure Dashboards
Build role-specific views — plant manager sees cost and OEE trends, maintenance supervisor sees work order status and PM compliance, technicians see their assigned tasks and completion metrics [citation:4].
→
Phase 4
Drive Action
Use dashboard visibility to identify improvement areas. Track MTTR reduction, wrench time improvement, and cost per tonne. Review metrics in weekly maintenance meetings to drive accountability [citation:11].
OxMaint · Steel Plant · Maintenance Dashboards
Visibility Drives Performance. Start Tracking Your Metrics Today.
OxMaint provides out-of-the-box maintenance dashboards with industry benchmarks — showing you where you stand and where improvement opportunities exist.
OxMaint Dashboard Capabilities — From Raw Data to Actionable Intelligence
Real-Time Availability Dashboard
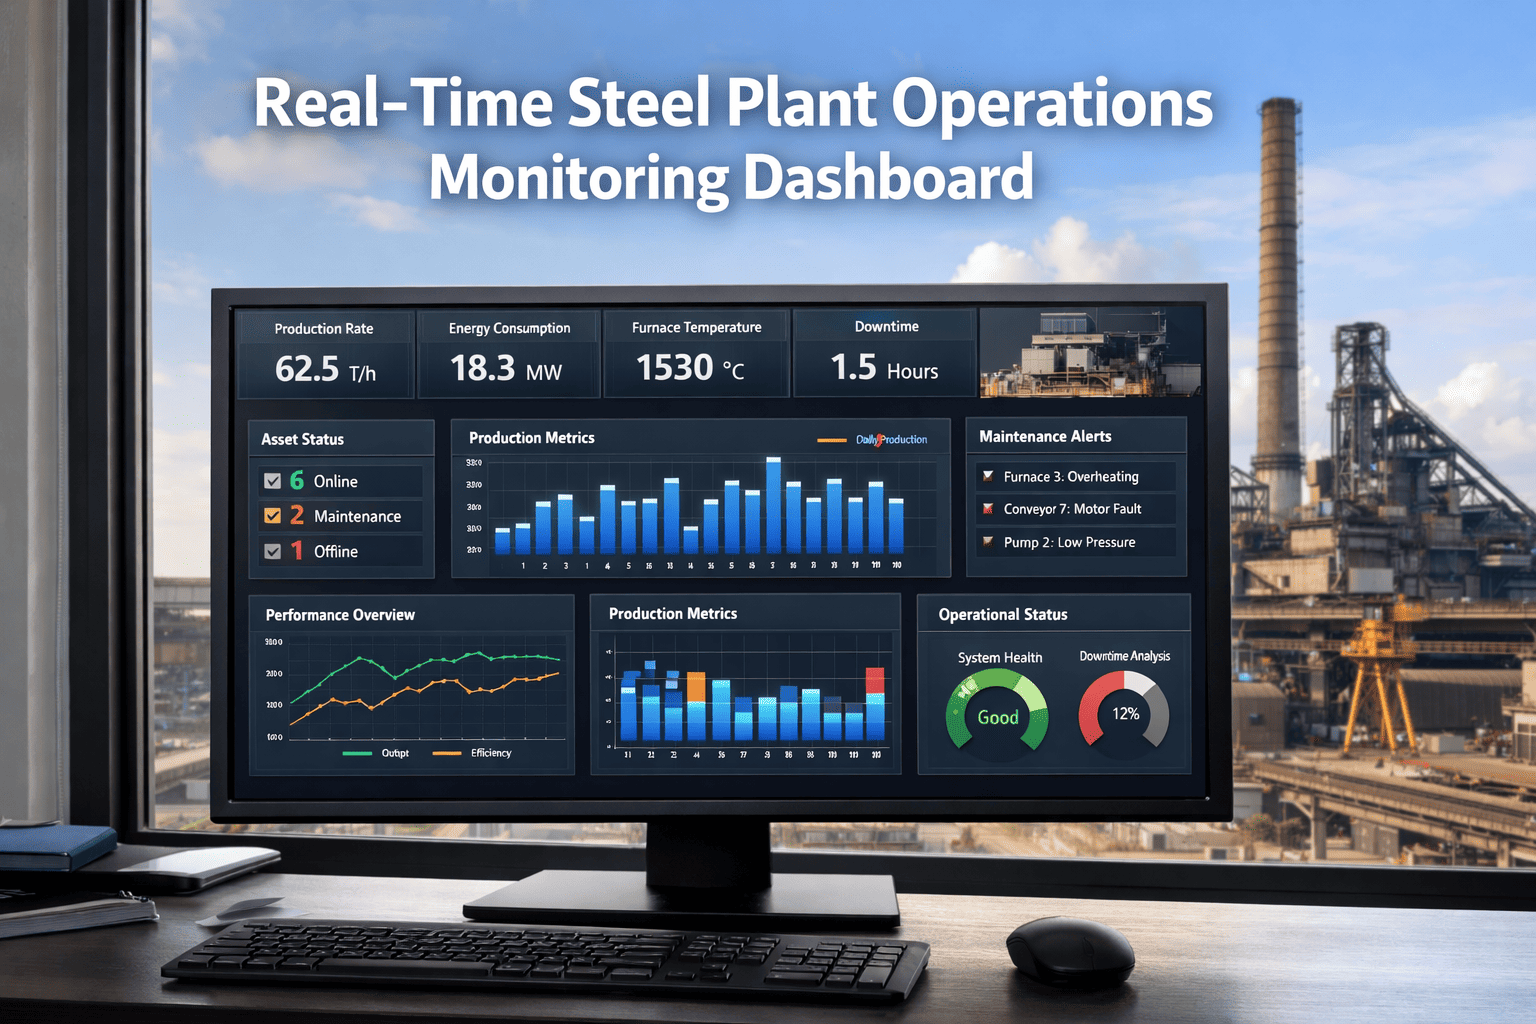
Visualize equipment status, downtime reasons, and availability trends across your steel plant. Color-coded indicators show running, idle, stopped, and breakdown status. Drill down to specific assets for detailed performance history [citation:4].
Reliability Trend Analysis
Track MTBF and MTTR trends over time. Identify assets with declining reliability, repeat fault patterns, and opportunities for root cause analysis. Historical data shows whether maintenance improvements are delivering results [citation:12].
Cost Performance Dashboard
Monitor maintenance cost per tonne, PM vs CM cost ratio, and MRO inventory turnover. Compare performance against industry benchmarks — top quartile ($12/t) vs bottom quartile ($24/t) — to identify cost reduction opportunities [citation:11].
PM Compliance & Work Order Health
Track PM completion rates, schedule compliance, corrective work percentage, and backlog trends. View compliance by asset, area, or technician. Early warning flags for departments falling below target [citation:11].
Role-Specific Views
Plant managers see cost and OEE trends. Maintenance supervisors monitor work order status, backlog, and compliance. Technicians view assigned tasks, completion history, and individual performance metrics [citation:4].
Benchmark Analytics
Automatically compare your facility's performance against anonymized industry data from 200+ steel facilities. See where you rank and identify the biggest improvement opportunities [citation:11].
Critical Downtime Categories — What Your Dashboard Must Track
Downtime Source · Electrical
Transformer & Switchgear Failure
Electrical equipment accounts for approximately 30-35% of unplanned downtime in steel plants. Dashboard visibility into transformer health, switchgear status, and electrical failure patterns is critical to preventing cascading power outages [citation:12].
33%
downtime share
€100K
cost per hour
Downtime Source · Mechanical
Mechanical Breakdowns
Conveyor jams, motor failures, and roller breakdowns represent 22% of unplanned downtime. Dashboard tracking of mechanical failure frequency, repair time, and repeat patterns enables targeted preventive programs [citation:12].
22%
downtime share
8h
avg rolling mill jam repair
Downtime Source · Automation
Process Control & Automation Errors
PLC failures, software glitches, and sensor issues represent 18% of downtime. Dashboard visibility into automation-related work orders helps identify systemic issues and guide system upgrades or redundancy planning [citation:12].
18%
downtime share
7h
avg PLC failure repair
Without Dashboard vs With OxMaint Dashboard — The Performance Difference
Without Performance Dashboard
Decision makingIntuition — limited data
KPI visibilityMonthly reports — already stale
Improvement trackingUncertain — can't measure
MTTRUnknown — no measurement
Cost per tonne$18+ — no visibility
VS
OxMaint Dashboard
Decision makingData-driven — real-time visibility
KPI visibilityLive dashboards — always current
Improvement trackingClear — trend lines show progress
MTTRMeasured & improving
Cost per tonne$12+ — top quartile performance
Dashboard Metrics — Performance Standards by KPI
KPI Category
Top Quartile
Median
Bottom Quartile
Business Impact
Cost per Tonne
$12
$15-18
$24
2x cost differential
OEE
85%
75-80%
65%
20%+ capacity loss
MTBF
720 hrs
400-550 hrs
250 hrs
3x reliability gap
MTTR
2.5 hrs
4-6 hrs
10 hrs
4x repair time difference
PM Completion Rate
95%
85-90%
75%
20% compliance gap
Planned Work %
85%
70-78%
55%
30% reactive gap
55%
reduction in breakdown frequency achieved when maintenance teams have visibility into performance metrics and reliability trends [citation:12]
83%
effective capacity increase possible when wrench time improves from 30% to 55% through better visibility and planning [citation:11]
40%
maintenance cost reduction documented by moving from calendar-based to data-driven condition-based maintenance [citation:5]
"Before we had visibility into our maintenance metrics, we were flying blind. We knew we had reliability problems but couldn't see where to focus. OxMaint's dashboards changed everything — we tracked MTTR by asset, identified our worst performers, and prioritized improvement efforts. Within 12 months, our rolling mill availability improved from 86% to 93% — and we increased production capacity by 7% without capital investment."
What maintenance KPIs should a steel plant track on its dashboard?
The most critical KPIs fall into four categories: availability (OEE, downtime rate, asset availability), reliability (MTBF, MTTR, failure frequency), cost (maintenance cost per tonne, PM vs CM cost ratio, MRO inventory turnover), and compliance (PM completion rate, schedule compliance, work order backlog). Leading steel facilities track 47 KPIs across these categories [citation:11].
How do I benchmark my steel plant's maintenance performance against industry standards?
OxMaint provides automatic benchmarking against anonymized data from 200+ steel facilities worldwide. Key benchmarks include cost per tonne (top quartile: $12/t, bottom quartile: $24/t), OEE (top: 85%, bottom: 65%), MTBF (top: 720+ hrs, bottom: <250 hrs), and MTTR (top: <2.5 hrs, bottom: >10 hrs) [citation:11].
How does a maintenance dashboard improve wrench time and technician productivity?
When maintenance teams have visibility into work order completion rates, backlog trends, and individual performance metrics, wrench time improves dramatically. Facilities with wrench time below 30% lose over 70% of technician hours to non-productive activities. Top performers achieve 55%+ wrench time — effectively increasing capacity by 83% without adding headcount [citation:11].
What role does real-time data play in a maintenance dashboard?
Real-time data from IoT sensors, PLCs, and machine controllers enables immediate visibility into equipment status, downtime events, and performance trends. Steel plants with comprehensive monitoring have documented 40-60% reduction in transformer-related unplanned outages and significant improvements in maintenance cost [citation:12].
How do I get started implementing a maintenance metrics dashboard?
Start by identifying the 10-15 KPIs that matter most for your facility. Establish baseline performance over 3-6 months. Compare against industry benchmarks to identify improvement opportunities. Then configure role-specific dashboards for plant managers, maintenance supervisors, and technicians. OxMaint provides out-of-the-box dashboards with benchmark comparisons included [citation:11].
Every KPI Visible. Every Trend Tracked. Every Decision Data-Driven.
Deploy OxMaint maintenance dashboards across your steel facility — gain visibility into asset performance, benchmark against industry standards, and drive operational improvement. Start free today.