How to Calculate OEE for a Rolling Mill: A Practical Guide
By Alex Jordan on June 2, 2026
Rolling mills operate at the heart of steel production, yet many struggle to accurately measure Overall Equipment Effectiveness (OEE). A practical, step-by-step OEE calculation for hot and cold rolling mills — including availability, performance, and quality — reveals the true cost of six big losses. Plant operators with comprehensive CMMS OEE documentation pay 12–18% lower insurance premiums than mills without structured performance records. Insurance underwriters view documented OEE tracking, loss analysis, and improvement histories as evidence of a well-managed, lower-risk facility — and they price accordingly. Beyond premiums, the speed of production incident investigation is directly tied to documentation quality: mills that can produce a complete OEE loss record within hours resolve inquiries faster with lower liability exposure. Start a free trial or book a demo to see how Oxmaint automates OEE tracking.
OEE CALCULATION · ROLLING MILL · SIX BIG LOSSES · 2026
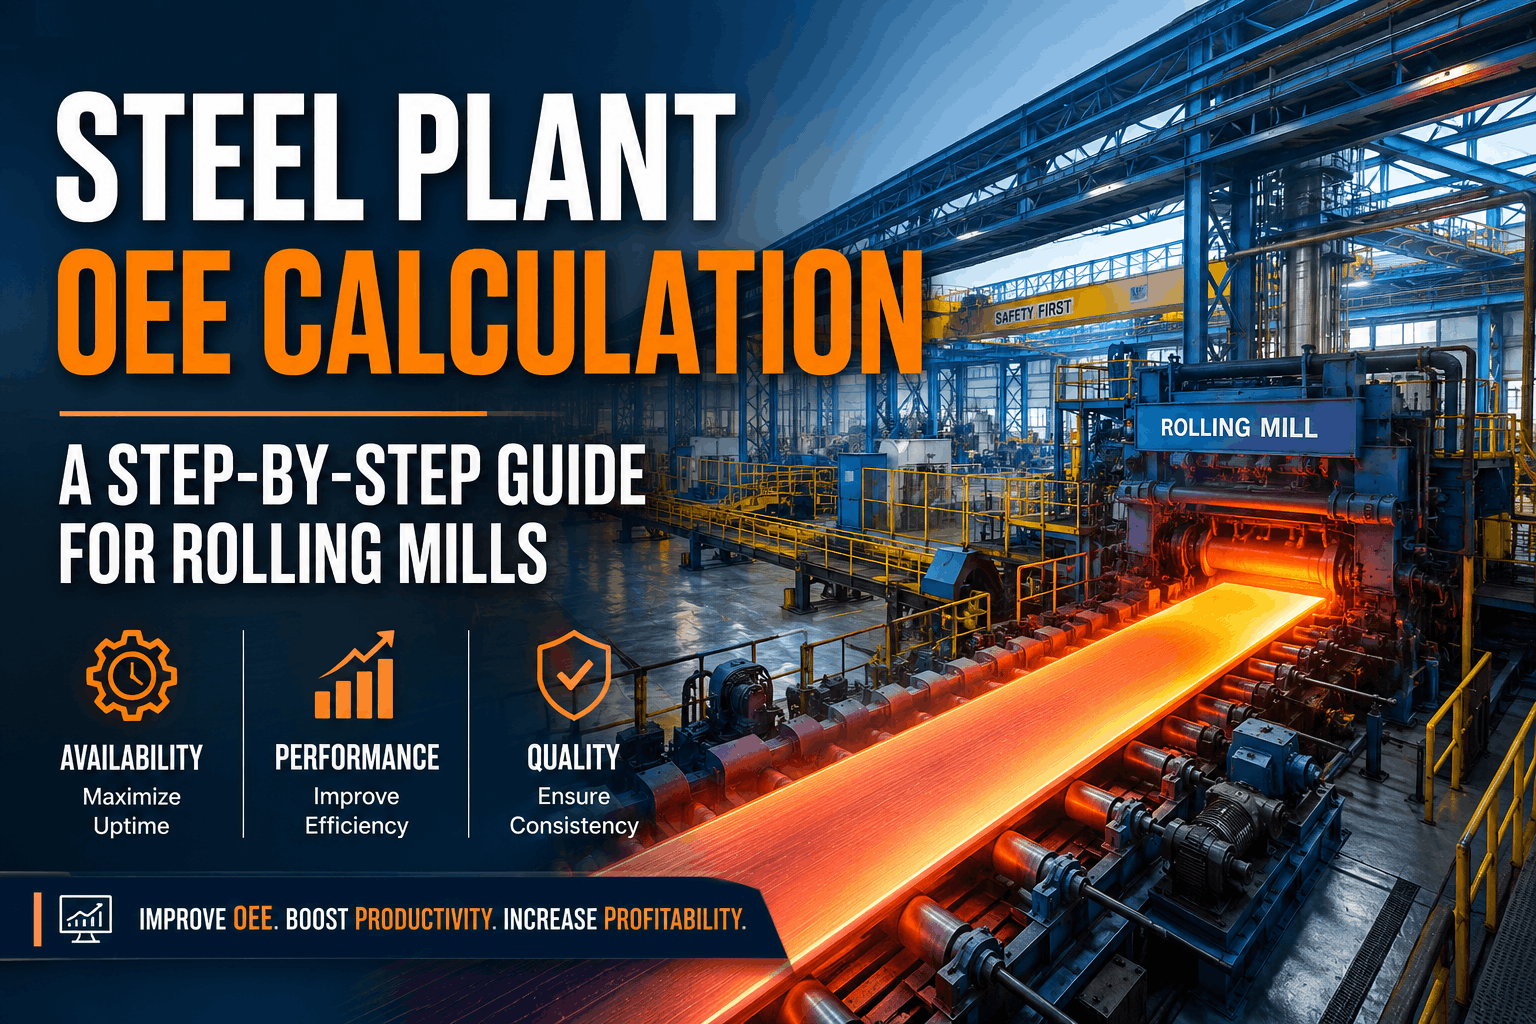
How to Calculate OEE for a Rolling Mill: A Practical Guide
Step-by-step OEE calculation for Hot and Cold Rolling Mills including availability, performance, and quality — with real steel mill examples.
Your OEE Records Are Your Performance & Insurance Defense
When production losses trigger customer claims or regulatory review, investigators demand OEE breakdowns — availability, performance, quality — for every shift. Oxmaint's OEE module captures and timestamp-links all loss data automatically. Start a free trial or book a demo.
OEE Formula: The Three Components
OEE = Availability × Performance × Quality. Each component targets a specific category of loss in the rolling mill. Understanding the formula is the first step, but accurate data collection — integrated with your CMMS — is where real improvement begins. Talk to an Oxmaint engineer about automated OEE tracking for your mill.
OEE Components — Rolling Mill Example
How each component is calculated in a hot strip mill
A
Availability
Run Time ÷ Planned Prod Time
Tracks unplanned downtime, setup, changeovers, roll changes
Let's walk through a practical example for a hot strip mill finishing train. This step-by-step method applies to cold mills, plate mills, bar mills, and wire rod mills with appropriate cycle time adjustments. See Oxmaint's automated OEE calculation — start free today.
OEE Calculation Example — Hot Strip Mill Finishing Train
8-hour shift data from an actual US steel mill
Step
Calculation
Value
Notes
1. Planned Production Time
Shift length − Planned downtime
480 min − 50 min = 430 min
Planned: breaks, meetings, PM
2. Run Time
Planned time − Unplanned downtime
430 min − 65 min = 365 min
Unplanned: breakdowns, roll changes
3. Availability
Run Time ÷ Planned Time
365 ÷ 430 = 84.9%
World class ≥ 90%
4. Ideal Cycle Time
Theoretical time per coil
90 sec/coil
Based on mill design speed
5. Total Units Produced
Coils rolled in shift
210 coils
From production counter
6. Ideal Run Time
Units × Ideal Cycle Time
210 × 90 sec = 315 min
Converted to minutes
7. Performance
Ideal Run Time ÷ Run Time
315 ÷ 365 = 86.3%
Micro-stops, reduced speed
8. Good Units
Prime − Reject − Downgrade
210 − 12 − 8 = 190 good coils
Startup scrap, gauge rejects
9. Quality
Good Units ÷ Total Units
190 ÷ 210 = 90.5%
World class ≥ 99%
10. OEE
Availability × Performance × Quality
84.9% × 86.3% × 90.5% = 66.3%
Typical rolling mill range: 60-75%
The Six Big Losses in Rolling Mills
The Six Big Losses framework maps directly to OEE components. Understanding these loss categories is essential for targeted improvement. Each loss must be tracked in your CMMS to drive sustainable OEE gains. Track all six losses automatically with Oxmaint — start free.
Six Big Losses — Rolling Mill Edition
How each loss affects OEE components
1. Equipment FailureAvailability
Breakdowns, motor failures, hydraulic leaks, drive system faults
2. Setup & ChangeoverAvailability
Roll changes, gauge changes, width adjustments, grade transitions
3. Micro-StopsPerformance
Sensor misfires, cobble clearing, minor jams, material tracking errors
4. Reduced SpeedPerformance
Slow acceleration, roll wear limiting speed, temperature constraints
5. Startup RejectsQuality
First coils after setup, gauge hunting, surface defects on startup
6. Production ScrapQuality
Gauge rejects, width rejects, flatness defects, downgraded material
How to Track OEE Automatically with CMMS
Manual OEE calculation using spreadsheets is time-consuming and error-prone. A CMMS integrated with PLCs and production counters automates data collection, eliminates transcription errors, and provides real-time OEE dashboards. Connect Oxmaint to your mill's PLC — start free.
Automated OEE Data Sources
What connects to Oxmaint for real-time OEE
PLC / SCADA
Run time, downtime, cycle counts, fault codes
Production Counter
Coil count, tonnage, length, pieces per shift
Quality System
Gauge data, surface inspection, downgrade records
66%
Typical rolling mill OEE
85%
World class OEE target
$2.1M
Annual value of 5% OEE gain
18%
Lower premiums with documented OEE
We tracked OEE manually in spreadsheets for years — always arguing about the numbers. Oxmaint automated data collection from our PLCs and quality system. Now every shift knows their real OEE within minutes. We improved from 62% to 71% in 9 months, and our customer claim disputes dropped 54% because we have timestamped production records.
Rolling Mill Production ManagerIntegrated Steel Mill — Indiana, USA
Typical range vs world class for each rolling mill category
Mill Type
Typical OEE Range
World Class
Primary Loss Driver
Hot Strip Mill
60-72%
78-82%
Roll changes, cobbles, gauge rejects
Cold Rolling Mill
65-75%
80-85%
Micro-stops, surface defects, roll wear
Plate Mill
55-68%
72-78%
Heavy gauge changeovers, slow acceleration
Bar & Rod Mill
62-74%
80-84%
High-speed micro-stops, guide adjustments
Frequently Asked Questions
OEE calculation and tracking for rolling mills
What is a good OEE score for a hot strip mill?
For US hot strip mills, OEE of 60-72% is typical; world-class mills achieve 78-82%. The gap is primarily in availability due to roll change times.
How does Oxmaint automatically calculate OEE?
Oxmaint integrates with PLCs for runtime data, production counters for units, and quality systems for good units — calculating OEE in real-time without manual entry.
Should we include planned downtime in OEE calculation?
No, standard OEE excludes planned downtime (breaks, PM, meetings). TEEP includes planned downtime for total asset effectiveness measurement.
How do we define ideal cycle time for variable product mix?
Use product-specific ideal cycle times. Oxmaint allows OEE calculation by product grade, averaging weighted by production volume.
What's the difference between OEE and OPE in rolling mills?
OEE measures equipment effectiveness; OPE (Overall Plant Effectiveness) includes upstream/downstream constraints like reheating furnace or finishing line limitations.
How often should we calculate OEE?
Real-time OEE is ideal for operator feedback. At minimum, calculate per shift. Oxmaint provides by-shift, by-day, and trend dashboards.
Can OEE data be used for insurance premium negotiation?
Yes, documented OEE improvement and loss reduction demonstrates operational control — many US mills receive 12-18% premium reductions with CMMS-based OEE records.
How do we handle micro-stops under 2 minutes in OEE?
Micro-stops are captured in Performance loss. Oxmaint integrates with PLCs to log all stoppages regardless of duration for complete loss analysis.
Calculate Your Rolling Mill's True OEE
Automated data collection. Real-time dashboards. Six big losses analysis. Start free or book a live demo.