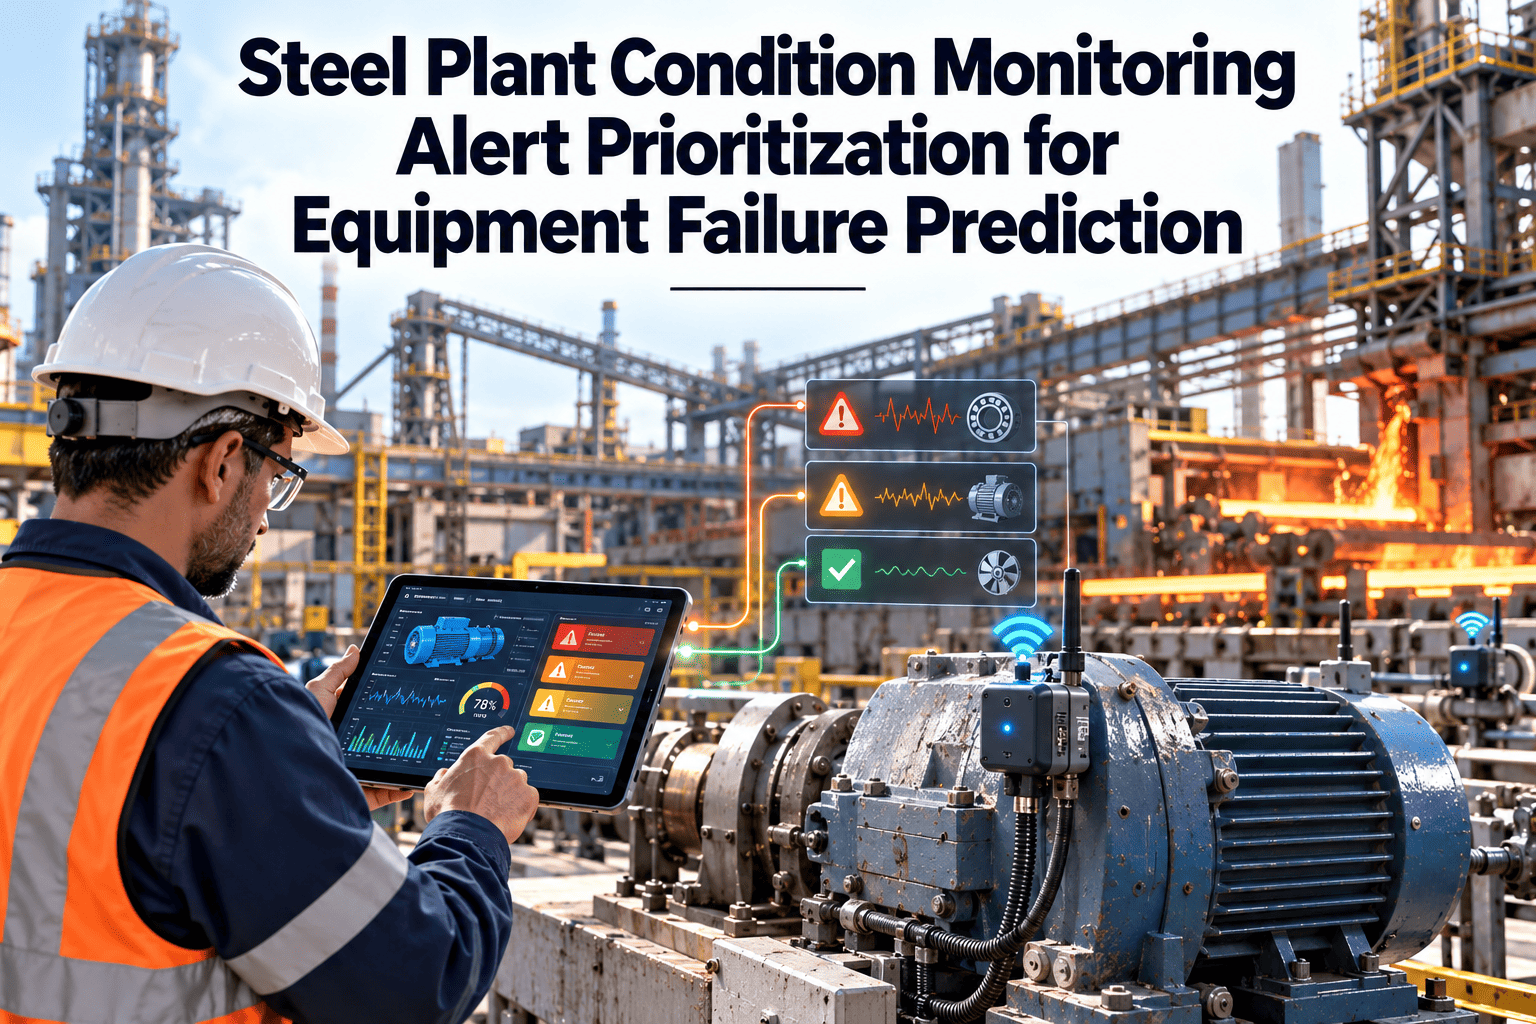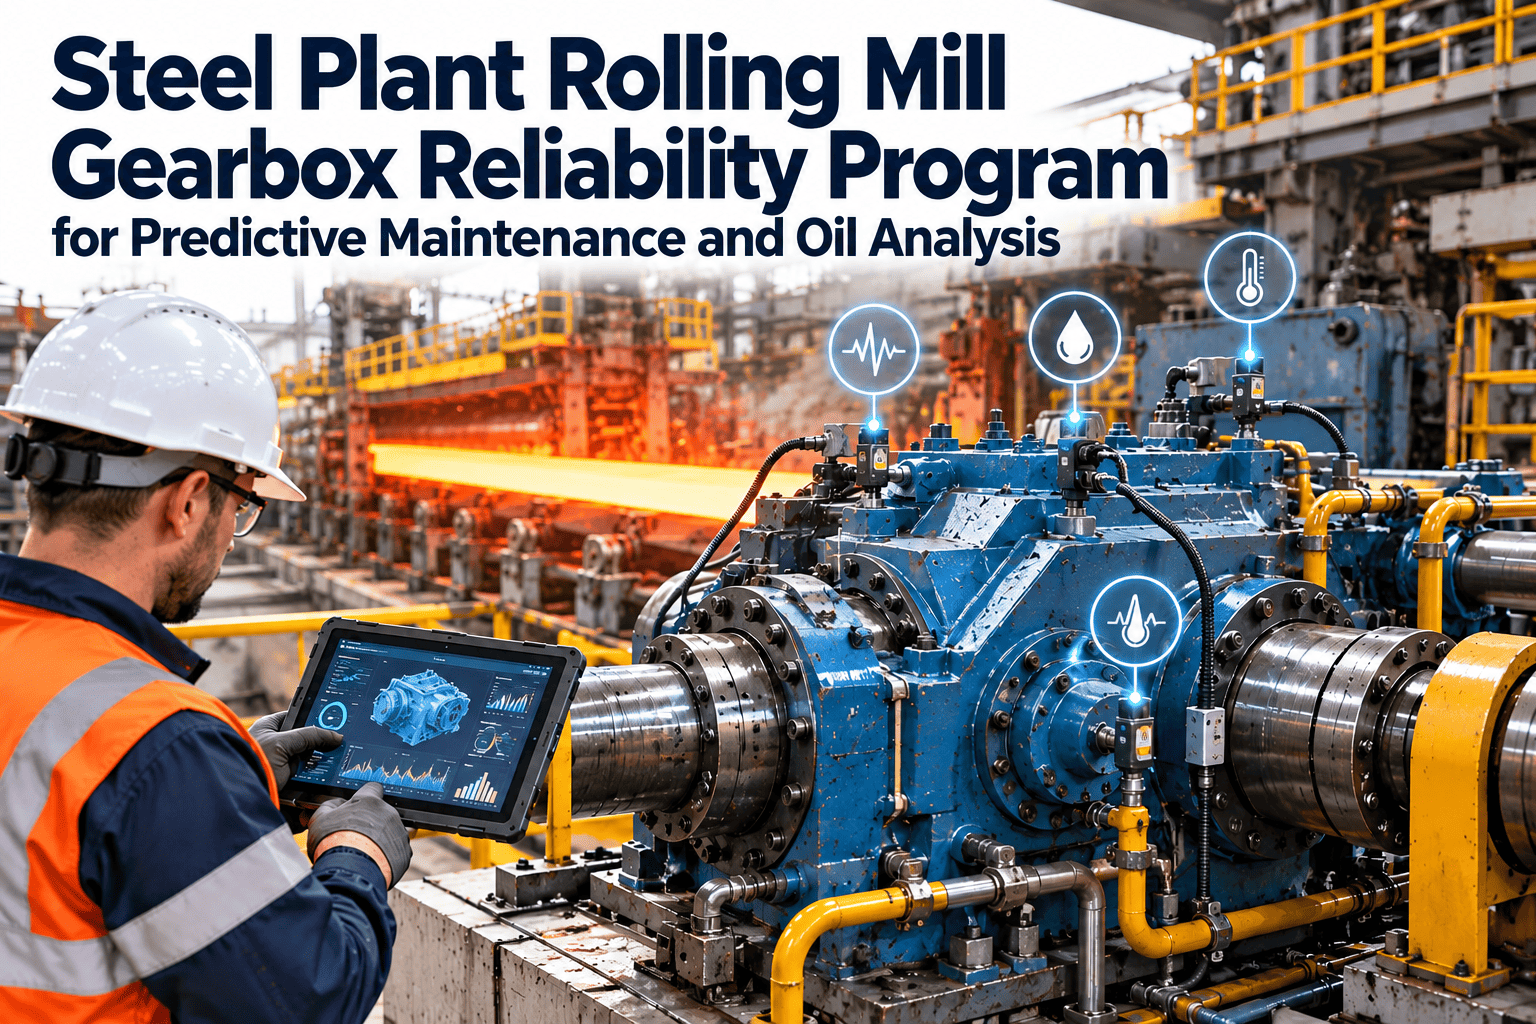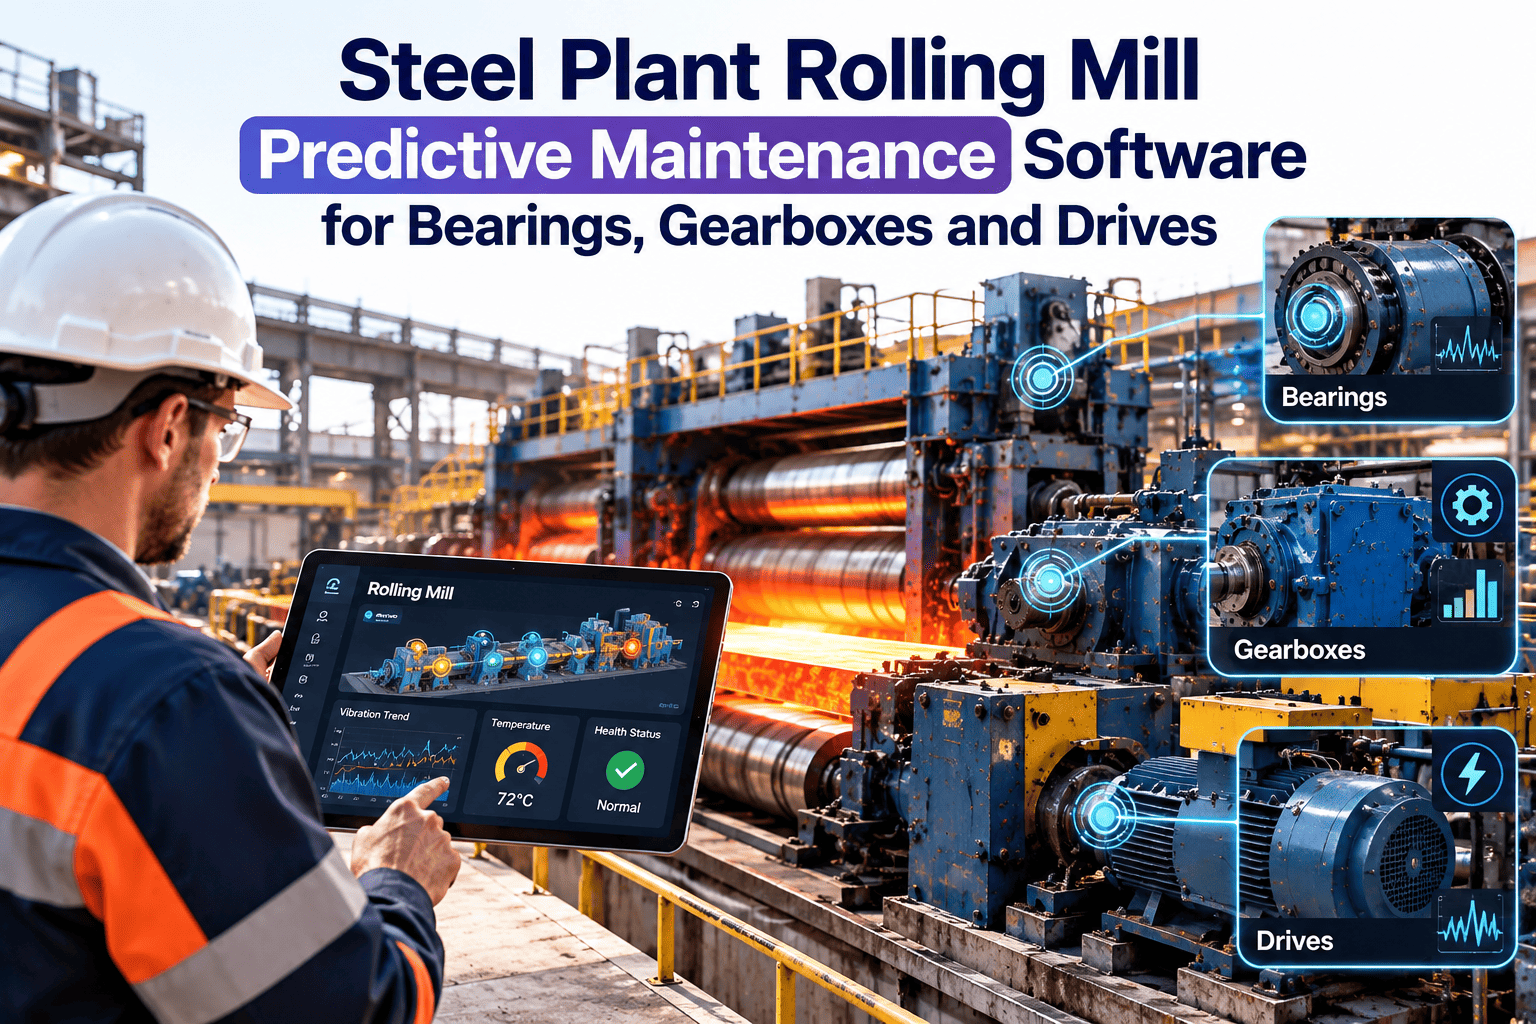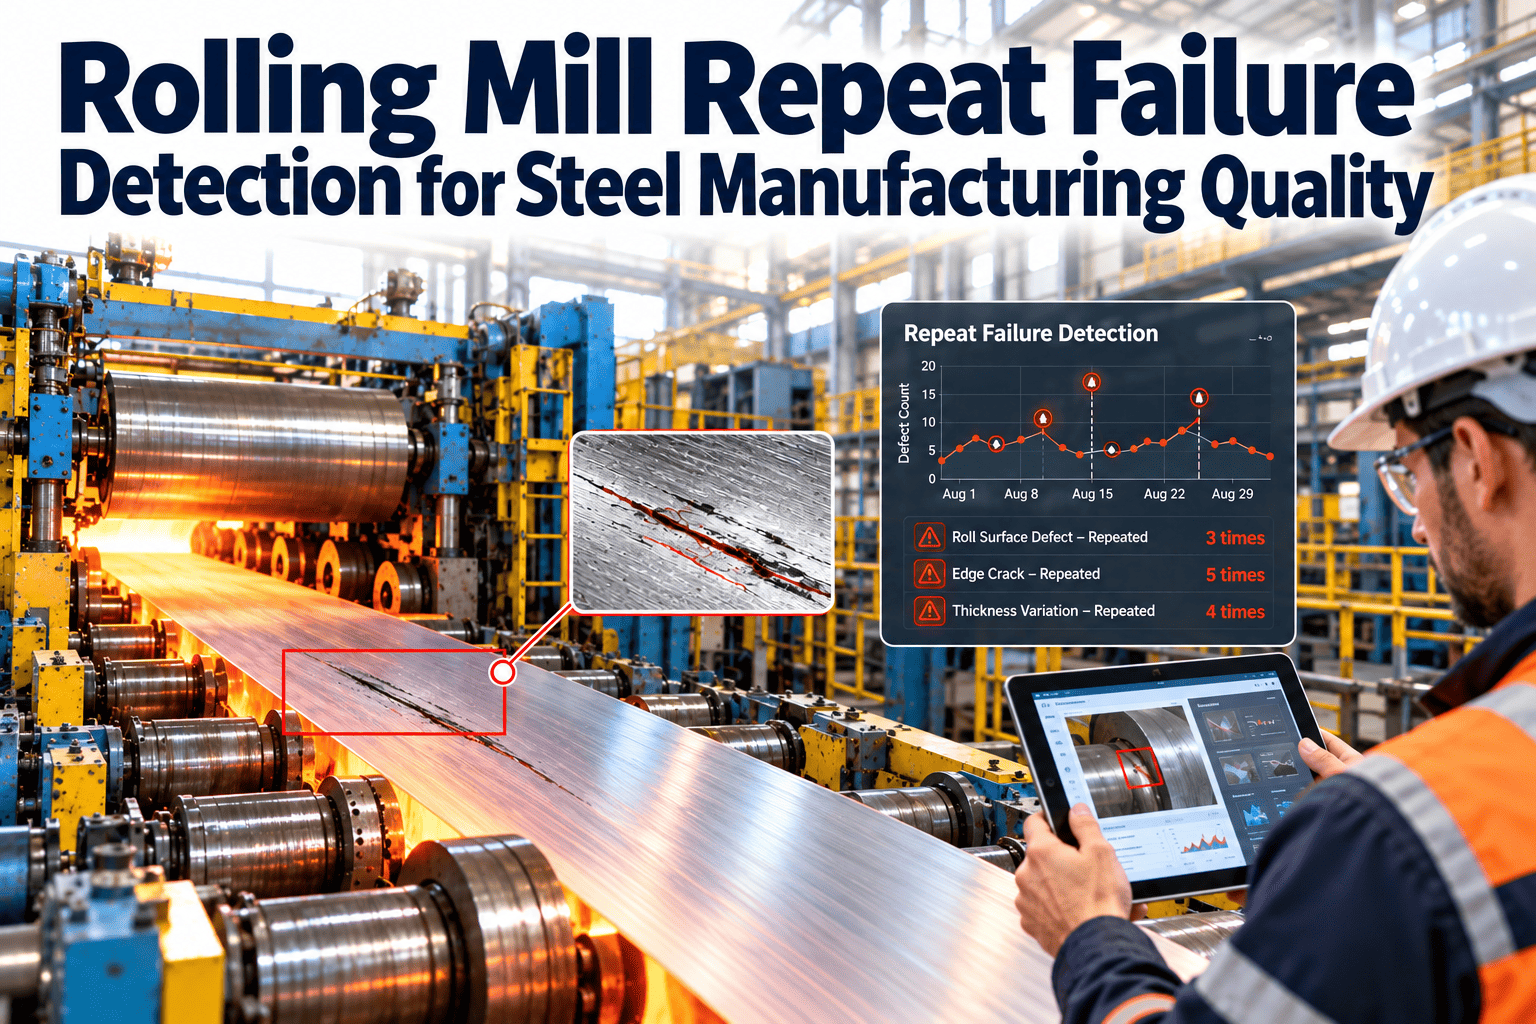
A rolling mill bearing rarely fails without warning. Vibration changes, temperatures drift, and load history quietly accumulates long before a chock runs hot or a roll neck seizes. The difficulty is that these signals sit in different systems, and nobody connects them to a maintenance decision in time. Steel plants that treat rolling mill bearing failure prediction as one connected workflow can schedule chock changes into planned outages instead of reacting to a stopped stand. This guide explains which signals matter, how to read them, and how a steel mill maintenance software workflow turns them into planned work.
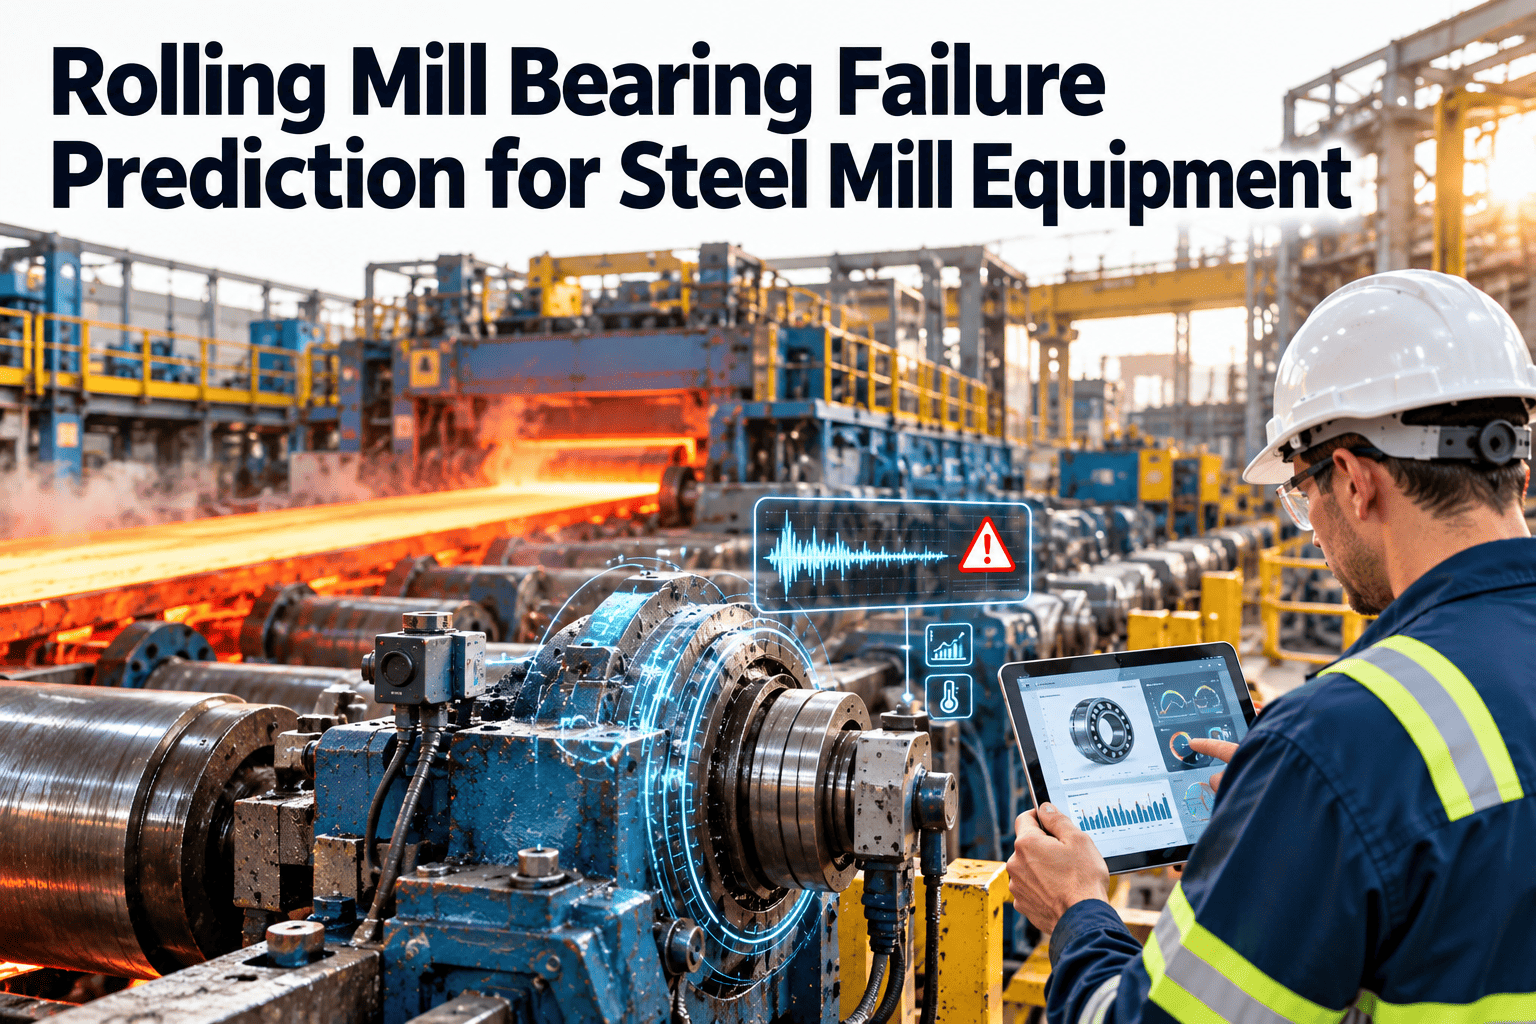
Rolling Mill Bearing Failure Prediction for Steel Mill Equipment
Combine vibration spectra, temperature trends, load history, and failure-code analytics to catch bearing degradation early and plan the replacement before the stand stops.
Why Rolling Mill Bearings Are Hard to Keep Alive
Mill stands combine heavy radial loads, shock at strip entry, water, scale, and high roll neck temperatures in one small assembly.
- Work roll and backup roll chocks carry loads that change with every pass, every schedule, and every product width.
- Cooling water and mill scale attack seals, and any water in the lubricant shortens bearing life quickly.
- Cobbles, mill wrecks, and heavy reductions add impact loads that never appear on a calendar.
- Roll changes disturb chock fit, alignment, and seals many times per year.
Bearing types you will meet on a mill
| Location | Typical bearing | Main stress | Common concern |
|---|---|---|---|
| Work roll chock | Four-row tapered roller | Radial load, axial thrust, bending | Spalling, seal wear, heat |
| Backup roll chock | Oil-film or four-row tapered | Very high radial load | Film breakdown, contamination |
| Pinion and gearbox | Cylindrical and tapered roller | Torque, gear mesh forces | Fatigue, lubrication starvation |
| Motor and coupling | Ball and roller | Speed, misalignment | Electrical fluting, looseness |
| Auxiliary rolls and tables | Spherical roller | Heat, scale, shock | Grease loss, seizure |
Failure Modes and Their Early Signals
Each failure mode leaves a different fingerprint. Matching the fingerprint to the cause decides whether the fix is a bearing, a seal, or a process change.
| Failure mode | Usual root cause | Earliest signal | Best confirming check |
|---|---|---|---|
| Rolling contact fatigue | Overload, long service, heavy reductions | Outer race defect tones in envelope spectrum | Load history and hours on the assembly |
| Lubricant contamination | Seal wear, water ingress, scale | Broadband noise, oil or grease sample changes | Sample results and seal inspection |
| Lubricant starvation | Blocked lines, wrong interval, pump faults | Temperature rise with rising high-frequency energy | Flow check and line inspection |
| Misalignment or fit problems | Chock wear, poor reassembly | Elevated 1x and 2x running speed | Chock and neck measurements |
| Shock damage | Cobble, wreck, entry impact | Sudden step in vibration after an event | Event log and failure code entry |
| Electrical damage | Bearing current in drive motors | Fluting patterns, high-frequency noise | Grounding and drive checks |
The Four Signal Layers That Make Prediction Work
No single measurement is reliable on a mill. Confidence comes from agreement between layers.
Reading vibration spectra on a mill
- Bearing defect frequencies (outer race, inner race, rolling element, and cage) are calculated from bearing geometry and shaft speed.
- Envelope or demodulation analysis brings out repetitive impacts that ordinary overall vibration hides.
- Rolling mills run at low and variable speed, so long sampling times and order-based analysis are often needed.
- Always compare readings taken at similar speed and load, not at random moments in the schedule.
- Trend the amplitude of each defect family over weeks, not just the latest reading.
Using temperature the right way
Absolute temperature limits catch only late damage. A better signal is the difference between a chock and its neighbours, or between today and the same stand's baseline at similar load and coolant flow.
- Track the rate of rise after a roll change, when fit and lubrication faults show first.
- Separate process heat from bearing heat by comparing strip temperature and cooling water conditions.
- Treat a temperature rise together with a rising vibration trend as a much stronger case than either alone.
From First Defect to Failure: The Warning Window
The gap between detectable degradation and functional failure is where prediction earns its value. It varies with load and lubrication, so treat every stage as an action point.
Load History: The Missing Half of Bearing Life
Two identical bearings on two stands can wear at very different rates. Load history explains the difference.
- Log tonnes rolled, rolling force, and torque against each chock assembly rather than only against the stand.
- Record every cobble, wreck, and overload event against the affected assembly.
- Note product mix, because heavier gauges and harder grades consume bearing life faster.
- Use the assembly's cumulative load to set inspection frequency instead of a fixed calendar.
Why the assembly, not the stand, is the asset
Chocks move between stands and rolls move between chocks. If records follow the stand, the bearing's real history is lost every time a chock is swapped.
Give Every Chock a Maintenance History You Can Trust
Track bearing assemblies, inspections, and work orders in one place, and see which stands need attention before the next outage.
Failure-Code Analytics: Turning Repairs Into Evidence
Prediction improves when every repair explains itself. Free-text notes such as "bearing changed" hide the answer.
- Bearing replaced, no cause recorded
- Stand name only, no chock or roll reference
- No link to the vibration alert that preceded it
- Lubricant and seal condition ignored
- Failure mode, cause, and location coded consistently
- Bearing serial number and installed hours captured
- Alert, inspection, and repair linked in one history
- Findings such as water ingress or seal wear recorded
Questions good codes can answer
- Which stand position repeats the same failure mode?
- Do failures cluster after specific roll change crews or procedures?
- Is a supplier batch or a seal type over-represented?
- How many hours did failed bearings actually run, and how does that compare with planned life?
Deciding What to Do: A Bearing Risk Matrix
Use the same matrix on every stand so that planners, operators, and reliability engineers make consistent calls.
| Condition | Low consequence stand | High consequence stand |
|---|---|---|
| Stable, within baseline | Routine PM | Routine PM, trend monthly |
| Early defect tone, no heat | Monitor weekly | Inspection work order, shorten interval |
| Growing defect and rising temperature | Plan change at next stop | Book change, reserve spares now |
| Sudden step after shock event | Inspect before restart | Inspect before restart, consider replacement |
Turning Prediction Into Planned Work in Oxmaint
A prediction only matters when it becomes a scheduled job with parts and people ready.
Preventive tasks that support prediction
- Lubrication routes with quantities, intervals, and sample points.
- Seal and cooling water checks after every roll change.
- Chock and neck fit measurements at defined intervals.
- Alarm and sensor verification so the data feeding decisions stays trustworthy.
- Roll shop bearing rebuild records tied to serial numbers.
KPIs to Prove the Program Works
Measure outcomes and behaviour together. Start with a baseline from your own records.
Reactive Versus Predictive Bearing Management
| Area | Reactive | Predictive workflow |
|---|---|---|
| Trigger | Hot chock or stopped stand | Trended vibration, temperature, and load |
| Timing | Whenever it fails | Planned outage or roll change |
| Parts | Urgent search or expedite | Reserved in advance |
| Records | Scattered notes | Coded history on the assembly |
| Learning | Depends on who remembers | Patterns visible across stands |
Implementation Checklist for a Steel Mill
Start small on the stands where bearing failure hurts most, then expand.
- Rank stands and drives by production consequence and past failure cost.
- Build an asset hierarchy that includes chocks and bearing assemblies, not just stands.
- Agree failure codes for mode, cause, and location before the first repair is logged.
- Set baselines for vibration and temperature at defined speed and load conditions.
- Define alert thresholds and the work order each one creates.
- Connect spares, lubricants, and seals to the assemblies that use them.
- Review results monthly and adjust thresholds and intervals.
Mistakes That Undermine Prediction
- Trusting one sensor without checking speed, load, and coolant conditions.
- Ignoring lubricant and seal condition while chasing spectrum peaks.
- Tracking the stand instead of the bearing assembly.
- Leaving alerts without an owner or a due date.
- Skipping failure analysis after a repair because the stand is needed back.
Frequently Asked Questions
Which signal predicts rolling mill bearing failure best?
Can low-speed mill bearings be monitored reliably?
How does a CMMS help with bearing prediction?
Should failed bearings be analysed after removal?
Can this be set up for a single mill first?
Plan the Next Chock Change Before the Bearing Decides for You
Bring bearing inspections, readings, spares, and failure history into one maintenance workflow for your rolling mill.