Steel plants often report OEE as a single number, yet the real gains sit in the losses behind it: stops, slow running and off-spec output. Maintenance records explain many of those losses, but they rarely connect to production data. When downtime reasons, work orders and failure history live in separate places, improvement stalls. This guide shows how to link them so OEE becomes a working tool, supported by steel plant maintenance software.
Steel Plant OEE Improvement: Availability, Performance and Quality in One View
Connect downtime reasons to maintenance actions so every OEE loss has an owner and a next step.
Availability
x
Performance
x
Quality
=
OEE
Where Each OEE Loss Comes From
Availability
- Breakdowns and trips
- Changeovers and roll changes
- Waiting for parts or crews
- Overrunning planned shutdowns
Performance
- Reduced speed from worn equipment
- Short stops and jams
- Cooling or drive limits
- Operator workarounds
Quality
- Rework and downgraded product
- Scrap from drifting equipment
- Start-up losses after repairs
- Calibration problems
Before and After: Connecting Maintenance to OEE
Before
- Downtime coded as "other"
- Work orders closed without failure causes
- OEE reviewed monthly, long after events
- Same failures return unnoticed
After
- Each stop has a reason and an asset
- Work orders record cause and action
- Weekly review of top loss items
- Repeat failures flagged for root cause work
Loss to Action Table
| Loss Type | Data Needed | Maintenance Response | KPI |
|---|---|---|---|
| Breakdown | Stop time, asset, failure cause | Corrective work order, root cause review | MTBF, MTTR |
| Slow running | Actual versus rated speed | Inspect drives, bearings, rolls | Performance rate |
| Short stops | Frequency and location | Adjust sensors, guides, settings | Stops per shift |
| Quality loss | Defect type and time | Calibration and alignment tasks | First pass yield |
| Planned stops | Planned versus actual duration | Better job planning, kitting | PM compliance |
Turn OEE Losses Into Work Orders
See how downtime, work orders and asset history can sit in one workflow.
A Weekly OEE Improvement Cycle
Step 1 Rank last week's losses by lost time.
Step 2 Pick the top three and assign owners.
Step 3 Create corrective or preventive work orders.
Step 4 Complete jobs and record causes.
Step 5 Compare results and update PM plans.
Maintenance KPIs Worth Tracking With OEE
MTBF
Time between failures
Time between failures
MTTR
Average repair time
Average repair time
PM compliance
Planned work done on time
Planned work done on time
Backlog
Open work by priority
Open work by priority
Planned ratio
Planned versus reactive work
Planned versus reactive work
Frequently Asked Questions
Does a CMMS calculate OEE?
It supplies downtime and maintenance data that explain OEE losses. Production counts may come from other systems.
It supplies downtime and maintenance data that explain OEE losses. Production counts may come from other systems.
Which loss should be tackled first?
Start with the largest repeated loss by lost time, usually a recurring breakdown.
Start with the largest repeated loss by lost time, usually a recurring breakdown.
How do MTBF and MTTR relate to OEE?
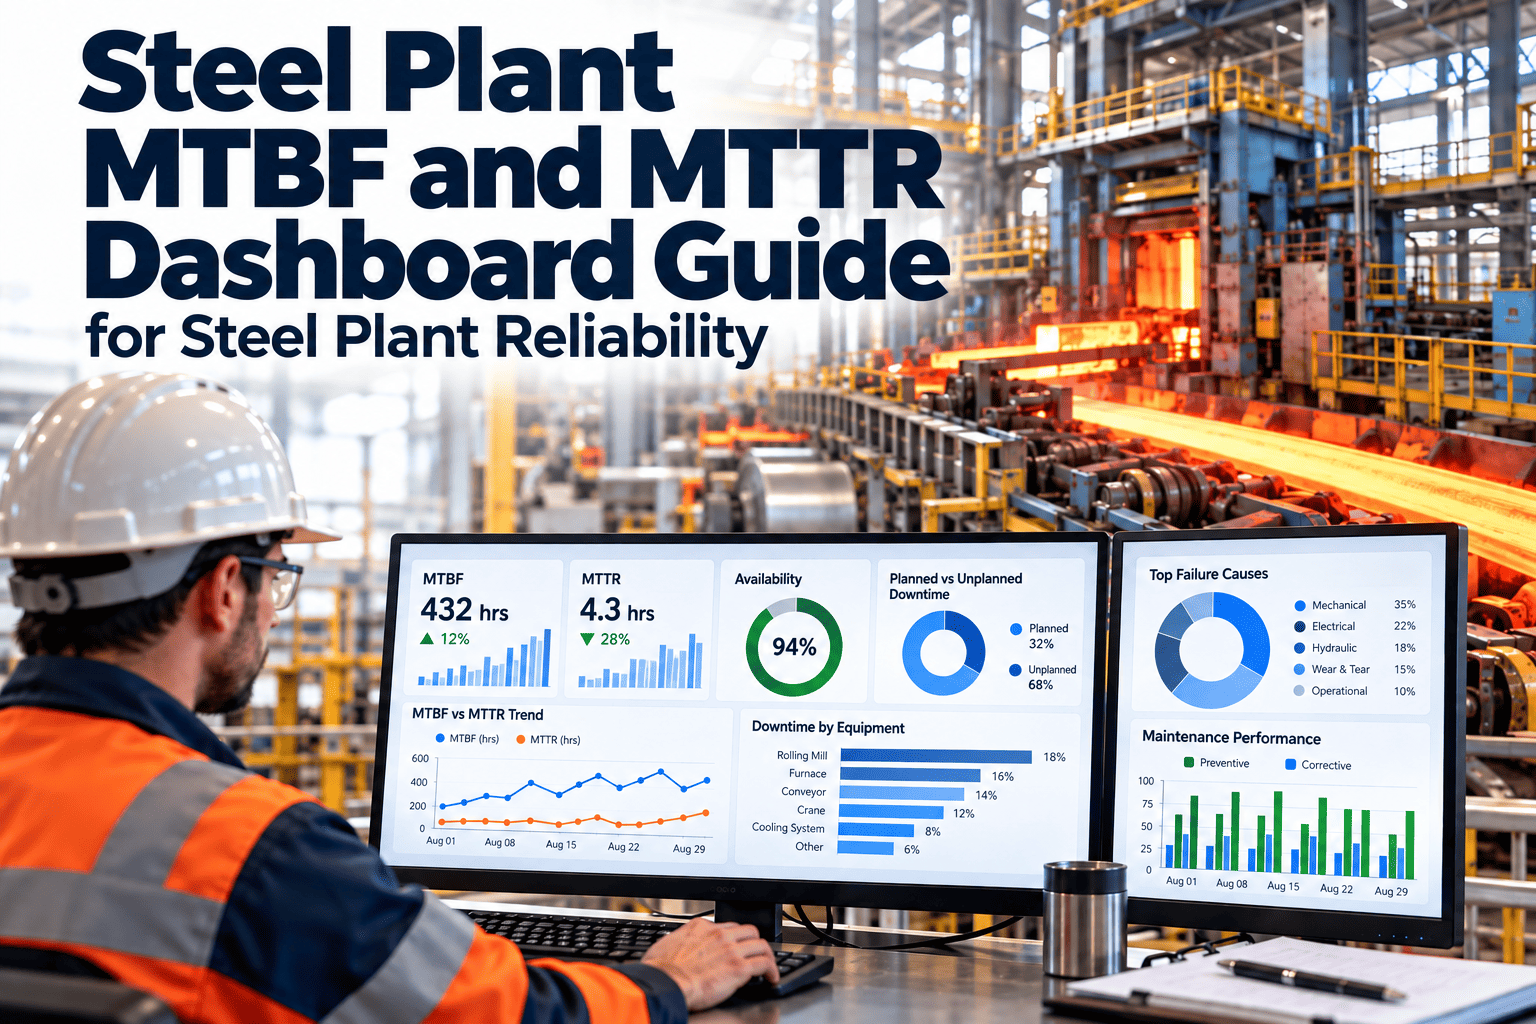
MTBF shows how often stops occur, MTTR how long they last. Both drive availability.
MTBF shows how often stops occur, MTTR how long they last. Both drive availability.
Can dashboards be shared with operations?
Yes. Book a demo to see dashboards and reports.
Yes. Book a demo to see dashboards and reports.
Is it suited to mixed equipment?
Yes. Assets from furnaces to cranes can share one structure.
Yes. Assets from furnaces to cranes can share one structure.
Make OEE Actionable on the Plant Floor
Link every loss to a maintenance action and track the improvement.