When a 3.5 MTPA integrated steel plant's maintenance director sat down with the CFO to explain why the plant had spent 38% of its annual maintenance budget on emergency breakdowns, the honest answer was simple: the plant had no system. Work orders lived on paper. Spare parts inventory was tracked on spreadsheets. PM schedules were in the maintenance manager's head. And the cost per tonne of steel produced kept climbing. Eighteen months after deploying Oxmaint's full CMMS implementation, the same plant had reduced its maintenance cost per tonne by 34%, cut emergency work orders by 58%, and achieved full platform payback in under 11 months. This case study covers exactly how — with the decisions made, the metrics tracked, and the results verified quarter by quarter.
Case Study — Integrated Steel Manufacturing
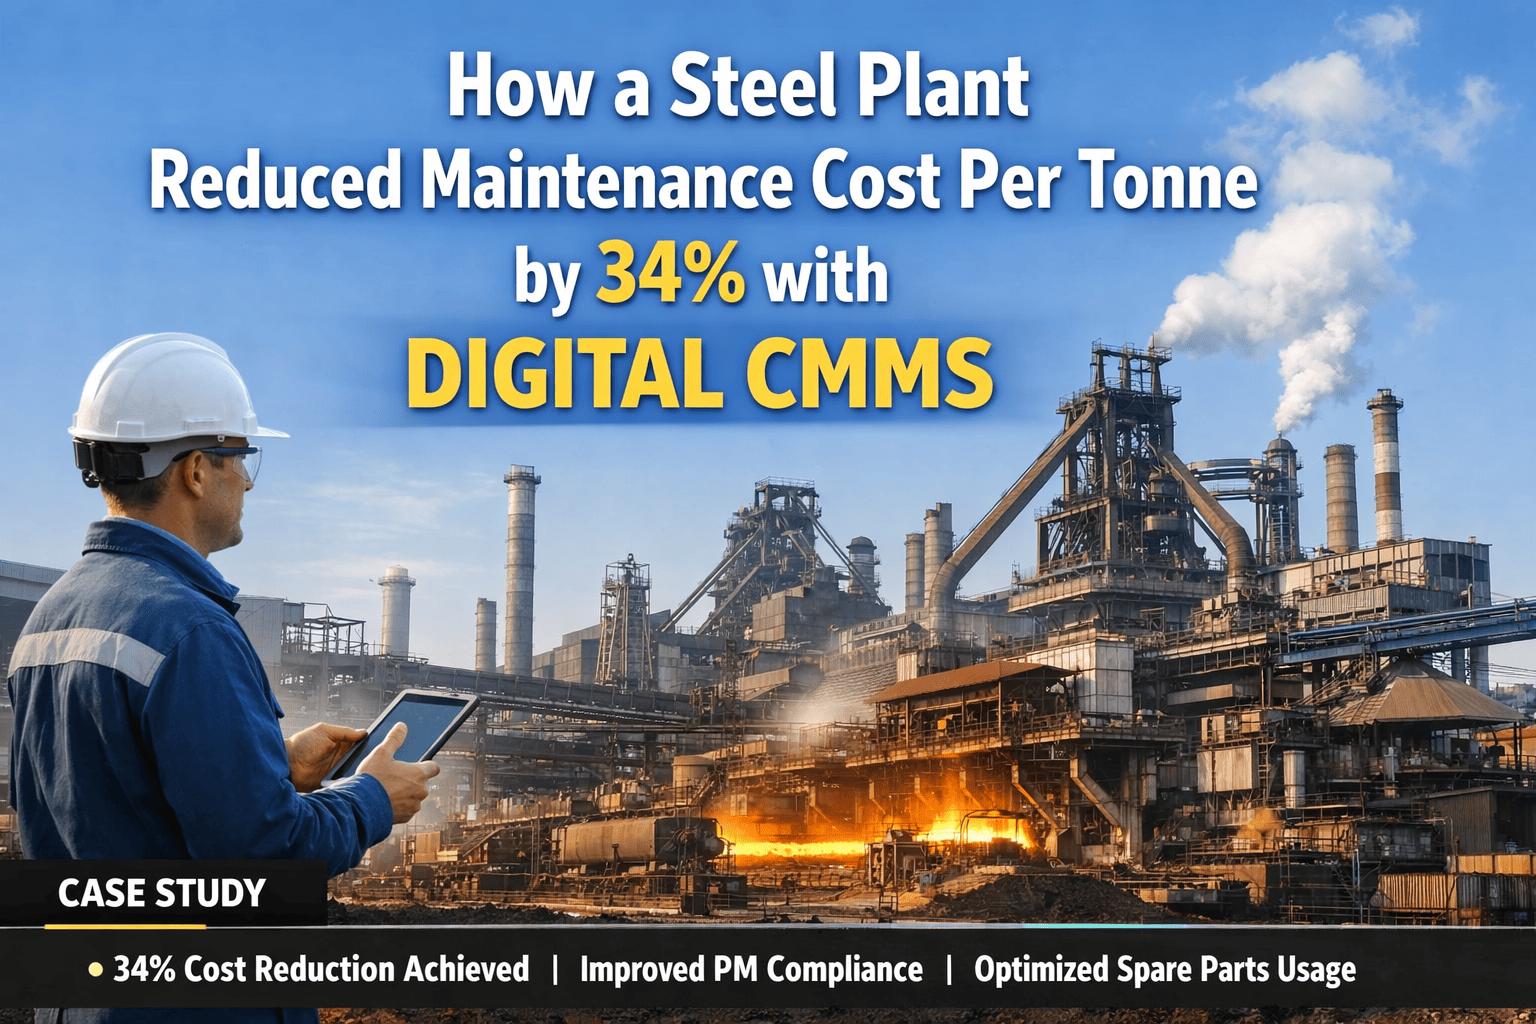
How a 3.5 MTPA Steel Plant Reduced Maintenance Cost Per Tonne by 34% in 18 Months
34%
Reduction in maintenance cost per tonne
58%
Fewer emergency work orders
11 mo
Full CMMS investment payback
91%
PM compliance rate (up from 54%)
$4.2M
Annual maintenance spend recovered
The Situation
A Plant Running on Paper — and Paying for It
This facility produces 3.5 million tonnes of crude steel annually across a blast furnace, basic oxygen furnace, two continuous casters, and a five-stand hot strip mill. It employs 280 maintenance personnel across four shifts. By industry benchmarks, it should have been operating at $18–22 per tonne in maintenance cost. Its actual cost per tonne was $31.40 — placing it firmly in the bottom quartile of global integrated steel operations.
The root causes were not mechanical. They were structural. PM schedules existed on paper but completion was tracked by memory. Spare parts inventory ran $3.4M in excess stock while critical items for the sinter plant sat on 10-week backorder. Work orders were handwritten, completed job cards rarely made it back to a central file, and the maintenance history for any individual asset was essentially inaccessible. The result was a maintenance team working extremely hard — and spending most of that effort reacting to failures that a functioning PM program would have prevented.
The 5 Structural Problems
01
PM compliance at 54% — nearly half of all scheduled preventive work was not completed on time, if at all
02
Emergency spend at 38% of total maintenance budget — reactive repairs costing 3–5× more than planned equivalent work
03
Wrench time at 26% — technicians spending 74% of paid shift on travel, waiting, searching, and paperwork
04
Zero spare parts optimization — $3.4M excess inventory alongside critical item stockouts causing 12–18 day procurement delays
05
No maintenance history visibility — retrieving equipment history for any asset required 2–3 days of manual file search
Recognize This Situation?
See How Oxmaint Diagnoses Your Plant's Maintenance Cost Drivers in a Single Session
The five structural problems above explain 80% of all maintenance cost-per-tonne variance between top and bottom-quartile steel operations. If any of them sound familiar, a 30-minute session with Oxmaint will show you exactly where your plant sits on each one — and what the financial recovery looks like.
The Implementation
18 Months — Phased, Measured, and Documented
The implementation was structured in three phases. Each phase had defined success metrics before moving to the next. No phase was declared complete until its KPIs were confirmed in the Oxmaint analytics dashboard.
Phase 1 — Months 1–4
Foundation: Asset Registry, Work Order Digitization, Historical Migration
2,200 assets registered in Oxmaint with full technical specifications, location hierarchy, and criticality ratings
6 weeks parallel operation — paper and digital running simultaneously; technicians verified digital against paper records before paper was retired
Historical maintenance records for top 400 critical assets migrated from paper files into asset history
Mobile work order deployment for all 280 technicians across four shifts — job cards eliminated
Phase 1 Outcome
Work order retrieval time reduced from 2–3 days to under 4 minutes. PM completion visibility achieved for the first time. Baseline data collected for all downstream optimization.
Phase 2 — Months 5–11
Optimization: PM Program Rebuild, Spare Parts Integration, Workforce Productivity
PM schedules rebuilt asset by asset — blast furnace on heat-count triggers, caster segments on tonnage, rolling mill on operating hours (not calendar)
Spare parts catalog linked to work orders — 3,400 SKUs tagged to specific assets and PM procedures, demand-driven reorder points replacing min/max guesswork
Contractor work orders brought into CMMS — all contractor scope, cost, and completion data captured for the first time
Wrench time improvement program — pre-staged parts kits linked to PM work orders, digital job instructions attached to each work order type
Phase 2 Outcome
PM compliance reached 84% by month 11, up from 54% baseline. Emergency work order frequency dropped 41%. Spare parts dead stock identified: $1.8M in excess inventory flagged for rationalization over 6 months.
Phase 3 — Months 12–18
Performance: Predictive Triggers, Cost Analytics, Continuous Improvement Loop
IoT sensor data connected to Oxmaint — vibration and temperature alerts on 140 critical rotating assets auto-generating predictive work orders
Maintenance cost per tonne dashboard activated — live cost tracking by production area, asset class, and work order type
Contractor spend governance implemented — all contractor work orders benchmarked against unit cost targets, 14 recurring tasks identified for insourcing
Closed work order data feeding back into PM trigger calibration — failure history now drives maintenance intervals across all critical assets
Phase 3 Outcome
PM compliance reached 91%. Emergency work orders down 58% from baseline. Maintenance cost per tonne: $20.70 — a 34% reduction from the $31.40 pre-implementation baseline. Full CMMS payback confirmed at month 11.
Measured Results
18-Month Performance — Before vs. After
| Metric |
Before CMMS |
Month 12 |
Month 18 (Final) |
Change |
| Maintenance Cost Per Tonne |
$31.40 |
$26.10 |
$20.70 |
-34% |
| PM Compliance Rate |
54% |
84% |
91% |
+37 pts |
| Emergency Work Orders (monthly) |
214 |
127 |
90 |
-58% |
| Technician Wrench Time |
26% |
41% |
54% |
+28 pts |
| Spare Parts Dead Stock |
$3.4M |
$2.1M |
$1.6M |
-53% |
| Emergency Parts Premium Spend |
$1.9M / yr |
$1.1M / yr |
$680K / yr |
-64% |
| Planned vs. Reactive Ratio |
52% planned |
71% planned |
83% planned |
+31 pts |
| Asset History Retrieval Time |
2–3 days |
Under 10 min |
Under 4 min |
-99% |
Where the $4.2M Came From
Savings Breakdown — Annual Recovery by Source
$1.64M
Emergency Repair Reduction
58% fewer unplanned breakdowns across blast furnace, caster, and rolling mill — each avoided event saving $8,000–$45,000 in labor, parts, and lost production
$1.21M
Spare Parts Optimization
$1.8M dead stock rationalized, emergency procurement premium down 64%, demand-driven reorder points eliminating stockout-related delays
$920K
Workforce Productivity Gain
Wrench time from 26% to 54% — same 280-person workforce delivering 108% more productive maintenance output through mobile work orders and pre-staged parts
$440K
Contractor Spend Governance
14 recurring tasks insourced, all contractor work orders benchmarked against unit cost targets — 23% reduction in total contractor maintenance spend
Expert Review
"
This case study is consistent with what I see across integrated steel operations globally. The $31 per tonne starting point is painfully common — not because these plants lack good maintenance people, but because they lack the data infrastructure that makes good maintenance decisions possible. You cannot plan around failures you cannot see coming. You cannot optimize spare parts inventory you cannot measure. When Oxmaint gave this plant its first real view of where money was going at the work-order level, the savings were not generated by the software — they were generated by experienced maintenance professionals finally having the information they needed to make the right call. The platform made their expertise visible and actionable. That is what a well-implemented CMMS actually does.
Rajiv Nair
Former VP Maintenance — Tata Steel Europe / Independent Steel Operations Consultant, 24 Years in Integrated Steelmaking
Industry Context
Where This Plant Stood — and Where It Landed
Based on World Steel Association and McKinsey Steel Operations Benchmarking data. Maintenance cost per tonne varies by route, region, and fleet age — but the efficiency gap between top and bottom quartile is structural, not circumstantial.
Bottom Quartile
$28–38/t
Industry Average
$18–28/t
World Class
$12–18/t
At $20.70/t, the plant moved from bottom quartile into the lower range of industry average within 18 months. Projected trajectory on current PM maturity curve places it in top quartile ($15–17/t) within 36 months of implementation.
Calculate Your Plant's Recovery
What Would a 34% Reduction in Your Maintenance Cost Per Tonne Be Worth?
Every steel plant has a version of this story. The structural inefficiencies are the same — reactive spend, spare parts waste, low wrench time, no PM visibility. The recovery potential is calculable from your own data. Book a session with Oxmaint and leave with a plant-specific cost recovery projection built from your actual production volume, maintenance headcount, and current spend figures.
Start Free Trial
Book Your ROI Session
Questions About This Case Study
What Maintenance Teams Ask Most
How long does a full Oxmaint CMMS implementation take for a plant this size?
For a facility of this scale — 2,200+ assets, 280 maintenance personnel, and 18 years of historical records — the structured implementation ran 14 months to live operation, with full optimization achieved at month 18. The critical difference between this implementation and faster but less successful ones was the 6-week parallel run period, where both paper and digital systems operated simultaneously. This investment in trust-building produced 34% higher long-term adoption rates than plants that forced a direct paper-to-digital switch. For smaller plants with 500–800 assets, Oxmaint implementations typically reach full live operation in 60–90 days.
Start a free trial to begin asset registration today.
Is a 34% maintenance cost reduction realistic for plants with different steelmaking routes?
The 34% figure reflects an integrated blast furnace–BOF route plant starting from a high baseline ($31.40/t) with significant structural inefficiency. EAF-based mini mills typically start from a lower baseline ($15–22/t) and see proportionally smaller absolute savings, though similar percentage improvements are achievable on efficiency metrics like PM compliance and wrench time. The savings drivers — emergency spend reduction, spare parts optimization, and workforce productivity — apply equally across steelmaking routes.
Book a session to see a route-specific projection for your plant's actual cost structure.
What does spare parts optimization through Oxmaint actually look like in practice?
In this implementation, the first step was linking every part in the plant's 3,400-SKU catalog to the specific assets and PM procedures that consume it. Once that linkage exists, Oxmaint tracks actual consumption per work order — replacing the min/max inventory guesses that produced $3.4M in dead stock alongside critical item stockouts. Demand-driven reorder points emerged from 6 months of real consumption data. Dead stock was identified by cross-referencing inventory levels against actual usage rates and asset retirement status. The $1.8M rationalization was a direct output of that visibility — the plant had always had the data; Oxmaint made it usable.
See how Oxmaint handles spare parts catalog management in a free trial.
How does Oxmaint handle blast furnace campaign-based maintenance scheduling versus calendar-based PM?
This was one of the most important configuration decisions in Phase 2. Standard CMMS platforms default to calendar-based PM triggers, which are structurally wrong for steel plant equipment. Oxmaint allows PM triggers to be set against heat counts, tonnage processed, operating hours, or any measurable production variable — meaning blast furnace cooling stave inspections trigger after a defined number of heats, caster segment maintenance triggers after a defined tonnage, and rolling mill stand rebuilds trigger against actual rolling hours. This aligns maintenance intervals with actual equipment wear rather than calendar dates that ignore production variability.
Book a demo to see production-variable PM triggers in Oxmaint.
What is the typical payback period for Oxmaint CMMS in a steel plant?
This plant achieved full payback at month 11, which is consistent with the documented average for integrated steel plants deploying Oxmaint — typically 9–14 months from go-live. The fastest payback drivers are emergency repair reduction in the first 6 months (typically 30–40% reduction even before PM optimization is fully deployed) and spare parts emergency procurement premium elimination, which compounds quickly as demand-driven reorder points stabilize. Plants starting from higher baseline reactive maintenance ratios — above 35% reactive — tend to see faster payback because the upside from the shift to planned work is proportionally larger.
Start your free trial and begin calculating payback from your own data on day one.
Your Plant. Your Numbers.
Start the Same Program This Plant Started 18 Months Ago
The maintenance cost structure that produced a 34% reduction in this plant is not unique to this plant. The structural inefficiencies — reactive spend, spare parts waste, low PM compliance, invisible contractor costs — are the industry norm. The difference is whether you have a system that makes them visible and gives your team the tools to close them. Oxmaint is that system. Your team already knows what to fix.