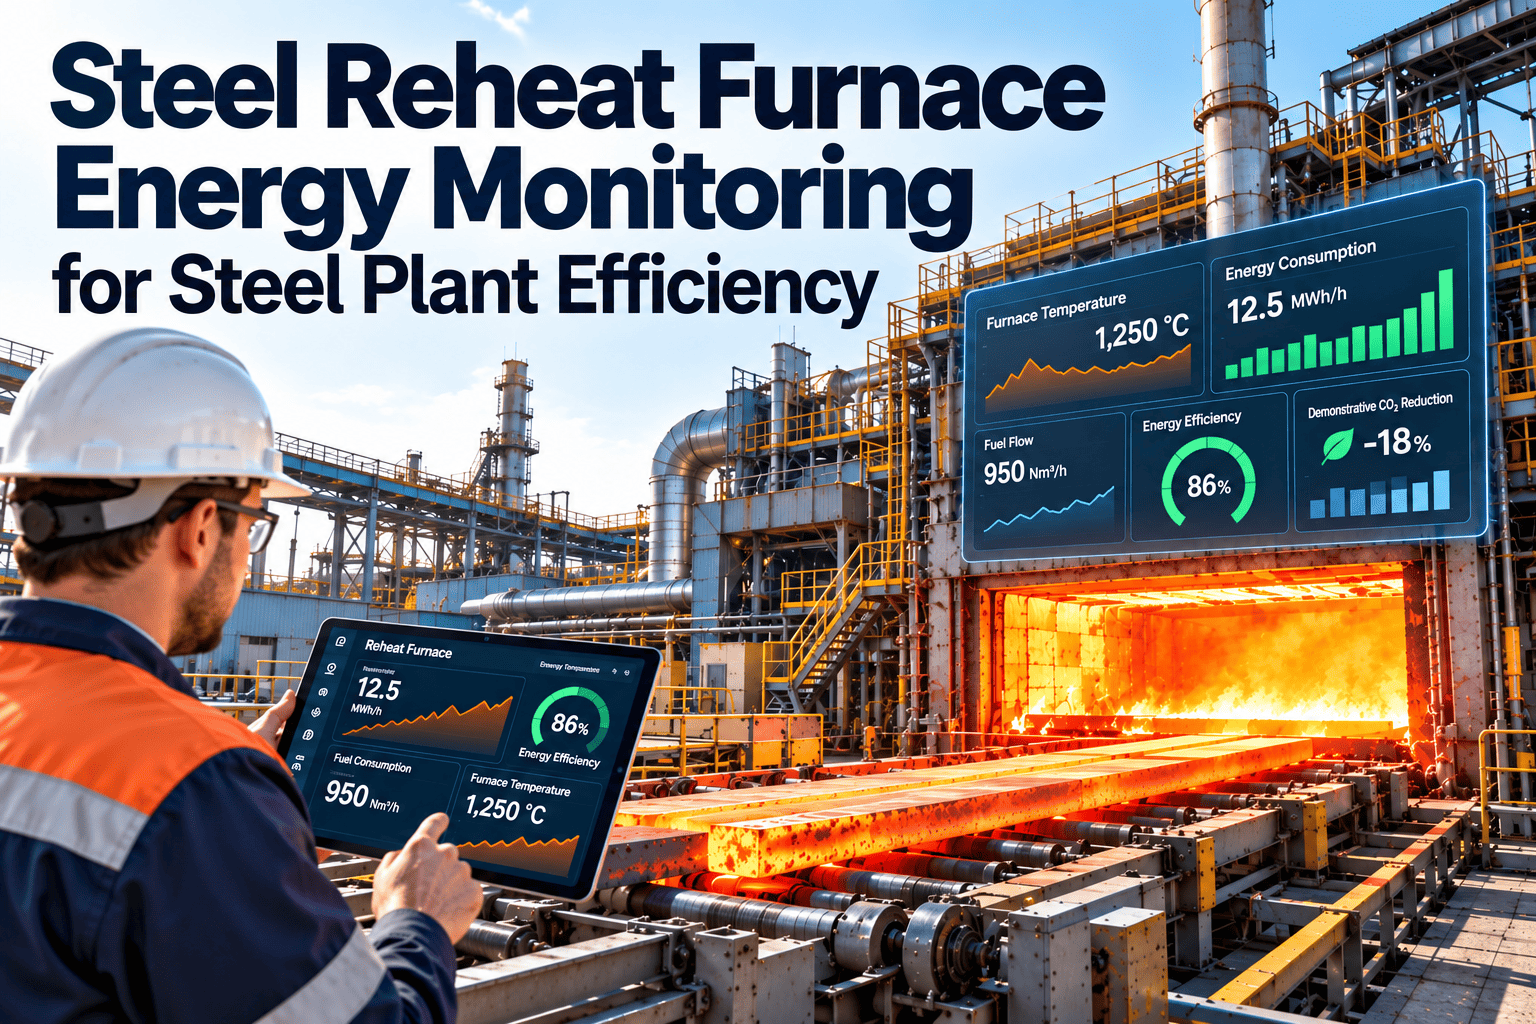
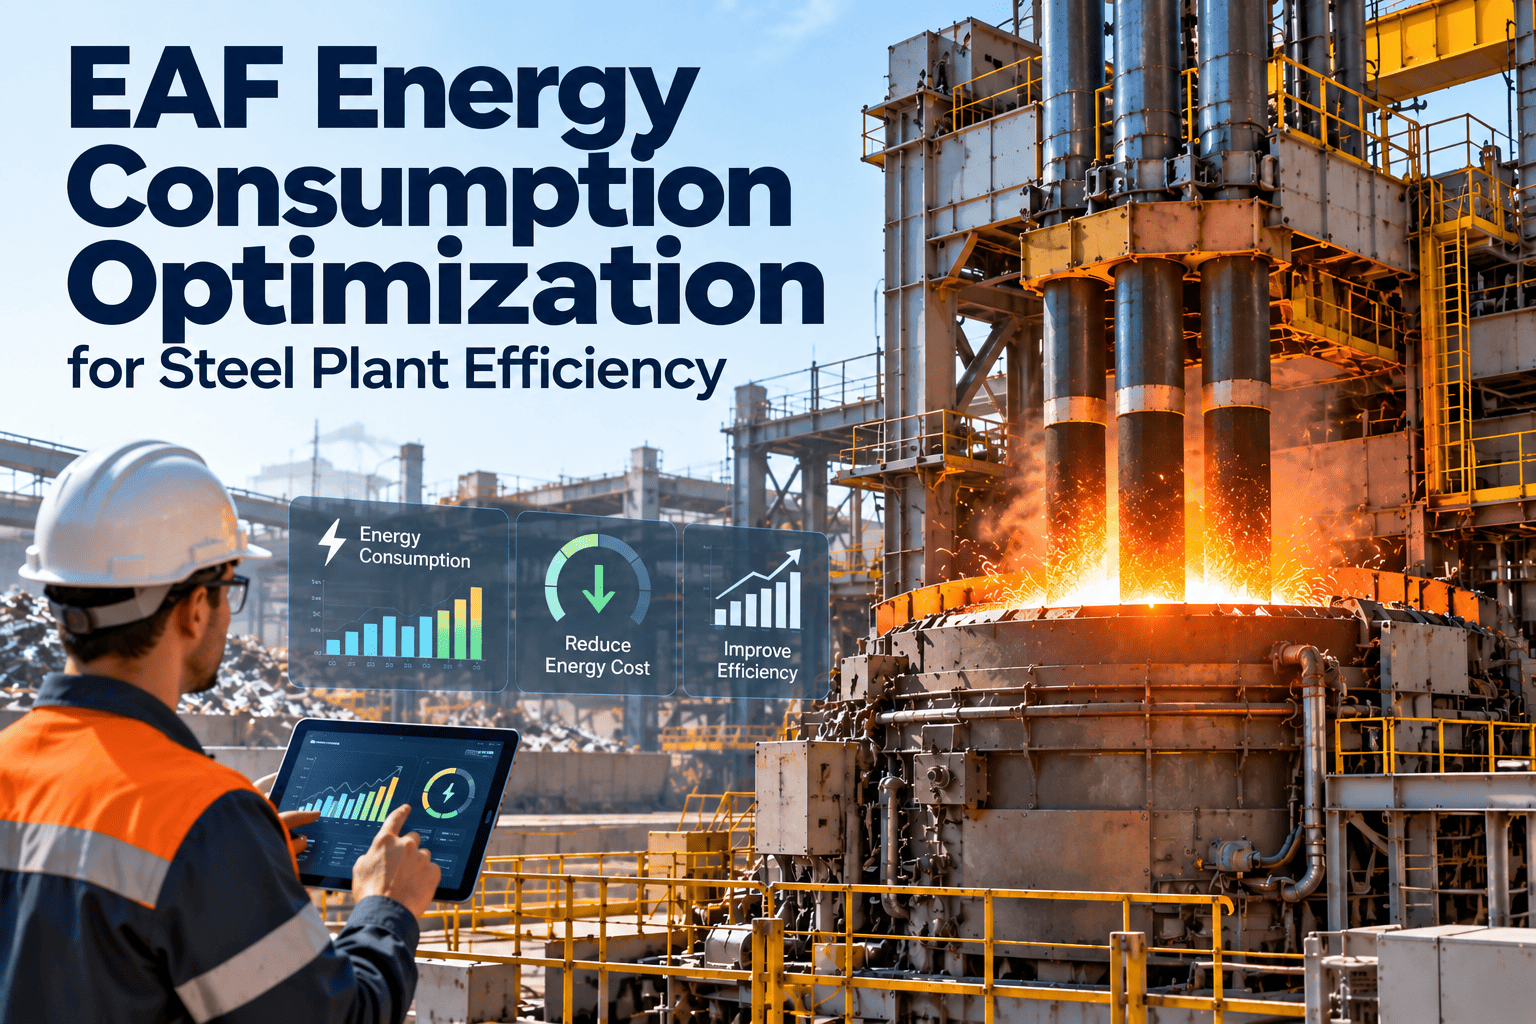
Steel reheating furnaces consume 67% of all energy used in a steel plant — yet most of that energy is never accounted for at the process level. Flue gas exits at 350 to 450°C even after recuperation, carrying 25 to 40% of total heat input with it. Every 1% of excess oxygen above optimal combustion stoichiometry adds another 2 to 3% to fuel costs, invisibly and continuously. Energy accounts for 40% of total steel manufacturing cost — and the furnace is where that number is set, or wasted. Oxmaint's Thermal Efficiency Analytics Engine monitors combustion performance, heat loss signatures, refractory degradation, and furnace scheduling drift in real time, turning every sensor reading into a cost-per-tonne calculation your energy team can act on. Book a demo to see how Oxmaint delivers live thermal efficiency dashboards for your furnace fleet.
Thermal Efficiency Monitoring for Steel Furnaces and Heat Systems
Stop guessing where your fuel is going. Detect flue gas losses, combustion drift, refractory degradation, and scheduling waste before they compound into quarters of avoidable energy cost.
Where Furnace Heat Actually Goes
A reheating furnace operating at typical efficiency sends less than half of its fuel energy into the steel it is heating. The rest exits through five loss pathways — each detectable, each measurable, and each addressable through continuous monitoring. Understanding the split is the first step to recovering it.
What Oxmaint Thermal Analytics Detects
Each loss pathway has its own sensor signature, alarm logic, and corrective action route. The detection grid below maps the five thermal loss categories to the monitoring approach, the signal that triggers an alert, and the dollar impact per tonne that motivates the fix.
See your furnace fleet's thermal efficiency KPIs on a live dashboard — deployed in under 4 weeks.
Furnace Type Coverage
Steel plants run five distinct furnace types, each with its own energy profile and primary loss mechanism. Oxmaint ships pre-configured monitoring templates for all five — no custom engineering required to deploy against your specific furnace fleet.
| Furnace Type | Typical SEC | Primary Loss Mechanism | Key Oxmaint Monitoring Points |
|---|---|---|---|
| Reheating Furnace (walking beam / pusher) | 1.0–1.8 GJ/t | Flue gas (25-40%), wall/surface (17%), idle-hold delays | Burner O₂ trim, stack temperature, recuperator delta-T, hold-period fuel log |
| Electric Arc Furnace (EAF) | 300–450 kWh/t | Off-gas heat loss, electrode oxidation, arc instability | Specific energy (kWh/t), electrode consumption, tap-to-tap time, off-gas temperature |
| Ladle Furnace | 35–65 kWh/t arc time | Lid seal loss, refractory wear, excessive arc time | Lid temperature, arc power trace, refractory thickness survey, heat-to-heat cycle time |
| Blast Furnace Stoves | Hot blast target: 1100-1250°C | Dome temperature decay, combustion inefficiency, heat loss through stave degradation | Dome temperature trend, combustion efficiency, checker void monitoring, hot blast temperature |
| Preheaters & Soaking Pits | Variable by load | Incomplete combustion, seal leakage, overshooting target temperatures | Temperature uniformity, discharge temperature, combustion O₂, fuel-per-heat log |
How the AI Analytics Engine Works
The Thermal Efficiency Analytics Engine ingests process data from three source layers — sensor feeds from the BMS/DCS, manually entered inspection readings, and production schedule data — and runs them through an asset-specific baseline model to isolate abnormal thermal behavior from normal operational variation.
O₂ trim sensors, stack thermocouples, shell IR readings, fuel flow meters, and combustion air flow data ingested via OPC-UA or MODBUS from existing DCS/BMS. No sensor hardware replacement required.
Per-furnace energy consumption baseline built from 3-month rolling history, corrected for production rate and ambient temperature. AI detects deviations from expected HEC (GJ/t) — not just threshold crossings. Prediction accuracy above 94% per current SRRF models.
When HEC drifts above baseline, the engine attributes the deviation to combustion, refractory, flue, schedule, or atmosphere loss. Work order generated with the attributed cause, estimated cost impact, and recommended corrective action.
Every monitoring cycle produces a live GJ/t dashboard for each furnace with loss breakdown, trend against baseline, and month-to-date energy cost variance. Designed for the energy manager and plant manager simultaneously — both audiences, one report.
Expert Review
The flue gas number tells you everything. If you are reading stack temperatures above 450°C after your recuperator, the energy is leaving the building. Most plants measure it once a quarter. You need it trending in real time or it is not actionable.
Process Energy Engineer, Integrated Hot Strip MillWe recovered 8% of reheating fuel in the first six months just by synchronizing furnace setpoints with actual rolling schedules. The mill delays were always there — nobody was watching the furnace hold periods until the dashboard made it visible.
Furnace Optimization Lead, Cold Roll Steel OperationsA refractory survey every six months catches the problem after it has been costing you money for three. Shell thermocouple trending gives you a continuous wear signal so you can plan the reline on your schedule — not the furnace's.
Refractory Engineering Manager, BOF Steelmaking ComplexKPI Benchmarks for Thermal Efficiency Monitoring
| KPI | How to Measure | Target / Benchmark | Review Cadence |
|---|---|---|---|
| Specific Energy Consumption (SEC) | Total furnace fuel (GJ) ÷ tonnes reheated | 1.0–1.4 GJ/t for world-class reheating | Daily — trending shift-level |
| Flue Gas Exit Temperature | Stack thermocouple, corrected for load | Below 350°C with functioning recuperator | Continuous — alarm at +20°C above baseline |
| Excess O₂ in Flue Gas | O₂ trim sensors at each combustion zone | 2-4% excess at rated load | Continuous — alarm at +1% above setpoint |
| Shell Surface Temperature | IR camera survey / thermocouple grid | Zone-specific — trend rather than absolute | Monthly survey, continuous for critical zones |
| Idle-Hold Fuel Consumption | Fuel metered during delay periods vs production periods | Target zero unplanned hold periods | Per-shift review — auto-flagged by schedule mismatch |
Frequently Asked Questions
Your Furnace Is Setting Your Energy Cost. Make Sure It Is Visible.
Oxmaint's Thermal Efficiency Analytics Engine deploys on your existing furnace instrumentation and delivers live GJ/t dashboards, loss attribution, and automatic work orders — in under four weeks, without replacing your DCS.