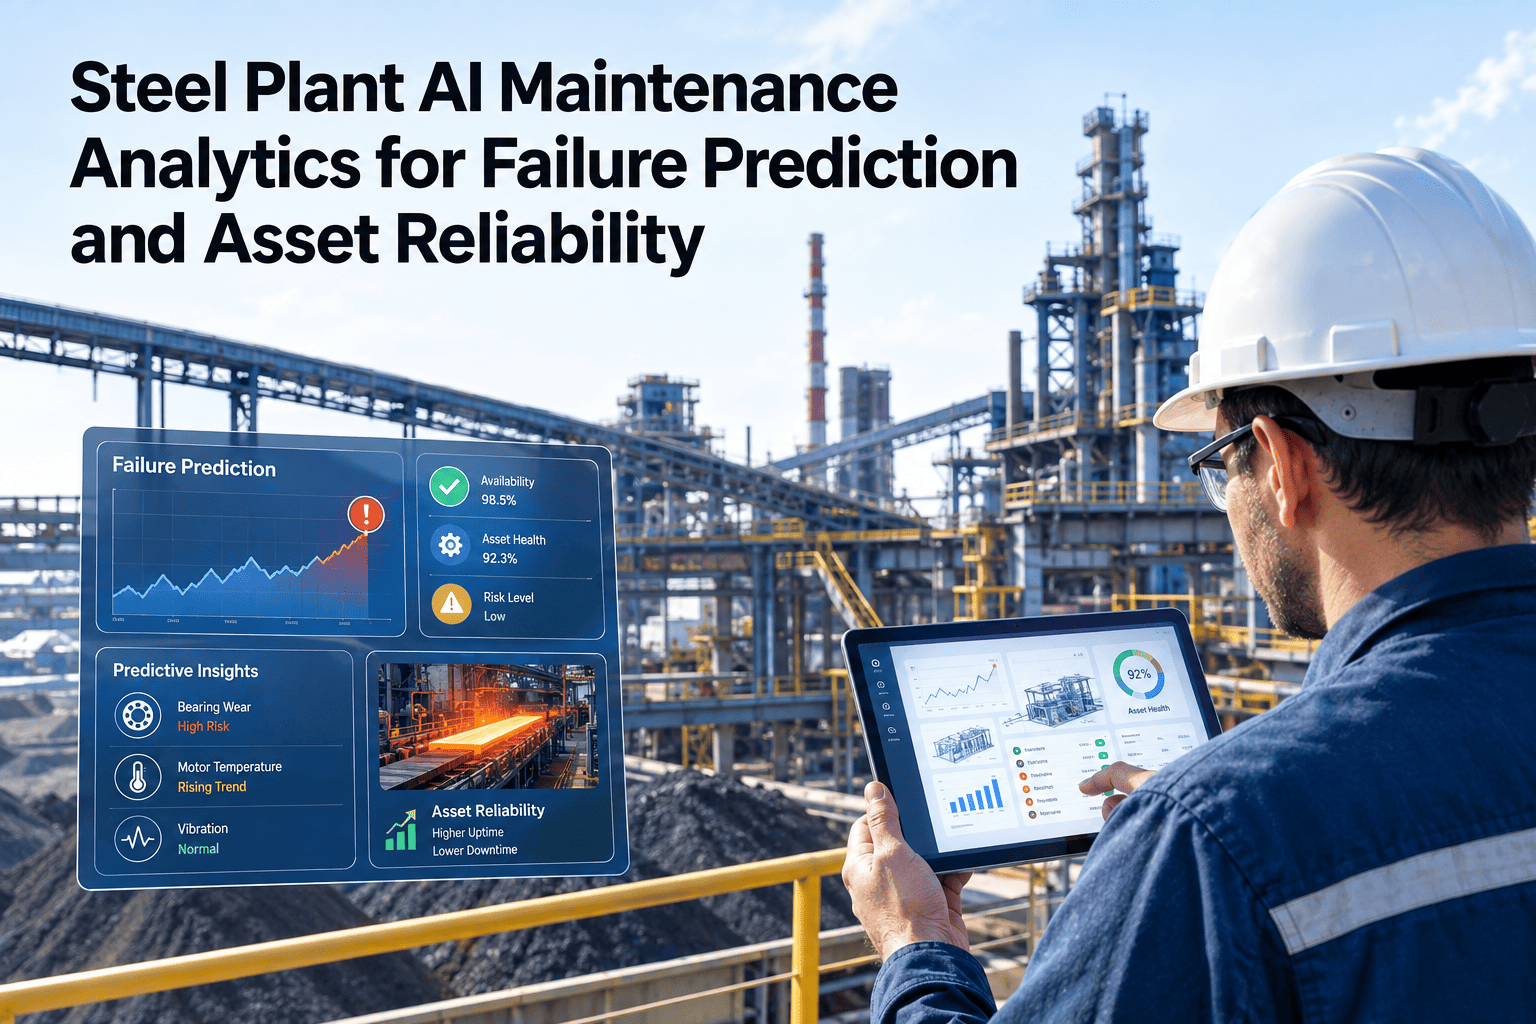
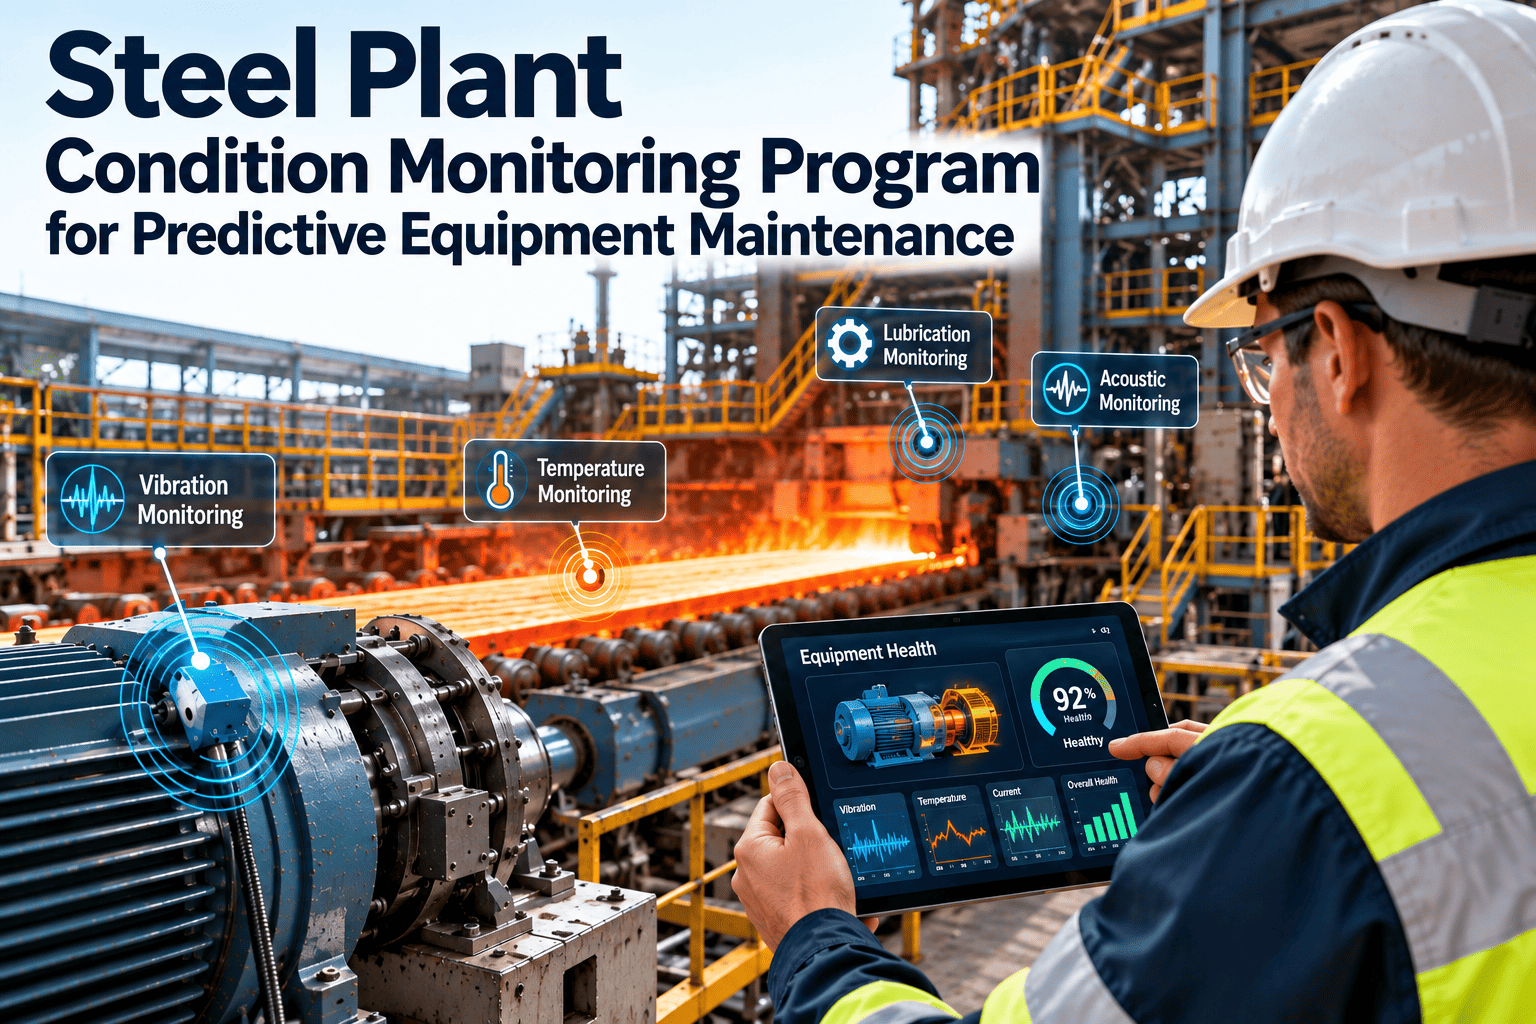
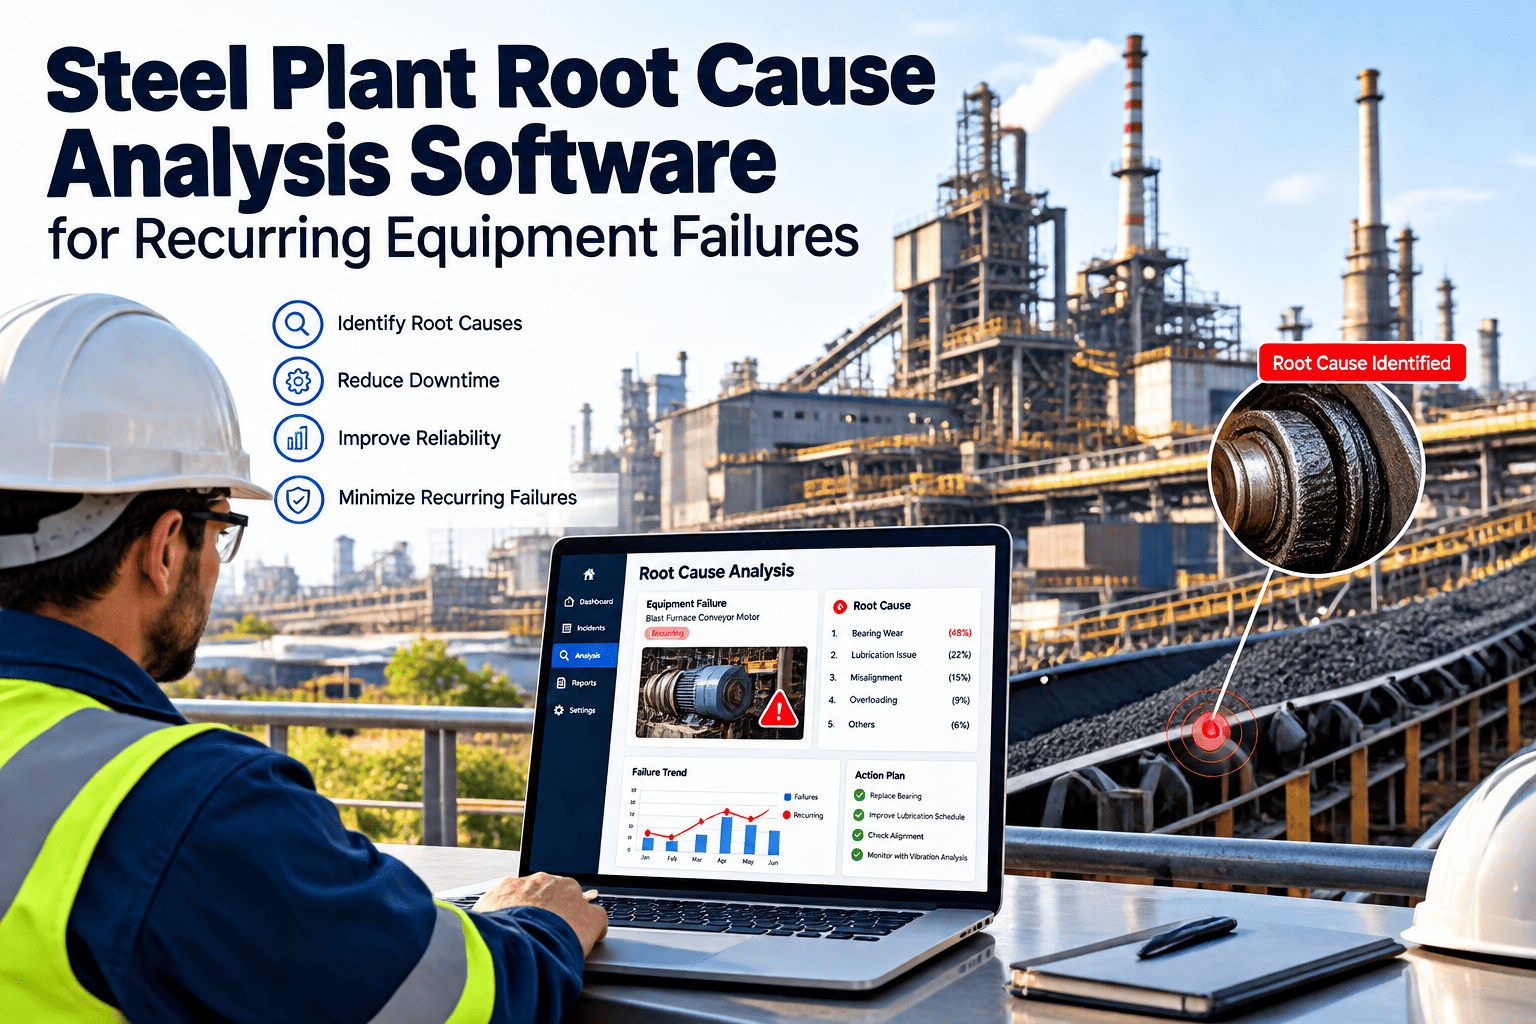
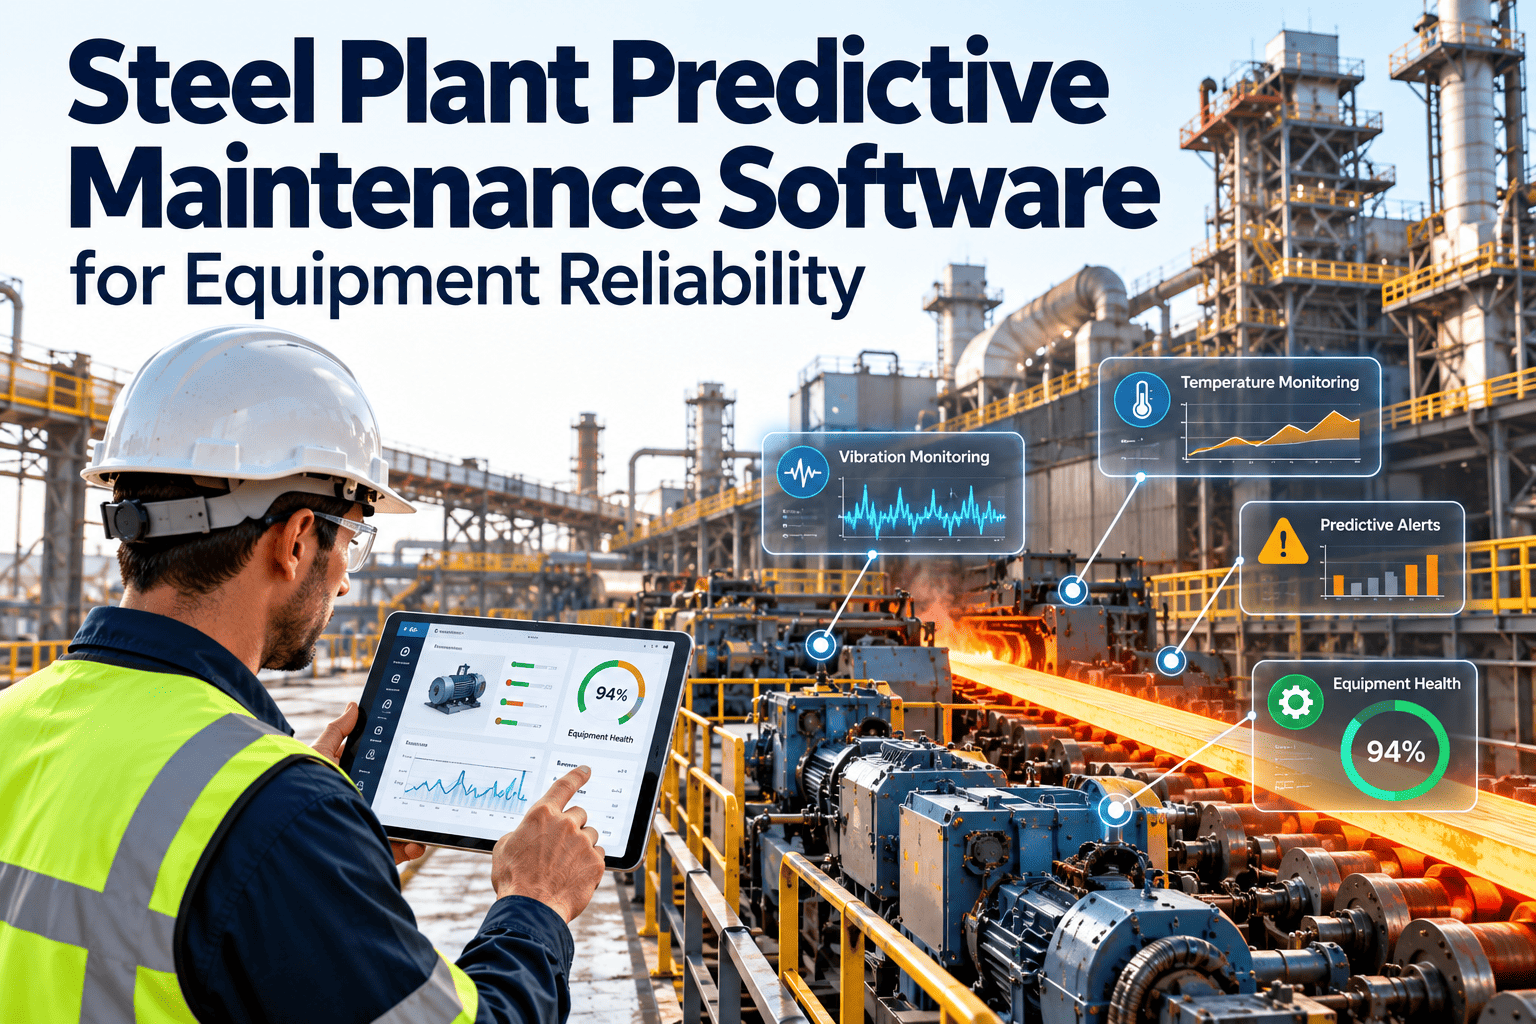
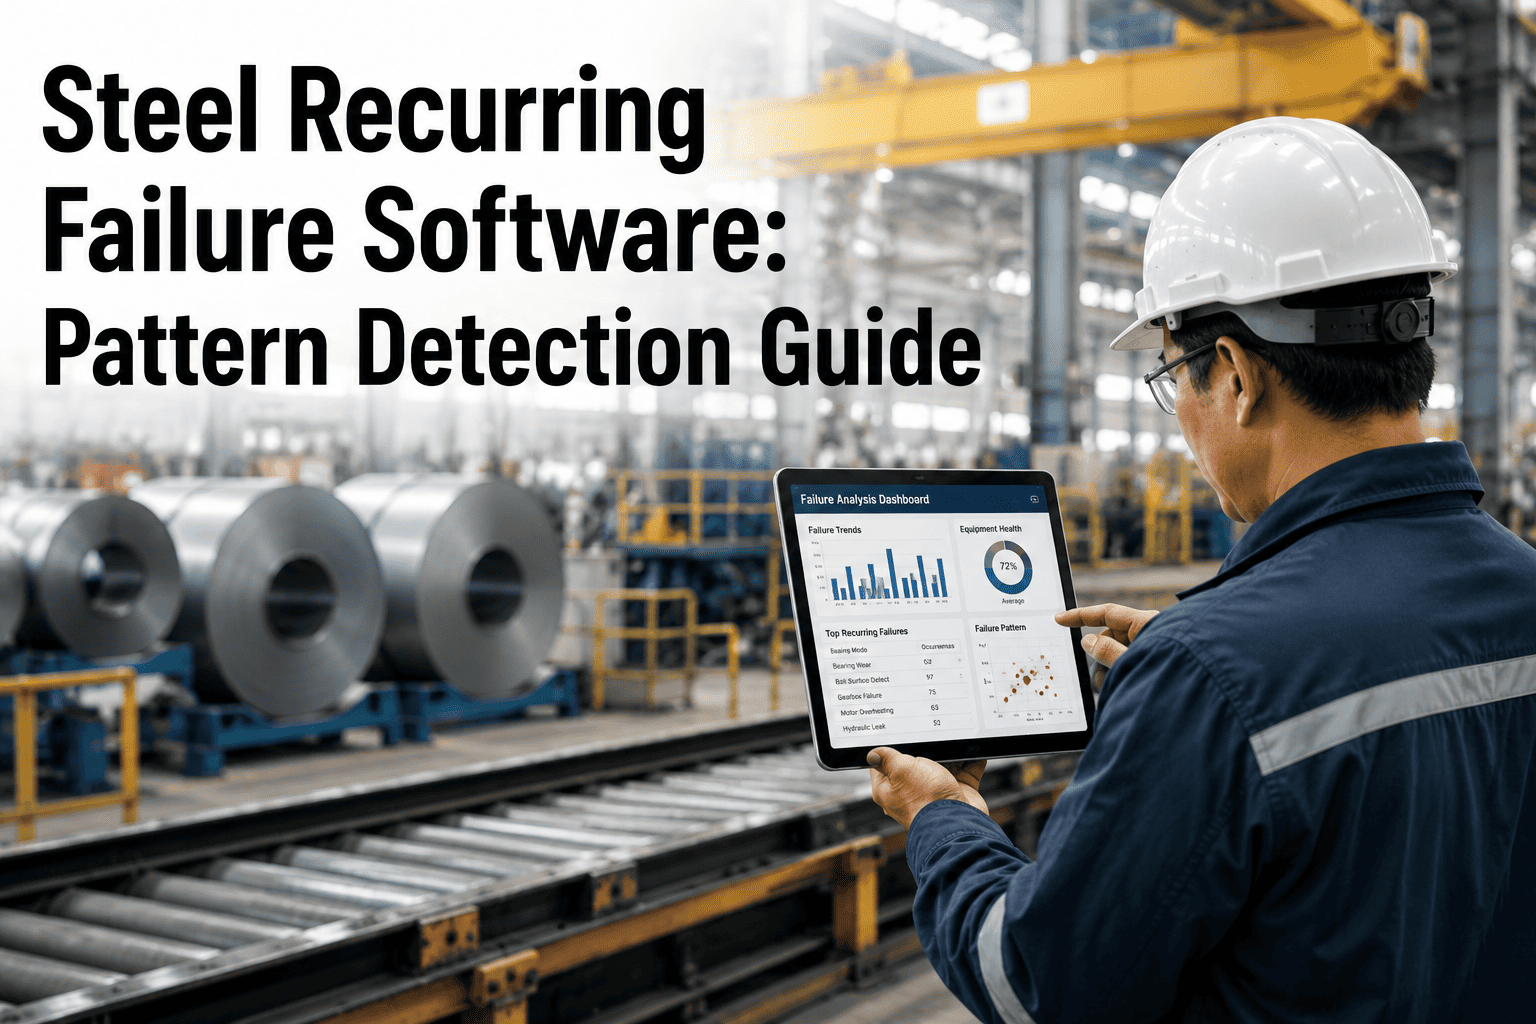
Bearing failure is the single largest cause of unplanned downtime in steel plants — and lubrication is the root cause in roughly half of those failures. The Electric Power Research Institute estimates nearly 50% of bearing failures are lubrication-related, with starved bearings, contaminated grease, or excess grease driving the rest. For a rolling mill running at $18,500 per hour of lost margin, a single seized roll neck bearing costs more than an entire year of sophisticated monitoring. Oxmaint's Lubrication Monitoring AI reads grease and oil condition data directly from in-line sensors and sample analytics, trends every bearing and gearbox against its own baseline, and triggers work orders the moment ferrous debris, water contamination, or viscosity drift crosses threshold. Book a demo to see how automated lubrication monitoring plugs into your existing steel plant CMMS.
Automated Lubrication Monitoring for Steel Plant Equipment
Stop running blind on grease condition. Connect sensors, sample results, and lubrication schedules into one AI-driven monitoring loop across rolling mills, casters, blast furnace blowers, and coil lines.
The Lubrication Problem in Steel Plants
A typical integrated steel plant carries 1,500 to 2,500 lubricated assets — from roll neck bearings in hot strip mills to circulating oil systems serving continuous casters to grease points on conveyor gearboxes. Each asset has its own lubricant specification, condition tolerances, and failure signature. Manual tracking of all of this produces two predictable failure modes: over-greasing that blows seals and raises bearing temperatures, and under-greasing that starves the elastohydrodynamic oil film that keeps rolling elements separated from raceways.
Missed relubrication cycle or blocked grease line leaves the bearing running on residual oil film. Metal-to-metal contact begins within hours. Discolored raceways and excessive wear follow within days. Detectable by ferrous debris trend, not by thermal inspection alone.
Water ingress from mill cooling sprays or dust from raw material handling contaminates grease or oil. Additive package degrades. Lubricant film collapses. Silicon and water content in the sample reveal this failure mode long before vibration signatures appear.
Well-intentioned over-application at slow-speed bearings causes heat buildup from churning, then seal blowout, then contamination. One of the most common maintenance-induced failures in the industry — fully preventable with condition-based dispensing.
Circulating oil loses viscosity from shear, heat, or dilution. Film thickness drops below the Stribeck-curve minimum for mill loads. Gears and bearings enter mixed-film or boundary lubrication regime. Measurable weeks before the first noise or vibration symptom.
How Oxmaint Lubrication Monitoring AI Works
The monitoring loop runs continuously across four integrated layers. Sensor data and sample results flow in. AI models trend every asset against its own baseline family. Deviations trigger work orders into the maintenance workflow. Every cycle feeds back into the model to tighten thresholds and reduce false alarms.
Inline particle counters, ferrous debris monitors, moisture sensors, and viscosity probes on circulating oil systems. ASTM D7718 grease samples and oil samples from lab analyzers ingested via API. Frequency matched to asset criticality.
Each asset benchmarked against its own historical baseline and family-level peer group. Family analysis flags a single bearing running 35 ppm tin when the population average is 7 ppm — well before that reading would trip a universal threshold.
Per-asset alarm limits for iron, chromium, copper, silicon, water content, viscosity, and particle count. Severity tiers map to work order priority. Predictive algorithms compare ideal vs actual values and forecast time-to-threshold.
Threshold breach generates work order with asset ID, severity, recommended action, and SLA timer. Routed to the assigned maintenance team with sample history and trend chart attached. Resolution captured back into the model.
Equipment & Sampling Coverage Matrix
Sampling frequency and test slate vary by asset criticality and operating regime. The matrix below is the working baseline for a mid-size integrated plant — adjusted in practice for individual asset history and production cycles.
| Asset Family | Lubricant Type | Sampling Frequency | Primary Tests |
|---|---|---|---|
| Hot Strip Mill Roll Neck Bearings | Circulating oil / heavy grease | Weekly sample, continuous sensors | Iron, chromium, copper, water, particle count |
| Cold Mill Bearings & Gearboxes | ISO VG 220 with EP additives | Biweekly sampling | Viscosity, wear metals, particle count, additive health |
| Continuous Caster Guide Rolls | Heat-resistant progressive grease | Monthly grease sample | Consistency, ferrous debris, moisture, oxidation |
| Blast Furnace Turbo-Blowers | Synthetic circulating oil | Monthly sampling | RPVOT, particle count, moisture, varnish potential |
| Conveyor & Auxiliary Gearboxes | Gear oil ISO VG 320 | Quarterly sampling | Wear metals, viscosity, ferrography for large particles |
| EAF Transformer & Switchgear | Mineral or natural ester dielectric | Quarterly to annual | Dielectric strength, moisture, dissolved gas analysis |
Plug Oxmaint into your existing sampling lab and sensor network in under two weeks.
What the Data Catches Before Vibration Analysis Does
Grease and oil analysis detect failure earlier on the P-F interval than vibration analysis. The table below shows the typical detection lead time by failure mode, measured against the point when vibration signatures become clearly interpretable to a CBM analyst.
| Failure Mode | Lubrication Signal | Lead Time vs Vibration | Typical Action |
|---|---|---|---|
| Rolling element spalling (early) | Iron and chromium ppm trending up | 4 to 8 weeks earlier | Schedule bearing inspection at next planned outage |
| Cage wear | Copper and tin ppm rise | 3 to 6 weeks earlier | Increase sampling frequency, plan cage replacement |
| Water contamination | Water content above 0.1%, emulsion formed | Immediately detectable | Investigate seal integrity, drain and replace lubricant |
| Viscosity loss from shear | Viscosity below 10% of nominal | 2 to 4 weeks earlier | Change oil, investigate shear mechanism |
| Silica ingress | Silicon ppm above baseline by 3× | Detected before wear surge | Check filtration, seal integrity, breather |
| Additive depletion | RPVOT dropping, MPC varnish potential rising | Weeks to months earlier | Plan oil change, evaluate reconditioning |
Expert Review
Family analysis is the trick. A single bearing at 35 ppm tin looks fine against a universal threshold. Against its 50-bearing family running at 7 ppm average, it is a clear outlier. That is where AI earns its keep.
Reliability Engineer, Integrated Steel Plant MidwestOver-greasing kills more bearings than under-greasing in our experience. Automated dispensing based on condition data — not calendar — cut our seal blowouts to near zero in the first year.
Lubrication Program Manager, Tandem Cold Mill OperationsThe value of the sample is only as good as what you do with the result. Before Oxmaint, our lab reports sat in email. Now they trigger work orders the moment they land. That is the difference between a lab program and a reliability program.
Maintenance Planning Lead, Hot Strip Mill OperationsKPI Benchmarks for Lubrication Monitoring
| Metric | How to Measure | Target Range | Review Cadence |
|---|---|---|---|
| Lubrication-Related Failure Rate | Lube-related failures / Total bearing failures | Under 25% (from 50% industry baseline) | Quarterly |
| Sample Turnaround Time | Days from draw to work order trigger | Under 3 days | Weekly |
| Abnormal Sample Rate | Samples flagged / Total samples drawn | Baseline dependent — track trend | Monthly |
| Mean Time Between Failure (MTBF) | Run hours between bearing failures per family | Rising trend quarter over quarter | Quarterly |
| Lubricant Consumption | Kg/L per production tonne | Reduction of 30% or more vs baseline | Monthly |
Frequently Asked Questions
Stop Losing Bearings to Lubrication Failures You Could Have Caught
Oxmaint Lubrication Monitoring AI turns sensor feeds and lab results into work orders — automatically, in real time, across every lubricated asset in your steel plant.