Steel plants run some of the harshest rotating equipment on earth — rolling mill drives, blast furnace blowers, ladle cranes, and continuous caster rollers operating around the clock under extreme thermal and mechanical stress. When a main drive bearing fails without warning, the cost isn't just the repair — it's the production stop, the refractory damage, and the cascade of delays across downstream operations. Vibration analysis, done correctly with proper sensor placement, FFT interpretation, and CMMS-integrated trending, is the discipline that catches these failures weeks before they become emergencies. This guide covers everything your reliability team needs to do it right.
Steel Plant Vibration Analysis Best Practices: Setup, Measurement & Diagnosis
Sensor placement, measurement standards, FFT spectral interpretation, and fault fingerprints for every major failure mode — built for steel plant reliability engineers.
Vibration Standards for Steel Plant Equipment
ISO 10816 — now superseded and updated as ISO 20816 — remains the most cited reference for vibration severity limits on rotating industrial machinery. For steel plant applications, understanding which part of the standard applies to each equipment class is the first step before any measurement program begins.
Industrial Machinery (15 kW+)
Applies to electric motors, fans, blowers, pumps, and compressors operating at 120–15,000 RPM. The primary standard for most steel plant auxiliary equipment. Divides machines into Groups 1 and 2 based on power rating.
Steam Turbines & Large Generators
Applies to land-based steam turbines above 50 MW and generators above 3 MW. Relevant for captive power plants integrated with steel operations. More stringent limits than Part 3.
Reciprocating Machines
Applies to reciprocating compressors and diesel engines — common in steel plant gas compression and emergency power. Different evaluation criteria from rotary equipment.
ISO 20816-3 Severity Zones — What They Mean in Practice
The standard defines four evaluation zones (A–D) based on broadband RMS vibration velocity in mm/s, measured at bearing housings or pedestals under steady-state operating conditions.
| Zone | RMS Velocity (Group 1, Rigid) | RMS Velocity (Group 2, Rigid) | Operational Status |
|---|---|---|---|
| A Newly Commissioned | < 2.3 mm/s | < 1.4 mm/s | Normal — no action |
| B Unrestricted | 2.3 – 4.5 mm/s | 1.4 – 2.8 mm/s | Acceptable — monitor trends |
| C Restricted | 4.5 – 7.1 mm/s | 2.8 – 4.5 mm/s | Schedule maintenance |
| D Damage Risk | > 7.1 mm/s | > 4.5 mm/s | Stop — risk of damage |
Sensor Placement for Steel Plant Rotating Equipment
Correct sensor placement is the difference between catching a fault weeks early and missing it entirely. The rule is simple in principle: measure as close to the load path as possible, on the non-rotating structural part that transmits the dynamic forces. In a steel plant, that almost always means the bearing housing.
Horizontal Radial
Primary measurement direction for most rotating machinery. Captures unbalance (dominant 1x), misalignment (dominant 2x), and most bearing defect frequencies. Mount accelerometer on the horizontal centerline of the bearing housing, perpendicular to the shaft.
Vertical Radial
Secondary measurement for unbalance confirmation and looseness detection. Structural natural frequencies can differ between horizontal and vertical planes — both directions are needed to identify resonance conditions unique to steel plant floor structures.
Axial
Critical for detecting angular misalignment, thrust bearing faults, and cocked bearings. Misalignment in the axial direction shows elevated 1x, 2x, and 3x harmonics. In steel plant gearboxes, axial measurements also capture gear mesh frequencies.
Sensor Placement by Steel Plant Equipment Class
| Equipment | Measurement Points | Primary Fault Target | Sensor Type |
|---|---|---|---|
| Rolling Mill Drive Motor | DE bearing H/V/A, NDE bearing H/V | Unbalance, bearing fault | Accelerometer (low-freq) |
| Gearbox (Reducer) | Input/output bearing H/V, casing axial | Gear mesh, bearing defect | Accelerometer (wideband) |
| Blast Furnace Blower | Motor + fan bearings H/V/A | Unbalance, misalignment | Accelerometer (velocity) |
| Continuous Caster Rolls | Drive-end bearing H/V | Bearing wear, lubrication | Accelerometer (high-freq) |
| Ladle/Overhead Crane | Drum bearings, hoist motor | Bearing fault, looseness | Accelerometer (portable) |
| ID/FD Fan (Boiler/Furnace) | Inlet + outlet bearings H/V/A | Unbalance, resonance | Accelerometer (velocity) |
Measurement Setup & Collection Protocol
Inconsistent measurement conditions produce data that cannot be compared over time. Every vibration reading taken under different load, speed, or temperature conditions than the baseline reading is an unreliable data point. These protocols apply to both portable route-based collection and continuous online monitoring.
Confirm Steady-State Operation
ISO 20816 requires measurements under normal, steady-state operating conditions at rated speed and load. Never record during startup, shutdown, or load transients. In steel plants, confirm the mill is running at production speed and thermal equilibrium before collecting.
Record Operating Parameters
Log shaft speed (RPM), operating load (%), ambient temperature, and lubrication status alongside every vibration reading. Without this context, trending data becomes uninterpretable — especially for variable-speed drives common in modern steel plants.
Use Consistent Measurement Points
Mark permanent sensor locations with paint pen or engraved tags. Portable measurements taken even a few centimeters from the original point on a complex gearbox casing can show 15–25% amplitude variation — enough to trigger false alarms or miss developing faults.
Select Correct Measurement Parameter
Velocity (mm/s RMS) for overall severity assessment per ISO 20816 across 10–1000 Hz. Acceleration (g) for high-frequency bearing and gear analysis above 1 kHz. Displacement (µm pk-pk) for low-speed journal bearing monitoring below 10 Hz.
FFT Spectral Analysis — Reading the Frequency Fingerprint
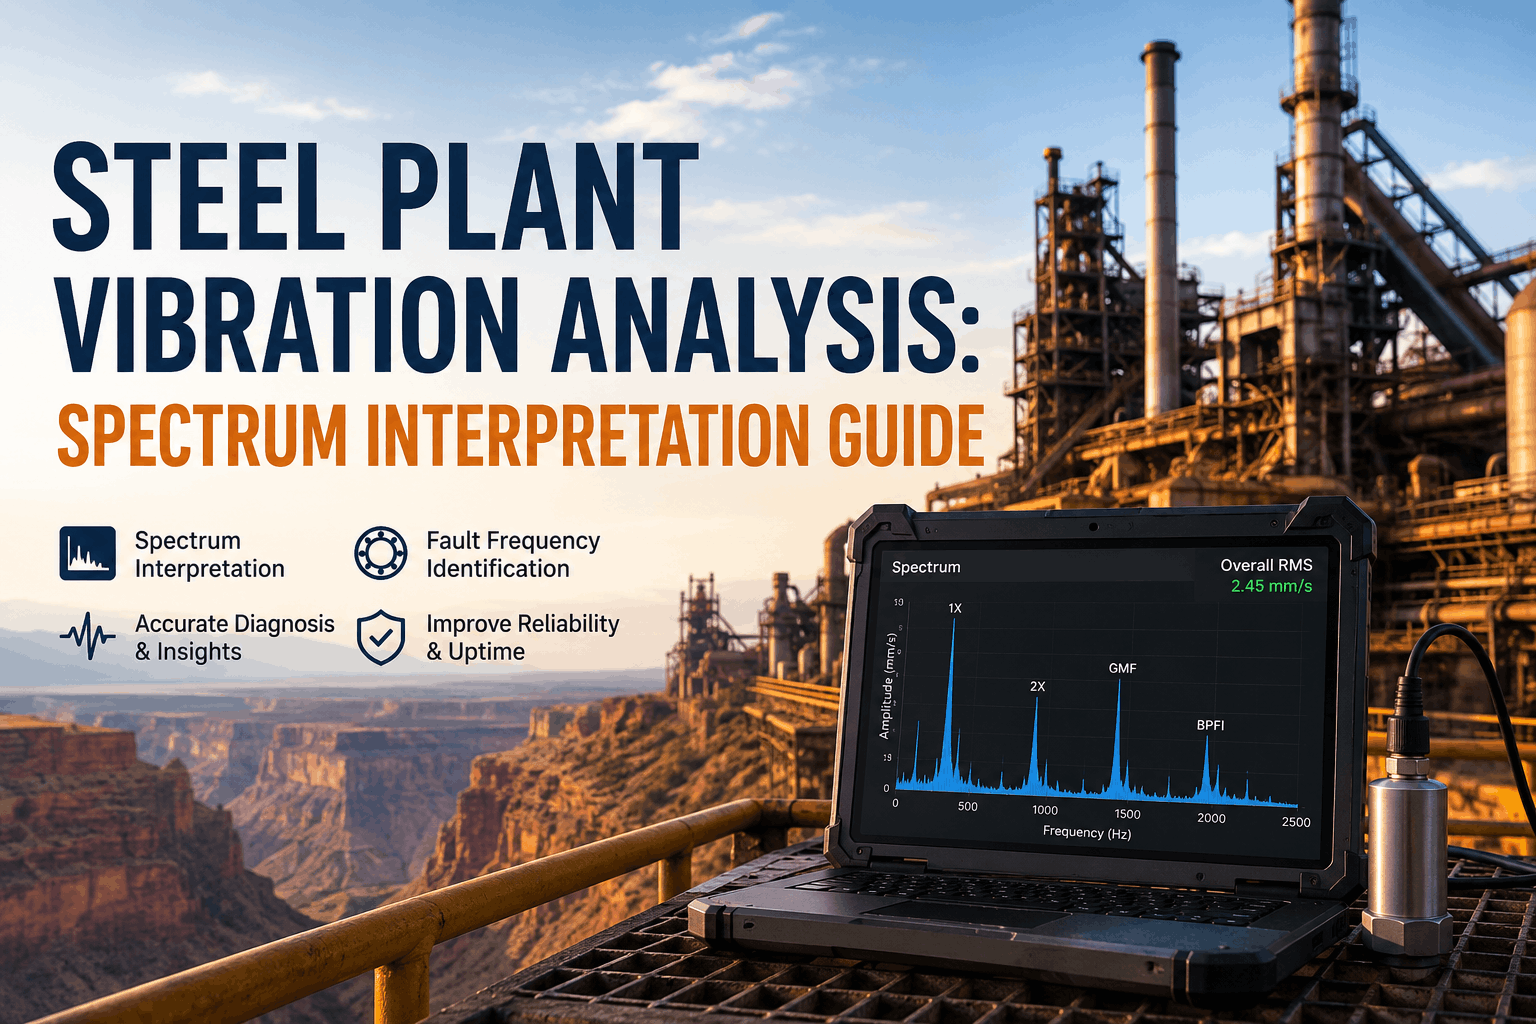
Overall vibration velocity tells you that a machine has a problem. FFT (Fast Fourier Transform) spectral analysis tells you exactly what the problem is. By decomposing the complex vibration signal into individual frequency components, every fault type produces a characteristic spectral signature that an experienced analyst — or an AI diagnostic system — can identify with precision.
How to Read an FFT Spectrum
The horizontal axis represents frequency (Hz or orders of running speed). The vertical axis represents amplitude (velocity or acceleration). Each peak corresponds to a specific mechanical event. The key reference is the running speed frequency — referred to as 1x — from which all other fault frequencies are expressed as multiples or fractions.
Fault Diagnosis Reference: Spectral Signatures & Steel Plant Context
| Fault Type | Primary Frequency Signature | Direction | Confirming Indicator | Steel Plant Equipment at Risk |
|---|---|---|---|---|
| Unbalance | Dominant 1x. Amplitude increases with speed² | Radial (H + V) | Stable phase at 1x. No significant harmonics | Fans, blowers, mill rolls after buildup |
| Angular Misalignment | Dominant 2x. Strong axial 1x, 2x, 3x | Axial primary, Radial | 180° phase shift across coupling in axial | Motor-gearbox couplings, drive trains |
| Parallel Misalignment | High 2x radial. 2x may exceed 1x | Radial dominant | 180° radial phase shift across coupling | Pump and blower drive couplings |
| Mechanical Looseness | Multiple harmonics 1x–10x+. Sub-harmonic 0.5x | Radial (all) | Truncated waveform. Random harmonic pattern | Foundation bolts, bearing housings |
| Outer Race Bearing Fault (BPFO) | Non-synchronous frequency = BPFO. Sidebands at 1x | Radial | Envelope analysis confirms defect pulse | All rotating equipment bearings |
| Inner Race Bearing Fault (BPFI) | Non-synchronous BPFI with modulating sidebands | Radial | Sidebands spaced at 1x on both sides of BPFI | High-load drive-end bearings |
| Gear Mesh Fault | GMF (teeth × RPM) with sidebands at shaft speed | Radial + Axial | Sidebands increase as tooth damage progresses | All gearboxes: rolling mill, crane, blower |
| Lubrication Deficiency | Broadband noise floor rise 1–20 kHz | Radial (high-freq) | Random crackling in time waveform | Rolling element bearings under load |
When to Use Envelope (Demodulation) Analysis
Standard FFT misses early-stage bearing defects because their high-frequency signals are low in amplitude and buried in broadband noise. Envelope analysis demodulates the high-frequency carrier signal (typically 5–20 kHz) to reveal the low-frequency repetitive pulse pattern — the defect frequency — up to 4–6 weeks before it becomes visible in the overall vibration trend. For steel plant rolling element bearings running under high cyclic load, envelope analysis should be applied on every critical bearing at every measurement cycle.
What Reliability Engineers Say
"In heavy industry, the most dangerous assumption is that overall vibration alone is adequate for condition monitoring. At a steel plant, an outer race bearing fault on a rolling mill drive will progress from undetectable on overall RMS to catastrophic failure in as little as 3 weeks under heavy cyclic loading. FFT with envelope analysis is not optional — it is the minimum acceptable standard."
"The transition from ISO 10816 to ISO 20816 is not just a naming change. The updated standard provides more specific guidance for a wider range of machines and requires both absolute and relative vibration evaluation for a complete picture of machine health. Any steel plant still running vibration programs exclusively on ISO 10816 overall RMS limits is missing half the diagnostic picture."
CMMS Integration: Closing the Loop from Measurement to Action
Vibration analysis produces its full value only when measurement data connects directly to work orders, asset history, and maintenance budgets. Disconnected vibration routes — data collected on a handheld analyzer that lives in a spreadsheet — cannot generate automatic work orders, cannot build failure trending history per asset, and cannot alert a supervisor when an alarm zone is breached. Integration between your vibration program and your CMMS is the step that converts analysis into action.
Continuous Sensor Data
IoT accelerometers feed live vibration data into OxMaint via OPC-UA or direct API. Alarms fire automatically when readings cross Zone C or D thresholds per asset baseline.
Automated Work Order
Threshold breach triggers a prioritized work order in OxMaint, assigned to the correct technician with fault context, historical vibration trend, and checklist pre-attached.
Fault Trend History
Every reading logs against the asset record. OxMaint builds vibration trend charts per measurement point — allowing analyst review of progression rate and prediction of remaining useful life.
Cost & CapEx Reporting
Work order completion links repair cost to asset. Recurring high-vibration assets flag for CapEx replacement review with total repair history, downtime cost, and replacement ROI pre-calculated.
OxMaint integrates vibration sensor data with automated work orders, asset trending, and ESG reporting — giving your reliability team a complete loop from measurement to corrective action.
Start Free Today Book a Free DemoFrequently Asked Questions
Integrate Vibration Analysis with Your CMMS
OxMaint connects your vibration sensor data to automated work orders, failure trend history, and CapEx decision support — giving your reliability team the complete loop from measurement to action on every critical steel plant asset.