Steel plants don't lose production to one big breakdown — they bleed it away in small, invisible losses across blast furnaces, casters, and rolling mills that never show up on a shift report. Most integrated mills run OEE between 60% and 75%, while true world-class performance sits above 85%, meaning even well-run plants are leaving 10 to 25 points of capacity unclaimed every single day. That gap is rarely a machine problem — it is a measurement problem, where manual logs hide small stoppages and speed losses until they compound into millions in lost tonnage. A CMMS-driven OEE program changes that by tracking availability, performance, and quality automatically, unit by unit, shift by shift. Start a free trial with Oxmaint to see your plant's true OEE broken down by furnace, caster, and mill instead of one blended number that hides where the losses actually live.
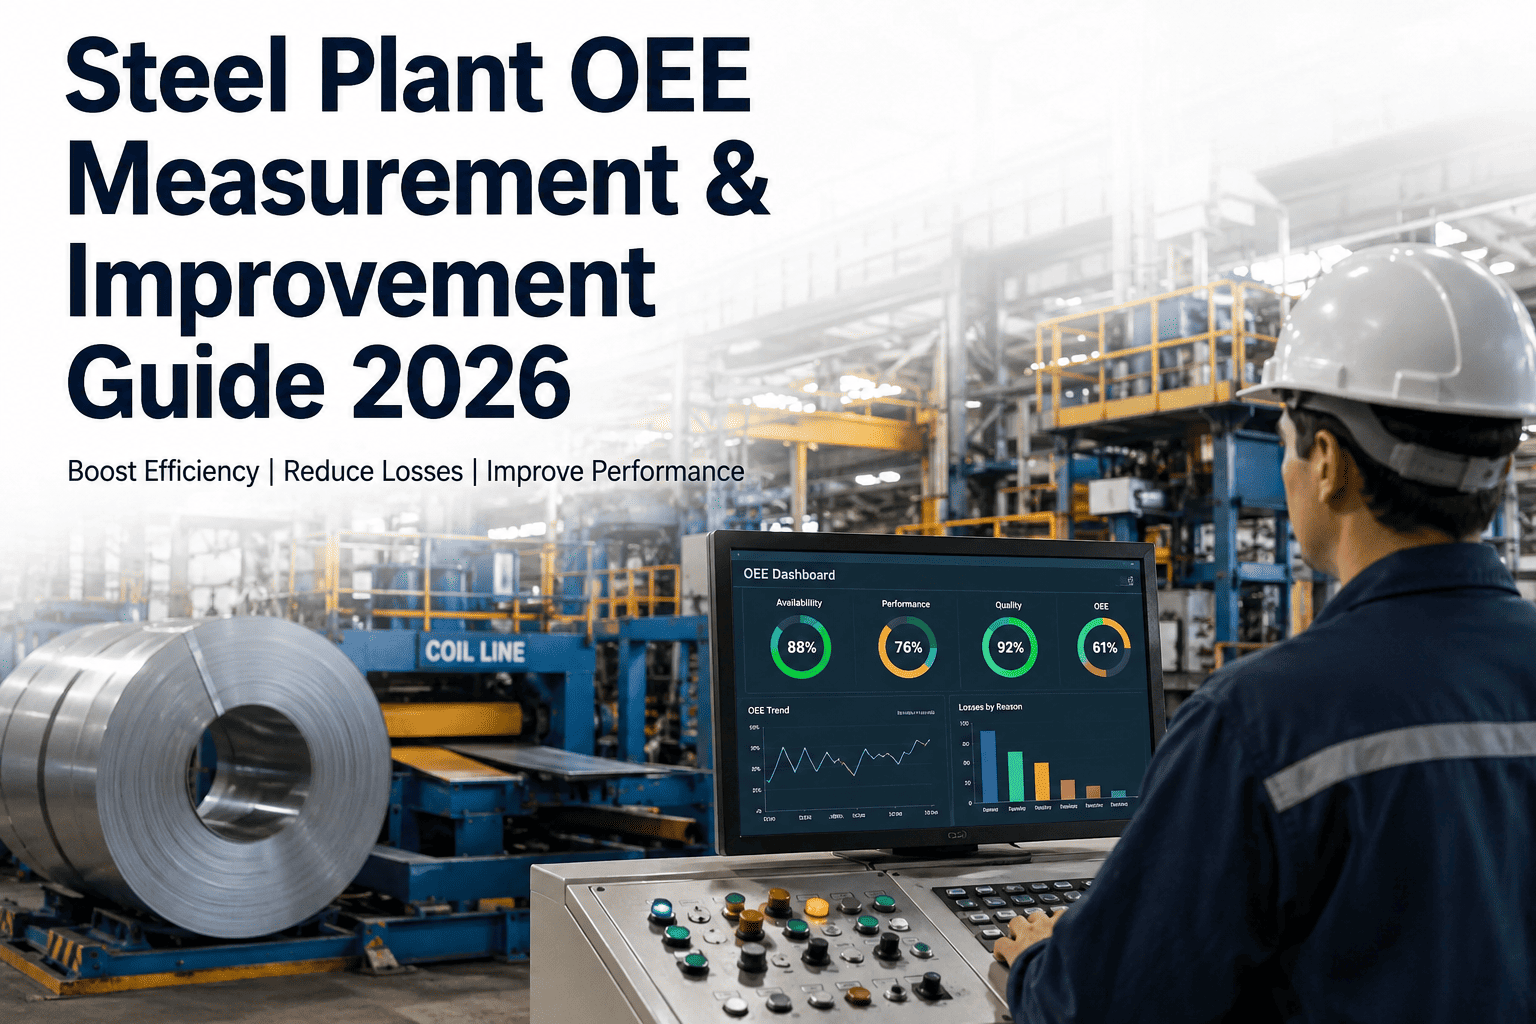
Steel Plant OEE Measurement & Improvement Guide 2026
How integrated mills and mini-mills measure availability, performance, and quality loss across blast furnaces, casters, and rolling mills — and close the gap between where they run and where world-class actually is.
Why Most Steel Plants Never See Their Real OEE
Shift-end logs and spreadsheet reconciliation almost always overstate true performance, because short stops, minor speed restrictions, and small reject batches never get written down consistently. By the time a plant manager reviews last month's numbers, the losses that actually happened are already buried under rounding and memory. The result is a mill that believes it is running in the 70s while its real, system-measured OEE sits ten or more points lower.
Availability × Performance × Quality — Where Steel Actually Loses Points
OEE multiplies three factors together, which means a small dip in each one compounds into a much larger loss overall. A rolling mill case study shows exactly how this plays out: solid-looking individual numbers still combine into a mediocre final score.
OEE by Process: Where Steel Plants Actually Lose Ground
Steel is not one process — it is a chain of distinct operations, and each one has its own OEE profile and its own dominant loss. Measuring the plant as a single blended number hides which unit is actually costing the most tonnage.
Stop Reporting One OEE Number That Hides the Real Losses
Oxmaint calculates availability, performance, and quality automatically from your work order and downtime data — by furnace, caster, and mill, not just plant-wide. See exactly where every point is going before it costs another shift of tonnage.
5 Losses Draining OEE in Steel Plants
Typical Mill vs. World-Class vs. Oxmaint-Enabled Performance
| Metric | Typical Mill | Top Quartile | World-Class | Oxmaint-Enabled |
|---|---|---|---|---|
| Availability | 70–80% | 85–90% | 90%+ | 92%+ |
| Performance | 85–90% | 92–94% | 95%+ | 95%+ |
| Quality Yield | 92–96% | 98% | 99.9%+ | 99%+ |
| Overall OEE | 60–75% | 75–80% | 85%+ | 80–85% |
| PM Compliance | 75–85% | 90% | 94%+ | 94%+ |
The 4-Step Roadmap to Closing the OEE Gap
What Closing the OEE Gap Is Actually Worth
Frequently Asked Questions
What is a realistic OEE target for a steel plant in 2026?
Most integrated mills run 60–75%, top quartile plants reach 75–80%, and world-class sits at 85%+. Book a demo to see which range fits your process mix.
Why does manual OEE tracking overstate real performance?
Shift logs miss micro-stops and small speed losses, typically inflating reported OEE by 8–15 points above the system-verified number.
Which process usually limits OEE the most in a steel plant?
Availability is usually the primary constraint, especially on blast furnace cooling systems and rolling mill drives with heavy maintenance demand.
How does Oxmaint calculate OEE automatically?
Oxmaint pulls availability, performance, and quality directly from work order and downtime data by unit, with no manual spreadsheet work. Start a free trial to connect your data.
How much OEE improvement can a mill expect in a year?
Structured programs typically recover 8–15 OEE points in 12–18 months from a 50–65% starting baseline, with smaller gains once above 70%.
See Your Plant's Real OEE — By Furnace, Caster, and Mill
Oxmaint turns work order and downtime data into automatic availability, performance, and quality tracking, so every loss is visible before it costs another ton of production.