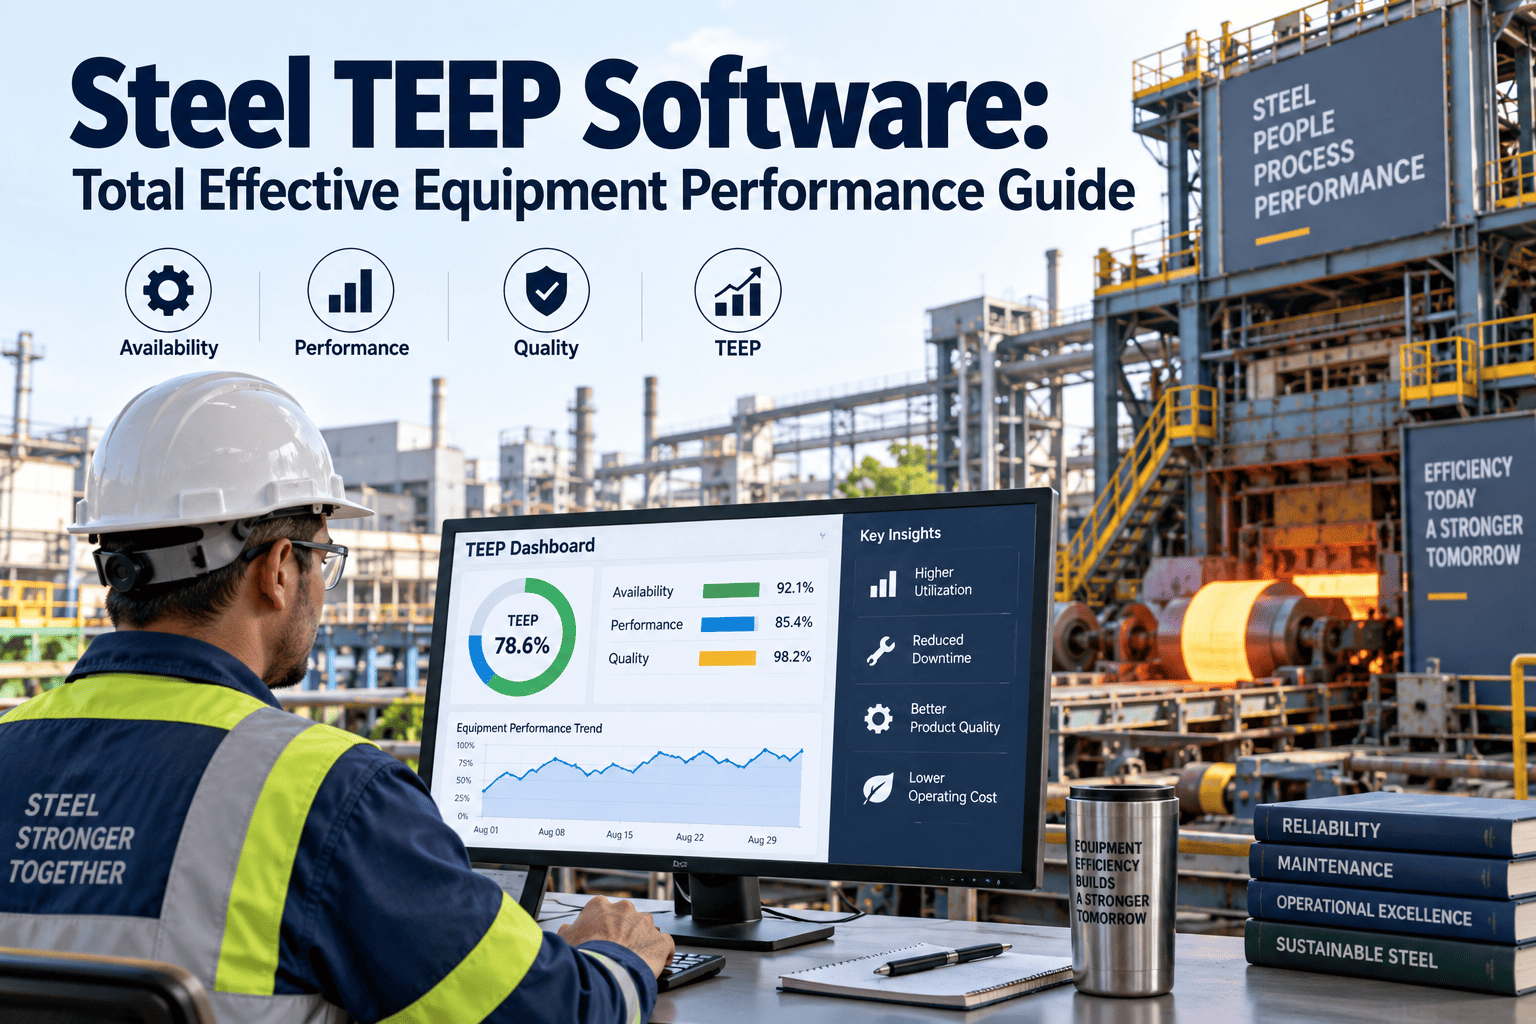
A rolling mill can post a flattering ninety percent OEE for the week and still be sitting idle more often than it is running, because OEE only ever looks at the hours the plant chose to schedule. Total Effective Equipment Performance answers a different question: out of every hour on the calendar, nights, weekends, and planned outages included, how many of them actually produced good steel at the rate the asset was built for. That single reframing is why capital committees and plant directors reach for TEEP when the conversation turns to adding a shift, buying a new line, or justifying why an idle caster is not the same problem as a broken one. Start a free trial to see TEEP calculated automatically alongside OEE for every line in your plant.
Steel TEEP Software: Total Effective Equipment Performance Guide
TEEP is the metric that exposes the capacity a steel plant already owns but never uses. This guide walks through how it is calculated, why it always sits below OEE, what a realistic benchmark looks like for your shift pattern, and how a CMMS turns the number from a quarterly spreadsheet exercise into a live figure every plant director can trust without waiting on someone else's export.
The first three factors are the same ones used in OEE. Utilization is the difference: it measures scheduled production time against every hour on the calendar, which is why TEEP is always equal to or lower than OEE for the same line.
Why TEEP Reads Lower Than OEE, And Why That Is The Point
A line running a confident ninety-five percent OEE on two eight-hour shifts is not a ninety-five percent capacity story once schedule losses enter the picture. TEEP forces that conversation by treating every hour of the year as available capacity, not just the hours someone chose to schedule. The gap between a strong OEE score and a much lower TEEP score is not bad news; it is a map of exactly how much output is sitting on the table without buying a single new machine.
A Worked Example From A Hot Rolling Line
Numbers make the gap between OEE and TEEP concrete faster than any definition can. Take a hot rolling line running two eight-hour shifts, five days a week, with strong performance during those scheduled hours.
Nothing about the equipment changed between the OEE figure and the TEEP figure in that example. The only thing that changed was the time base, and that shift in perspective is usually enough to move an added-shift proposal ahead of a new-equipment proposal on the priority list.
Common Mistakes When Reading A TEEP Number
TEEP is a simple calculation, but it is easy to misread if the context around the number gets dropped. These are the three interpretation mistakes that show up most often in steel plant reviews.
See Your Real Capacity Number, Not Just Your OEE Score
Oxmaint calculates OEE, TEEP, and OPE from the same live production and downtime data, so plant directors get a capacity figure they can defend in a capital planning meeting instead of rebuilding it in a spreadsheet every quarter.
OEE vs TEEP vs OPE: Three Lenses, Three Decisions
Steel plants that track only one effectiveness metric are usually missing a decision that metric was never built to inform. The comparison below lines up all three against the question each one is actually good at answering.
| Metric | Denominator | Decision It Informs |
|---|---|---|
| OEE | Scheduled production time only | Where to fix equipment losses during the hours already being run |
| TEEP | All calendar time, twenty four by seven | Whether to add a shift, add a line, or invest in new capacity |
| OPE | Scheduled time, weighted by workforce factors | How much of the equipment loss traces back to staffing and skill gaps |
| Utilization | Calendar time against scheduled time | Whether schedule design, not equipment, is the real ceiling on output |
Benchmark TEEP By Shift Pattern
A good TEEP score depends entirely on how many hours a line is scheduled to run in the first place, so comparing your number against an arbitrary industry average is close to meaningless. Compare it instead against the ceiling your own shift pattern allows.
Find Out Where Your Line Sits Against Its Realistic Ceiling
A short working session maps your current TEEP, OEE, and schedule pattern against the benchmarks above, so you walk away with a number grounded in your own shift design rather than a generic industry figure.
Turning Schedule Loss Into A Capacity Decision
Once TEEP separates schedule loss from equipment loss, the conversation in a capital planning meeting changes shape. Instead of a director asking for a new caster because the current one feels stretched, the data can show whether an additional weekend shift on the existing line closes most of the gap for a fraction of the capital cost.
Who Actually Uses The TEEP Number
TEEP rarely belongs to a single job title in a steel plant. It moves between three different audiences, and each one asks it a slightly different question depending on what decision they are trying to make that quarter.
Our OEE numbers looked strong for years, so the case for a second caster kept getting delayed for other priorities. It was only when we lined OEE up against TEEP that the actual story came out: the equipment was fine, but we were only scheduling it two thirds of the calendar year. Adding weekend coverage on the existing line closed most of the gap that a new caster would have addressed, at a fraction of the capital and lead time. Now every capacity request on my desk has to show its TEEP trend first, before anyone talks about a purchase order.
From A TEEP Number To A Capacity Decision That Sticks
Calculating TEEP once is straightforward, and most plants can do it by hand for a single line in an afternoon. The harder part is keeping it current across every line, every shift pattern, and every planned maintenance calendar, month after month, without the number quietly going stale between capital planning cycles. That is the part a spreadsheet tends to lose, usually right around the time someone changes roles and the calculation method comes apart at the seams.
A CMMS that already tracks production time, downtime reason codes, and quality outcomes at the line level can calculate OEE and TEEP as a byproduct of data it is collecting anyway, rather than as a separate reporting exercise bolted on afterward. That live number is what lets a plant director walk into a capital review with a defensible capacity story instead of a slide built from last quarter's export, and it is what turns TEEP from an interesting metric into a decision-making tool the whole leadership team actually reaches for.
Frequently Asked Questions
Stop Guessing At Capacity, Start Measuring It
Oxmaint tracks OEE, TEEP, and OPE side by side for every line in your plant, live, so the next capacity decision is backed by a number the whole leadership team already trusts.