A steel plant running eight thousand PM tasks a year looks disciplined on paper — schedule compliance sits at 95%, technicians are busy every shift, and the CMMS dashboard reports green across the board. None of that tells you whether those eight thousand tasks are actually catching failures or just consuming technician hours that could have gone somewhere that mattered. Industry data on PM optimization consistently shows that over half of a typical PM program's task list can be eliminated or replaced with condition-based monitoring without any increase in failures, because tasks accumulate over years and nobody ever goes back to ask whether a given task has caught a single real problem. The fix is not running more PMs or fewer PMs — it is measuring which specific tasks are earning their spot on the schedule and which ones are simply busywork wearing a compliance report as camouflage. Oxmaint scores every PM task against its own failure-prevention record automatically — start a free trial to see which tasks in your own program are actually paying for themselves.
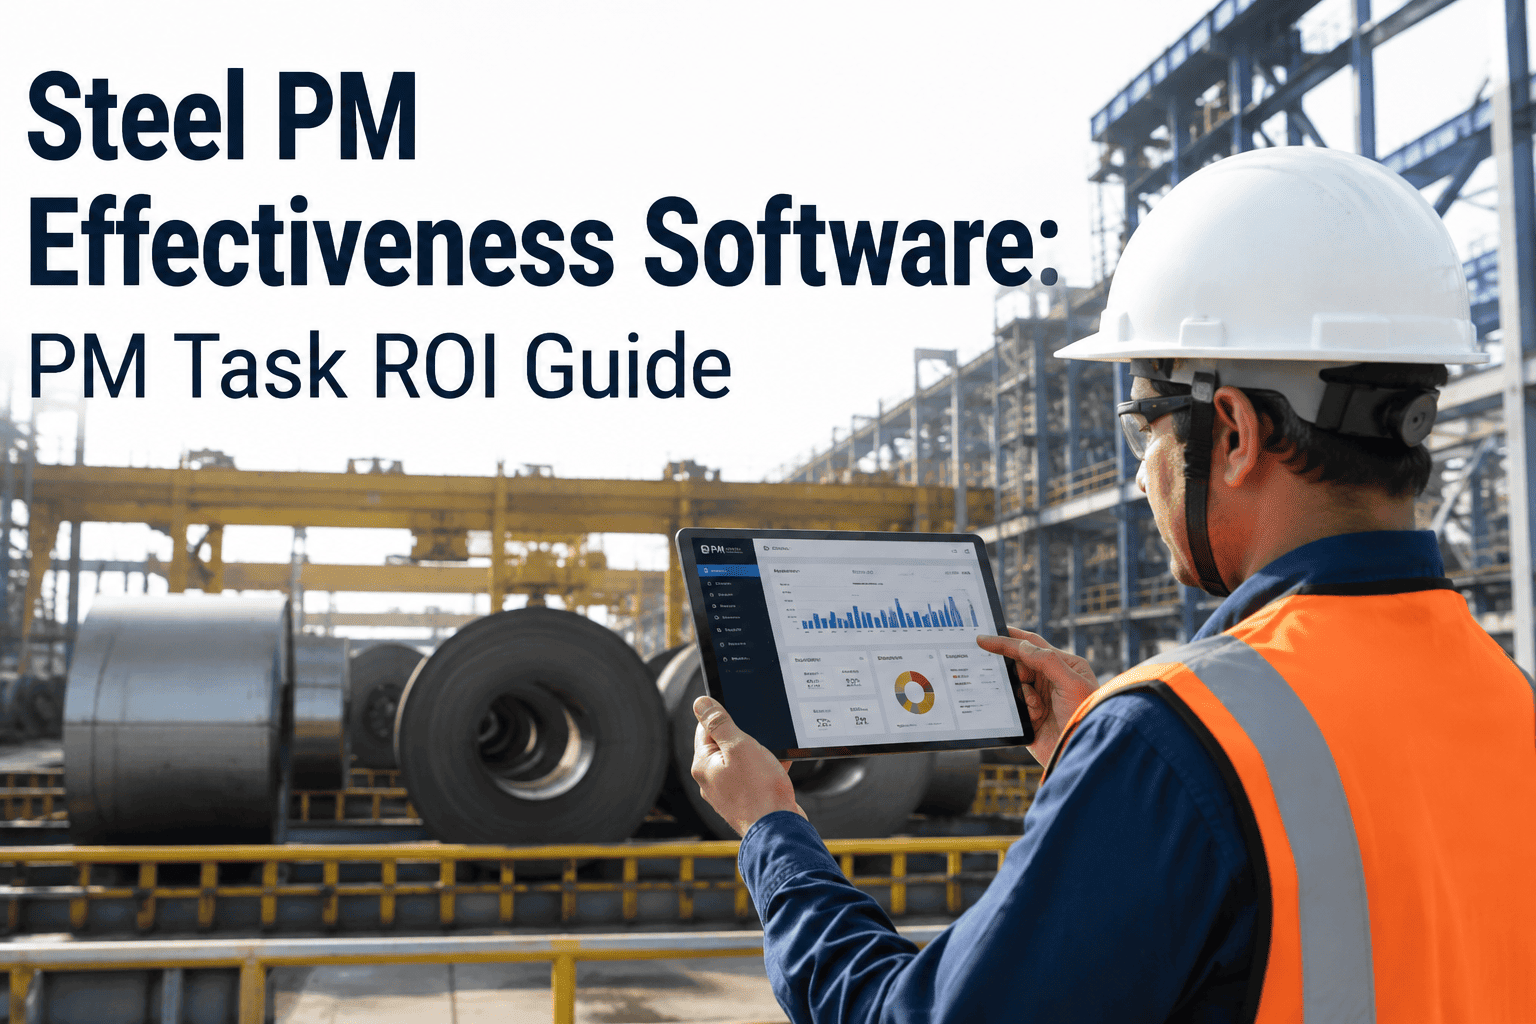
Steel PM Effectiveness Software: Measure PM Task ROI, Not Just Completion Rate
Score every preventive maintenance task against the failures it has actually caught and the labor it actually costs — so a busy PM program and an effective one finally look different.
Why a Full PM Schedule Isn't the Same as an Effective One
Steel plant PM lists rarely shrink — they only grow. A near-miss on a caster segment bearing gets a new weekly vibration check added the following month. A rolling mill guide roller failure gets a daily visual inspection tacked onto the route. Each addition made sense the day it was written, as a direct reaction to a real incident. What almost never happens is the follow-up question two or three years later: has this task ever actually caught anything, or has the plant been paying a technician to walk past the same healthy component every week since?
That accumulation is how a plant ends up with a PM program that looks rigorous on a compliance dashboard while quietly wasting a large share of its technician hours. PM completion rate measures whether the task got done, not whether doing it prevented anything. A plant can hit 95% schedule compliance and still be running dozens of grease routes, visual checks, and torque verifications that have never once flagged a developing failure — hours that could have gone toward the caster and EAF assets where a missed inspection genuinely costs production.
Over-maintenance is the quieter half of this trap, and it is often the more expensive one because it hides inside a maintenance budget that already looks responsible. A plant spending heavily on PM labor is not automatically a well-maintained plant — it may simply be a plant paying twice: once for tasks that prevent nothing, and again when the technician hours that could have gone to assets that actually need attention are already spoken for on routes that never find anything wrong.
Four Numbers That Actually Measure PM Effectiveness
Schedule compliance answers one question — did the task happen. These four metrics answer the question that actually matters — was doing it worth it.
The share of a task type's inspections that actually detect a developing problem, versus the share that find nothing at all. A ratio that stays near zero across dozens of cycles signals a task targeting the wrong failure mode or running far more often than it needs to.
The dollar value of failures avoided by a specific task, divided by the labor cost of performing it — calculated at the individual task level, not averaged across the whole program where good and bad tasks cancel each other out.
How much diagnostic value a technician generates for every hour spent on a given inspection route — a figure that is directly comparable across crews, shifts, and asset zones.
The share of work orders that are still emergency or reactive despite an existing PM covering that exact asset — the clearest sign that a task is present on the schedule but not actually doing its job.
How to Calculate PM Task ROI for a Single Task
PM Task ROI is the one metric that turns "does this task feel useful" into a number a plant manager can defend in a budget review. It is built from two figures every plant already has somewhere in its work order history.
Applied to real tasks, the spread between a strong performer and a zero-yield one is usually far wider than plants expect once the numbers are actually pulled together and compared side by side.
| PM Task | Avoided Failure Cost / Year | Task Labor Cost / Year | ROI | Verdict |
|---|---|---|---|---|
| Caster Segment Bearing Vibration Check | $84,000 | $3,200 | 25:1 | Keep |
| EAF Electrode Arm Hydraulic Seal Inspection | $46,000 | $2,800 | 15:1 | Keep |
| Walking Beam Furnace Skid Pad Monthly Visual | $6,200 | $9,800 | -37% | Reengineer interval |
| Rolling Mill Guide Roller Weekly Grease Check | $0 (3-year zero catch) | $11,400 | -100% | Eliminate or replace with PdM |
What to Do With a Task Once You Know Its ROI
Every audited task lands in one of four buckets, and the ROI figure combined with the failure-prevention ratio is usually enough to decide which one without a lengthy debate.
| Classification | When It Applies | Typical Action |
|---|---|---|
| Keep | Strong ROI, regularly catches real developing failures | No change — protect the task and its current interval |
| Reengineer | Catches issues occasionally but interval or method is inefficient | Adjust frequency or inspection method to raise the hit rate |
| Replace with PdM | Failure mode is real but better detected by condition monitoring | Swap manual inspection for vibration, thermal, or oil analysis sensors |
| Eliminate | Zero-yield across a long history, failure mode not credible for this asset | Remove from schedule, redirect the reclaimed hours |
Find Out Which PM Tasks Are Actually Paying for Themselves
Oxmaint ties every PM task to the failures it has caught and the labor hours it has cost, so the plant can finally tell a busy schedule apart from an effective one.
Busy PM Program vs. a Value-Verified PM Program
The task count on the schedule can stay roughly the same between these two states — what changes is whether anyone can say which tasks on it are actually worth doing.
How Oxmaint Automates PM Effectiveness Tracking End-to-End
None of this works if scoring every task requires a spreadsheet project once a year. Oxmaint builds the ROI and effectiveness figures from the work order history the plant is already generating.
Automatically ties each PM task to the failures it has, or hasn't, caught and the labor hours spent, producing an ROI figure per task instead of a program-wide guess.
Tracks what share of a task type's inspections actually find something over time, broken out by asset class and by technician.
Flags assets where PM is scheduled and completed but emergency work orders keep appearing anyway, exposing tasks that miss the real failure mode.
Quantifies the technician hours reclaimed when a zero-yield task is eliminated or its interval extended, translated into dollars redirected to higher-value work.
Routes every audited task into Keep, Reengineer, Replace with PdM, or Eliminate, with the rationale attached and shared with the crew performing it.
Reopens task ROI on a recurring schedule so a task justified two years ago gets re-evaluated instead of running unquestioned indefinitely.
What a Value-Verified PM Program Changes on the Floor
The gain shows up as reclaimed technician hours, fewer surprise failures on assets that already had a PM assigned, and a maintenance budget conversation with real numbers behind it instead of a headcount request.
Frequently Asked Questions
Does Oxmaint calculate PM Task ROI automatically, or do we need to enter avoided-failure values manually?
The ROI figure builds from your existing work order and failure history, pulling avoided-cost estimates from linked corrective work orders automatically. Start a free trial to see your own task list scored.
How does the platform decide whether a task should be eliminated versus just reengineered?
A task with a long zero-yield history and a low-consequence failure mode gets flagged for elimination, while one that occasionally catches something but at the wrong interval gets flagged for reengineering instead.
Can we see PM effectiveness broken down by crew or shift, not just by task?
Yes — defects found per inspection hour and failure-prevention ratio can both be filtered by technician, crew, and shift to spot where inspection quality varies.
Does removing a low-ROI task get communicated to the technicians who perform it?
Yes — every classification change carries its rationale, and it is shared with the crew affected so a removed task does not quietly get reinstated out of caution. Book a demo to see the classification workflow in action.
How often should PM Task ROI actually be recalculated?
Failure patterns shift as equipment ages and operating conditions change, so Oxmaint reopens each task's ROI on a recurring cadence instead of scoring it once and leaving the verdict in place indefinitely.
Stop Measuring PM by Completion Rate Alone
Oxmaint scores every PM task by the failures it has actually caught and the labor it actually costs, so a full schedule and an effective one finally mean the same thing. Free trial, no credit card required.