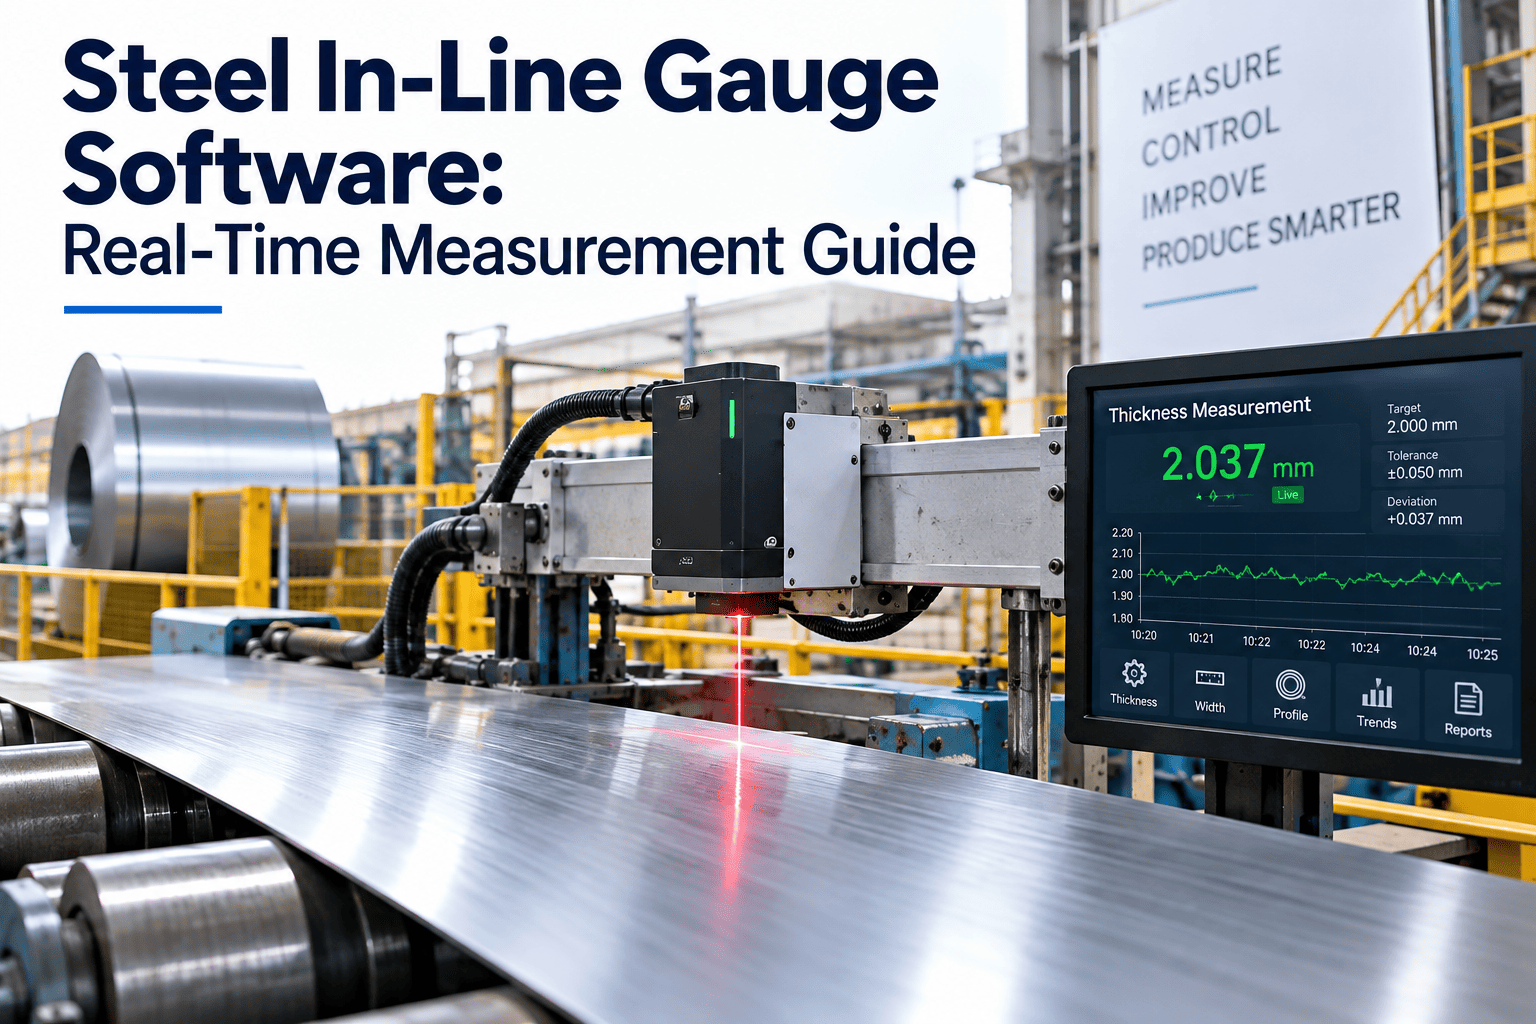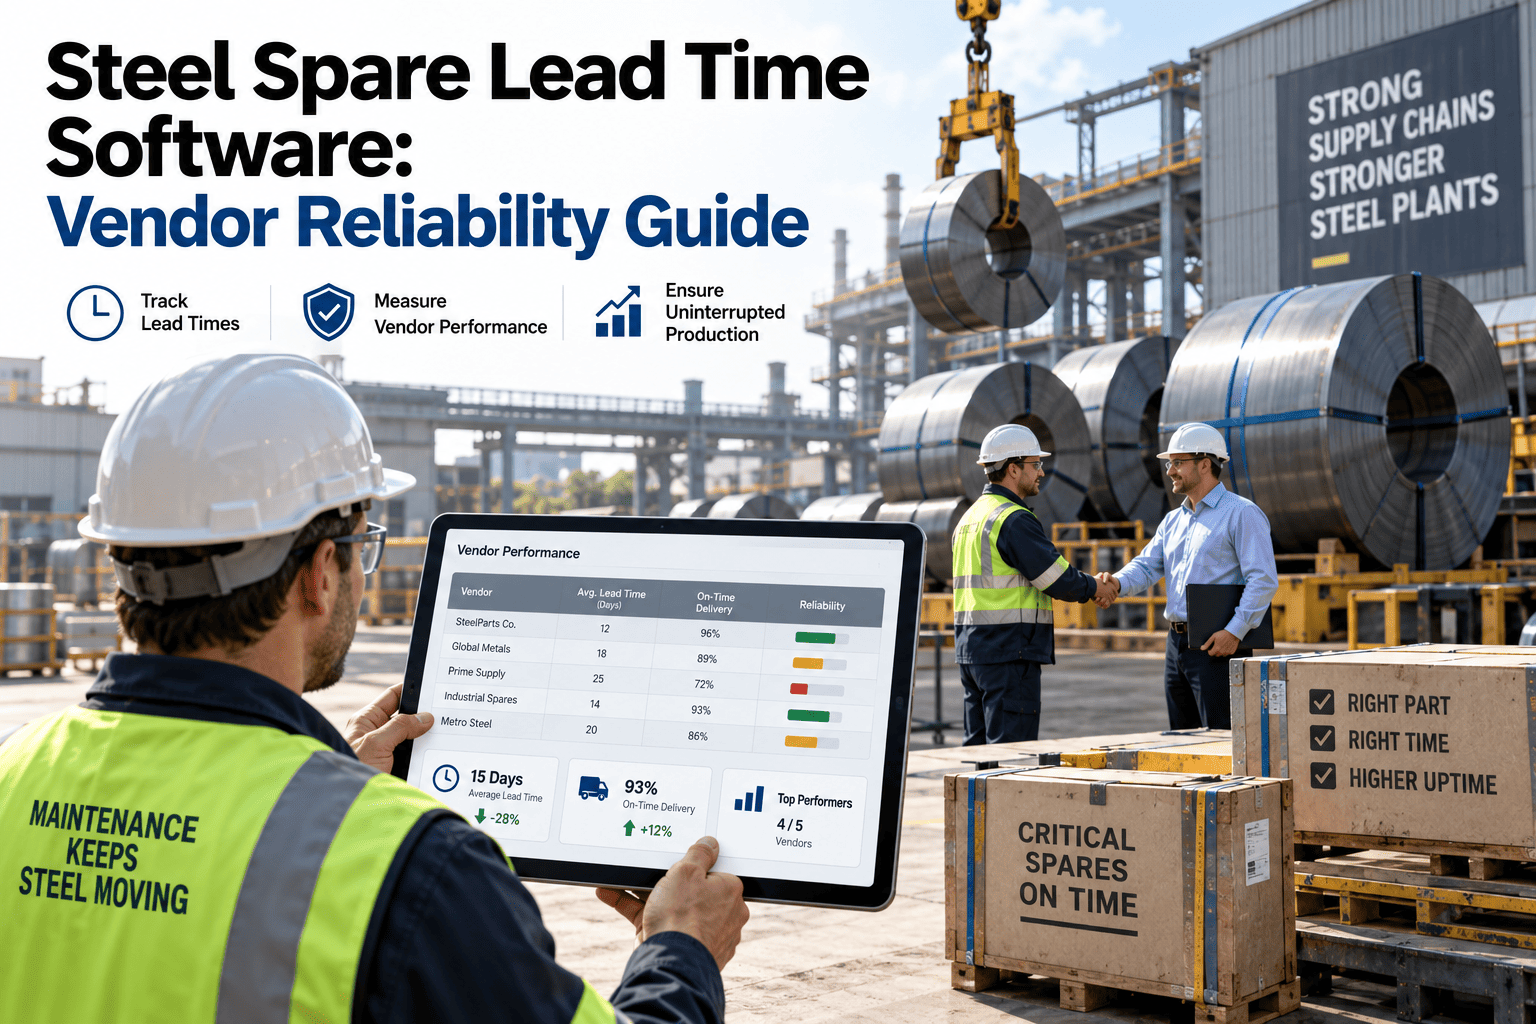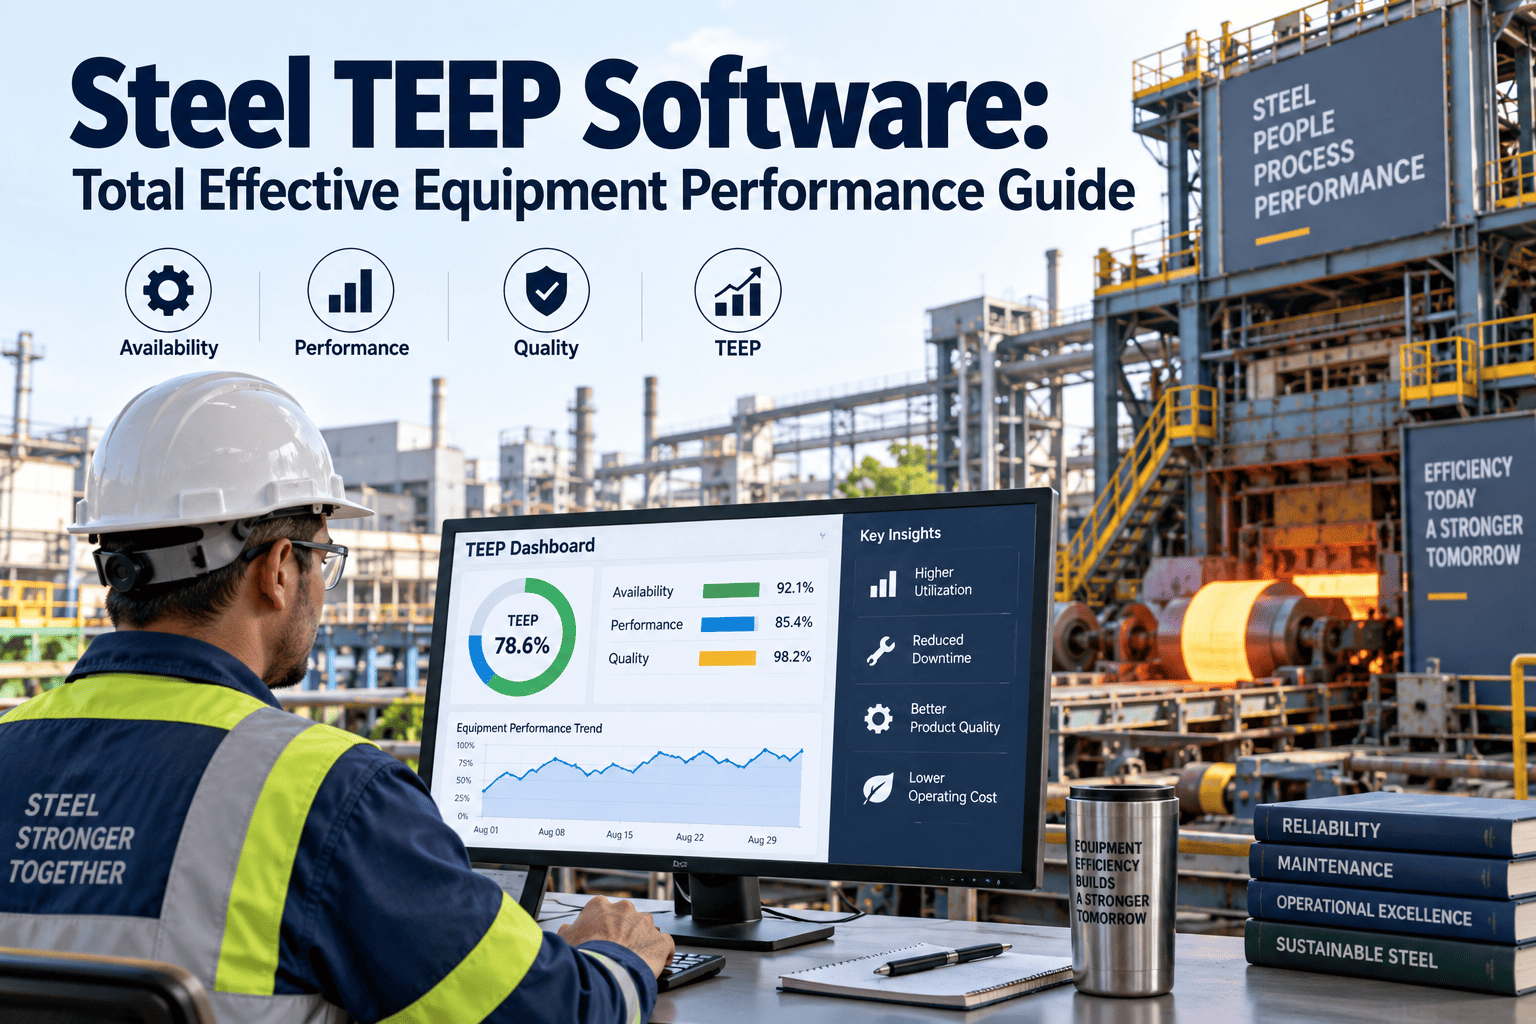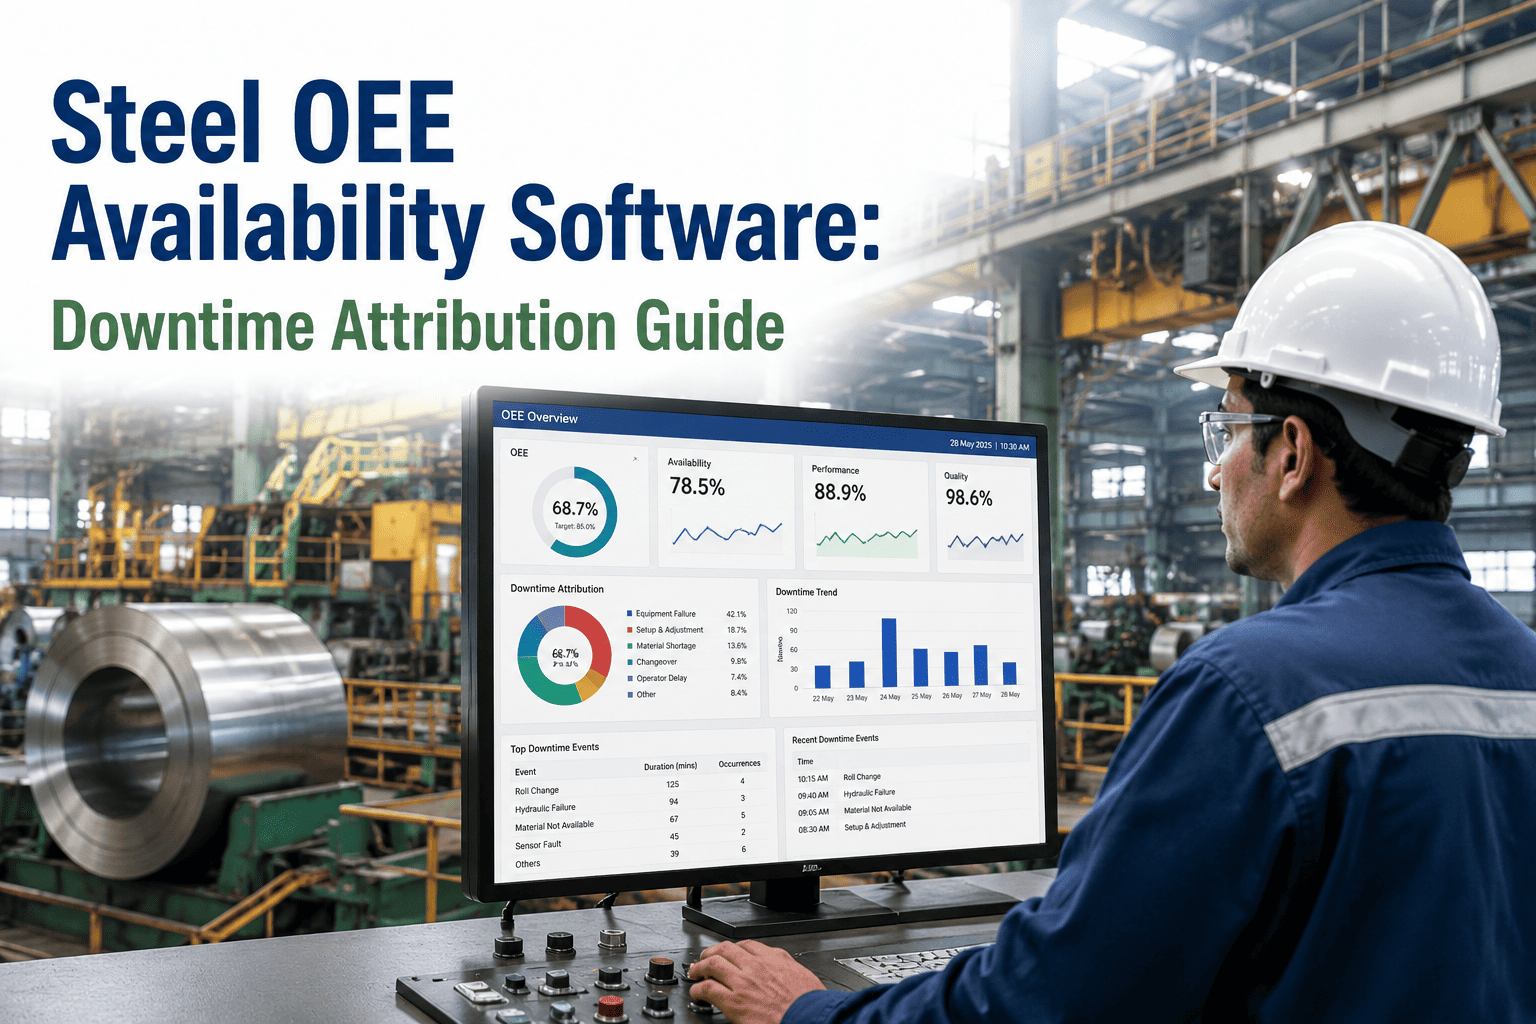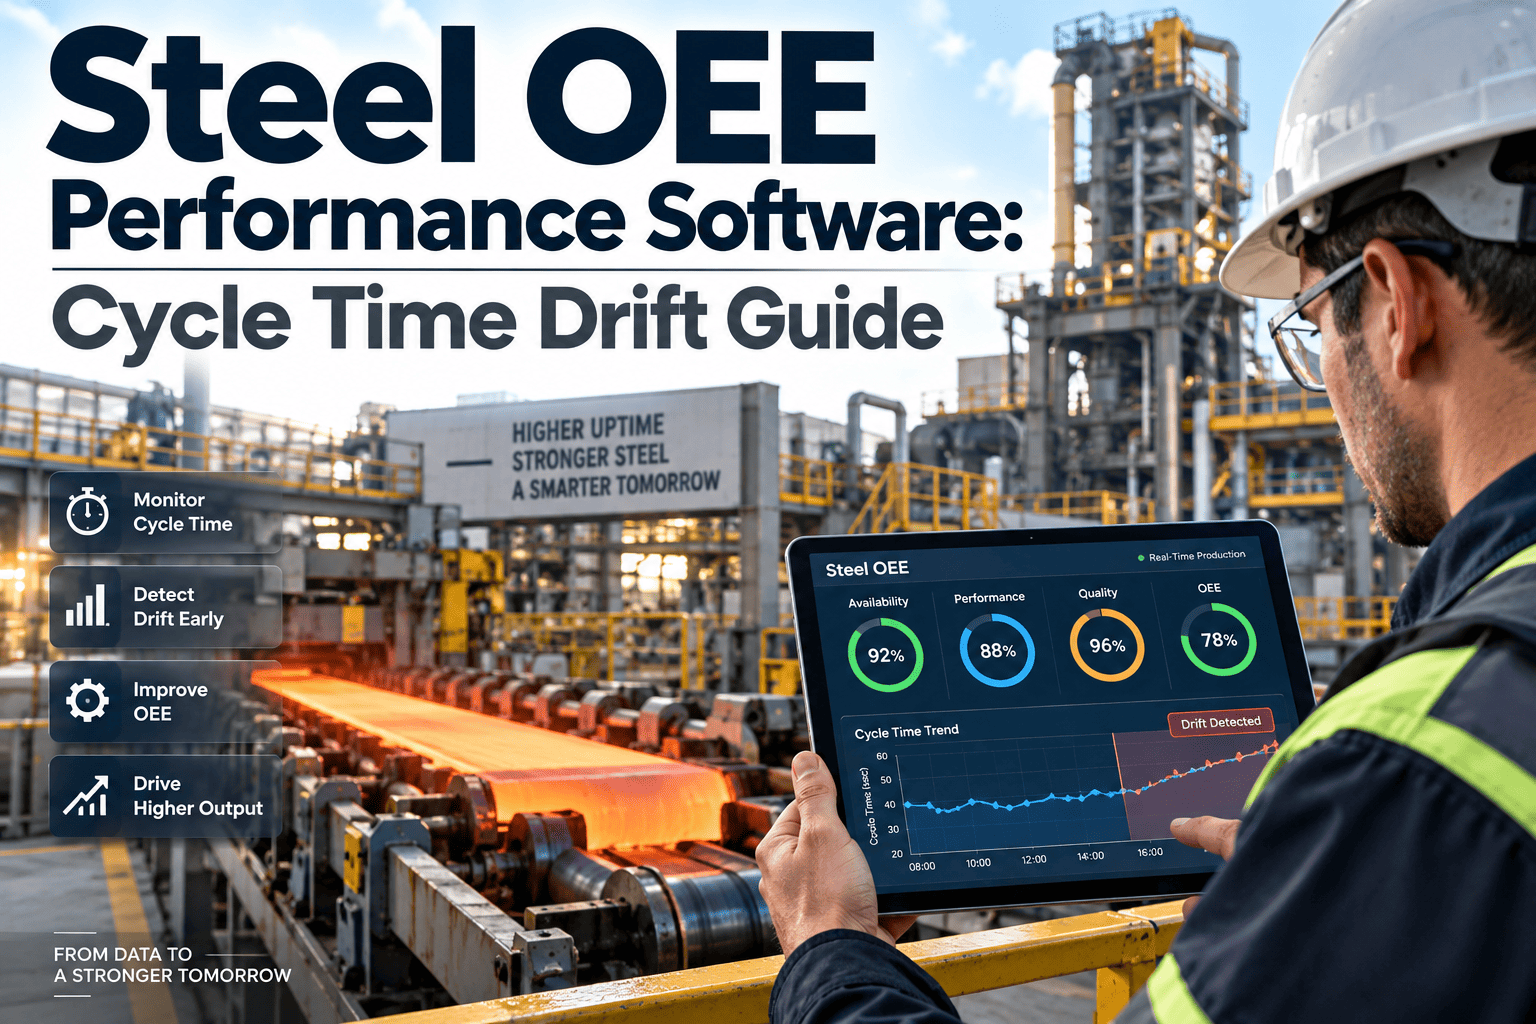
Steel producers spend years tightening availability — reducing unplanned downtime, cutting changeover time, eliminating breakdowns — only to find OEE still plateaus somewhere between 55% and 65%. The reason is almost always performance loss: the gap between how fast a rolling mill, caster, or finishing line could theoretically run and how fast it actually runs, shift after shift. Cycle time drift creeps in through roll wear, temperature swings, guide misalignment, and operator-paced slowdowns that never trigger a stoppage alarm but quietly erode throughput all day long. Small stops under five minutes compound the same way — invisible on their own, devastating in aggregate across a 24-hour cast. Most maintenance platforms track downtime well and performance loss poorly, which is exactly the gap OxMaint's steel performance monitoring module is built to close.
Close the Performance Gap Standard CMMS Tools Miss
OxMaint tracks ideal cycle time against actual cycle time per line, flags speed loss and small stops in real time, and turns performance drift into a prioritized work order before it becomes a quarter-point of lost OEE.
Why Performance Is the Overlooked Pillar of Steel OEE
OEE is built from three multiplied factors — availability, performance, and quality — and steel plants tend to invest maintenance budget almost entirely in the first one. Availability problems are loud: a caster trip or a mill breakdown stops the line, pages the on-call technician, and shows up on every shift report without anyone needing to go looking for it. Performance loss is quiet. A rolling mill running at 92% of its rated speed instead of 100% never stops, never pages a technician, and never appears on a downtime Pareto chart. Over a full shift, that 8% gap compounds into tonnage that simply never gets produced, with no maintenance event to explain where it went. OxMaint's performance dashboards convert this invisible loss into a visible, trackable number per asset, per shift, per crew.
Cycle Time Drift: The Slow Leak Behind Falling Tonnage
Cycle time drift is the gradual divergence between a line's ideal cycle time — the speed the equipment was rated and commissioned to run at — and its actual cycle time under real production conditions. On a hot strip mill or a wire rod line, drift accumulates from roll surface wear changing friction and draft, bearing degradation adding resistance, temperature variance shifting rolling loads, and guide misalignment forcing operators to slow feed rates to avoid cobbles. None of these conditions stop the line. All of them add seconds per pass that never get reclaimed. A mill drifting from a 12-second ideal cycle to a 13.5-second actual cycle is running 11% slower with zero downtime logged against it, and that gap will keep widening for as long as the underlying roll or bearing condition goes unaddressed, since drift is rarely self-correcting once it starts.
| Line Type | Ideal Cycle Time | Typical Actual Cycle Time | Drift Impact |
|---|---|---|---|
| Hot Strip Mill | 10-12 sec/pass | 11-14 sec/pass | 8-15% throughput loss |
| Wire Rod Line | 0.9-1.1 sec/coil | 1.0-1.3 sec/coil | 10-18% throughput loss |
| Continuous Caster | 1.4-1.8 m/min | 1.2-1.6 m/min | 5-12% throughput loss |
| Bar Mill | 0.6-0.8 sec/bar | 0.7-0.9 sec/bar | 8-14% throughput loss |
Drift rates vary by process area but follow a consistent pattern: the loss is small enough per shift to be dismissed, and large enough over a quarter to change a plant's annual tonnage forecast. A wire rod line drifting by even half a second per coil across three shifts a day adds up to thousands of fewer coils produced over a month, at a cost that never appears as a line item anywhere because no single event caused it, which is precisely why it survives budget reviews that are built to catch large, discrete losses rather than a slow accumulation of small ones. The reason cycle time drift survives so long uncorrected is that it looks like a process decision rather than a maintenance issue. An operator who slows a line to avoid cobbles is making a reasonable call in the moment — but if that slowdown is compensating for a roll that should have been changed two weeks earlier, the root cause is maintenance, not operations. OxMaint links cycle time trend data to the underlying asset's maintenance history, so a drifting mill automatically surfaces its last roll change, last bearing inspection, and last alignment check next to the performance curve.
What Unmanaged Performance Loss Actually Costs
Performance loss rarely shows up as a single dramatic number — it shows up as a gap between planned tonnage and actual tonnage that finance notices before maintenance does. The waterfall below breaks down how small, individually forgivable losses stack into a material production shortfall over a single production month at a mid-size finishing mill.
Turning Performance Data Into Action
Tracking performance loss only creates value when it converts into a work order, a roll change, or a process adjustment before the drift compounds further. That requires pulling cycle time, stop-frequency, and speed data directly from line PLCs and comparing it continuously against each asset's ideal-cycle baseline, rather than reviewing it manually at end of shift, by which point the drift has already cost the plant several hours of throughput that no after-the-fact report can recover.
Setting Realistic Performance Targets by Process Area
A single plant-wide performance target rarely makes sense across a steel operation, because each process area carries a different relationship between speed and product risk. A caster running too fast risks breakout conditions that can shut the whole line down for hours, so its realistic performance ceiling sits closer to its ideal cycle time with tighter tolerance bands. A finishing line has more room to run near its rated speed without the same catastrophic downside, so its performance target can be set more aggressively. Treating every asset against the same blanket percentage either sets unachievable targets on high-risk equipment or leaves easy gains unclaimed on lower-risk equipment, and either mistake tends to erode the credibility of the whole performance tracking program with the operators and crew leads who are expected to act on it.
Setting these targets is only the starting point. The bigger operational shift is building a weekly review cadence where cycle time trend, small stop frequency, and speed-loss shift reports are reviewed alongside the maintenance backlog rather than as a separate operations-only conversation. When a rod mill's cycle time has drifted past its threshold for three consecutive shifts, that pattern should generate a work order automatically instead of waiting for someone to notice it in a monthly report. Plants that close this loop consistently report the fastest OEE gains, because performance loss is corrected while it is still small rather than after it has become the accepted new normal for that line.
Rolling out performance tracking well typically follows three phases. First, every critical line gets a documented ideal cycle time baseline, sourced from OEM specification sheets or the best sustained historical run if no formal baseline exists. Second, PLC or historian data feeds are connected so cycle time, stop events, and speed are captured continuously rather than sampled manually once per shift. Third, drift thresholds are set per asset and tied to automatic work order generation, closing the gap between detecting a performance problem and assigning someone to fix it. Plants that skip the third phase often end up with excellent dashboards that nobody acts on — the data exists, but the workflow to convert it into a maintenance response does not.
We had spent two years chasing availability and barely moved OEE. Once we started tracking cycle time drift on the rod mill, we found a roll change interval that had quietly stretched from three weeks to five. Tightening it back up recovered almost four OEE points in a single quarter — without a single dollar of new equipment.
See Where Your OEE Is Actually Leaking
OxMaint compares live cycle time against ideal baselines, aggregates small stops by cause, and links every performance drift back to the maintenance history that explains it.
Common Challenges in Steel Performance Tracking
No Agreed Ideal Cycle Time
Many lines never had a formally documented ideal cycle time recorded at commissioning, so drift has nothing to be measured against. Establishing a defensible baseline from OEM specs or best-historical-performance is the first step before any drift tracking is meaningful.
Small Stops Absorbed Into Run Time
Stops under the alarm threshold are frequently counted as normal running time by default, which flattens the very signal that would reveal a recurring jam point. Aggregating sub-threshold stops separately is what makes the pattern visible.
Operator Speed Adjustments Treated as Normal
When operators routinely slow a line to compensate for a known equipment issue, that adjustment becomes the accepted baseline over time, masking a maintenance need that should have been addressed months earlier.
Performance and Maintenance Data Living Apart
Process historians track cycle time and speed, while CMMS platforms track work orders and parts — and the two systems rarely talk. Without that link, a drifting line and a skipped roll change look like two unrelated facts instead of one story, and the team investigating the performance loss ends up rebuilding a timeline by hand that the maintenance system should have already been able to produce in seconds.
Frequently Asked Questions
What causes cycle time drift on a steel rolling mill?
Roll surface wear, bearing degradation, thermal variance in the strip, and guide misalignment are the most common causes. Each adds resistance or risk that forces a slightly slower pass, and the effect compounds over the roll's service life. OxMaint's cycle time tracking links drift trends to roll change history automatically.
How is performance loss different from availability loss in OEE?
Availability loss comes from stopped equipment — breakdowns and changeovers. Performance loss comes from equipment that is running but not at its rated speed, plus small stops too brief to count as downtime. Both reduce OEE, but performance loss is far harder to see without dedicated tracking.
Why do small stops matter if each one is only a minute or two?
A single one-minute stop is negligible, but a line experiencing twenty such stops per shift loses twenty minutes of production time that never appears on a downtime report. Aggregating small stops by cause code is the only way to see the pattern and fix the recurring source.
How often should ideal cycle time baselines be reviewed?
Baselines should be revisited after any major equipment upgrade, roll change program revision, or product mix shift, and reviewed at least annually otherwise. A stale baseline either hides real drift or falsely flags normal variance as a problem.
Can a CMMS actually track cycle time and speed loss, or just downtime?
Traditional CMMS platforms are built around downtime and work orders. A performance-capable platform pulls continuous cycle time and speed data from line PLCs and compares it against baselines in real time. Book a demo to see how OxMaint handles both.
Stop Losing OEE Points to Losses You Can't See
OxMaint turns cycle time drift, small stops, and speed loss into tracked, actionable data — connected to the maintenance history that explains them.