analytics-and-reporting-roi-guide-for-airports-maintenance-leaders

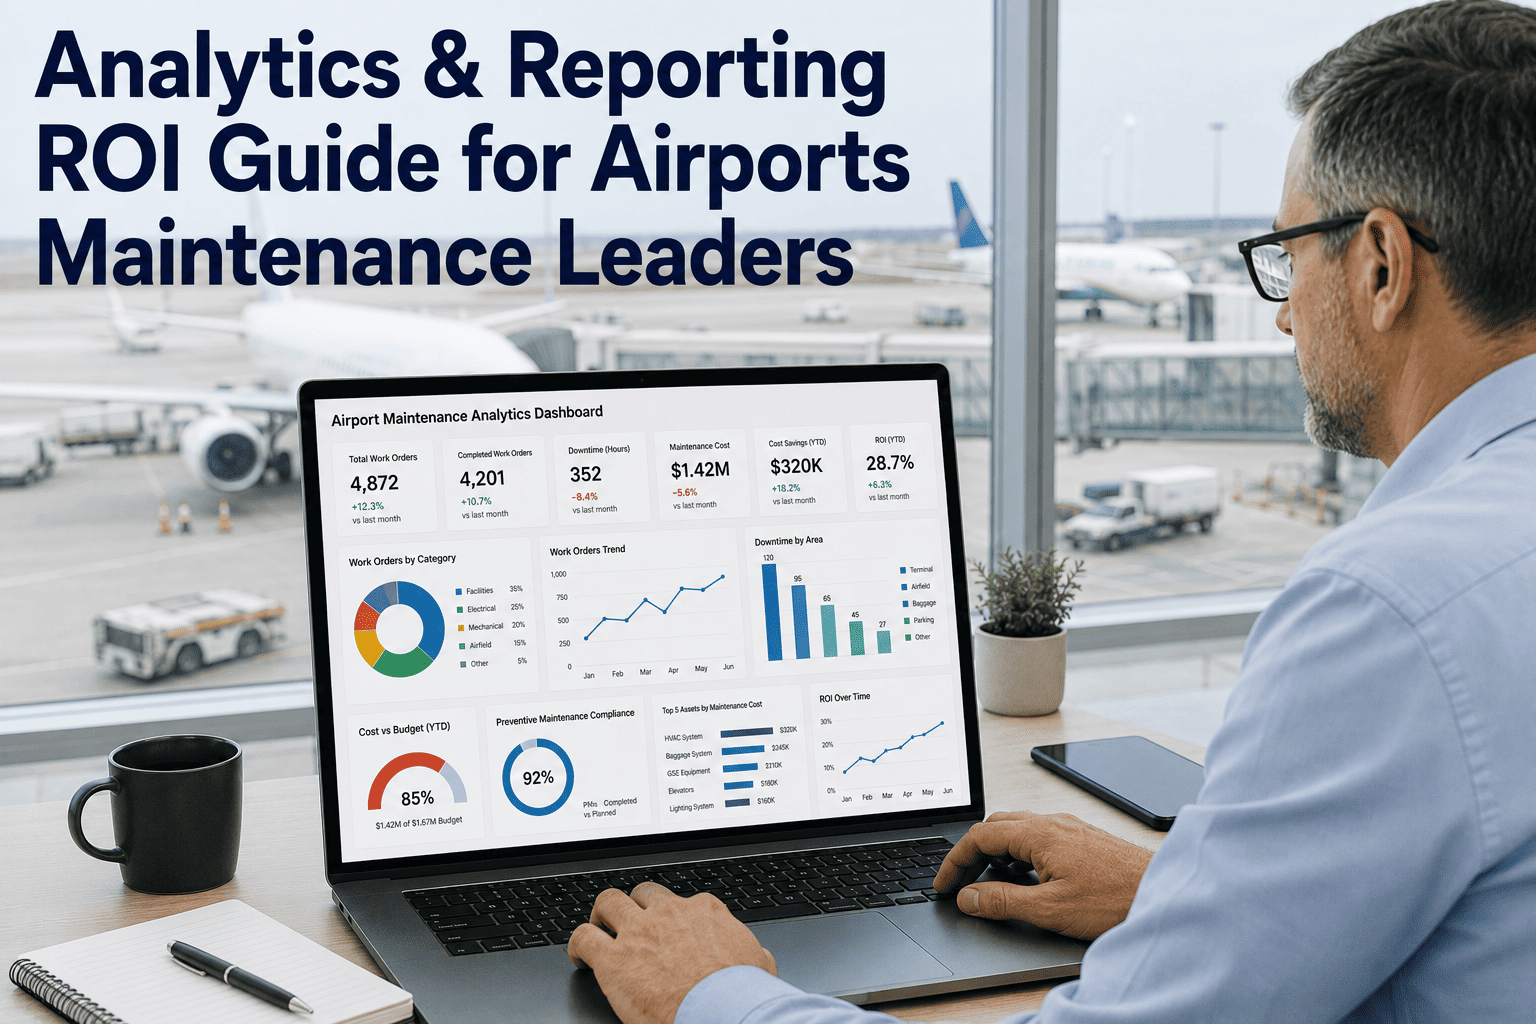
Analytics & Reporting ROI Guide for Airports Maintenance Leaders


When a baggage carousel stalls during a peak afternoon bank of departures, the airline ground crew restarts it, passengers board a little late, and everyone moves on — until the same carousel stalls again three weeks later, and then again the month after that, and nobody in the maintenance office can say for certain it is the same fault, because nobody ever connected the three work orders into one pattern. Multiply that blind spot across a baggage handling system, a runway lighting circuit, and a terminal chiller plant, and a maintenance team that looks busy on paper is actually flying blind on the metric that matters most: which asset is about to fail next, and which repeat fault is about to become a reportable safety incident instead of a routine repair. Nearly one in four U.S. flights experienced a delay or cancellation between mid-2024 and mid-2025, and industry estimates put the cost of a single minute of ground delay at $100 or more — a cost airports absorb every time a maintenance issue is caught reactively instead of flagged by a pattern someone was already tracking. Oxmaint's analytics & reporting module turns scattered work order history into the dashboards, trend reports, and FAA Part 139 audit logs an airport maintenance leader actually needs to walk into a budget meeting, or a safety review, with data instead of a guess. This guide breaks down where airport maintenance analytics pays for itself fastest, what a real reporting dashboard should track, and how the reporting layer turns repeat failures into decisions made before they escalate. Book a 30-minute walkthrough to see it built against your own terminal's asset mix.

Analytics & Reporting · ROI Guide · Airport Maintenance

Every Repeat Failure Was Visible in the Data. Nobody Was Looking at It Together.

Airport maintenance teams do not lack work order data. They lack a way to see it as a pattern instead of a pile of closed tickets.

1 in 4 US flights delayed or cancelled, mid-2024 to mid-2025
$100+/min estimated cost of a single minute of ground delay
4.8× cost of emergency repair vs the same repair planned

Where Airport Maintenance Time Actually Goes

Across facilities teams broadly, more than half of maintenance hours go toward reacting to failures rather than following a schedule — and airport maintenance, with its dense mix of safety-critical systems, is rarely the exception.


Scheduled / tracked maintenance — approx. 42%
Reactive / unplanned maintenance — approx. 58%

Four Systems Where the Pattern Hides in Plain Sight

Each of these asset categories generates work orders constantly. Without a reporting layer that connects them, the same fault can repeat for months before anyone notices it is, in fact, the same fault.

01
Baggage Handling Systems
Mishandled-bag recovery costs the industry an estimated $5 billion a year, and most of it traces back to delays rather than truly lost bags — exactly the kind of repeat, fixable fault a trend report would surface early.
02
Runway & Approach Lighting
A single failed approach light can force a runway downgrade or trigger a NOTAM. Lamp and circuit degradation usually shows a pattern across prior work orders weeks before the failure that grounds operations.
03
Terminal HVAC
Chiller and air-handler faults in a sprawling concourse rarely fail without warning signs in filter pressure, airflow, or temperature trend data spread across several earlier, seemingly unrelated tickets.
04
Ground Support Equipment
GPUs, belt loaders, and tugs generate dozens of small repair tickets a month. Individually each looks minor; reported together, the same unit failing repeatedly is the clearest early signal for fleet replacement planning.

What a Maintenance Analytics Dashboard Should Actually Track

A useful dashboard is not a list of every work order. It is four or five numbers a maintenance director can check before a Monday morning meeting and know exactly where to focus.

Mean Time to Repair Target: under 4 hrs
Tracked per asset category, not as one blended airport-wide average.
Mean Time Between Failures Target: trending up
A flattening trend on one asset is the earliest signal of fleet fatigue.
Reactive Work Order Ratio Target: under 40%
The single ratio that tells you whether the team leads or chases failures.
FAA Part 139 Inspection Completion Target: 100%
Anything under 100% is a finding waiting to be discovered by an inspector first.

Manual Spreadsheet Reporting vs Oxmaint Analytics & Reporting

The data already exists somewhere in your systems. The question is whether it takes an afternoon to find, or shows up automatically before anyone has to ask.

Reporting Task Manual Spreadsheets Oxmaint Analytics & Reporting
Monthly maintenance report Rebuilt by hand from multiple exports Auto-refreshed dashboard, no rebuild needed
FAA Part 139 audit log Compiled in the days before an inspector visit Always current, exportable on demand
Cross-asset trend visibility Each system reviewed in isolation Unified view across BHS, lighting, HVAC, GSE
Repeat-fault detection Noticed after the third or fourth occurrence Flagged automatically after the second occurrence
Budget justification to leadership Built from memory and estimates Backed by cost-per-asset-category history
From scattered tickets to one clear signal

See the Pattern Before It Becomes a Delay, or an Incident

Oxmaint's analytics & reporting module connects every work order, inspection, and asset history into dashboards your maintenance team and your airport authority board can both read.

Five Reports Every Airport Maintenance Leader Should Have on Demand

Not every number needs a live dashboard. Some only matter the day an auditor, an airline partner, or a board member asks for them — and that is exactly when they are hardest to produce by hand.

01
FAA Part 139 Self-Inspection Log
Pavement, markings, lighting, signage, and safety area inspections, timestamped and exportable the moment an inspector asks.
02
MTTR / MTBF Trend Report
How fast assets get repaired and how often they fail, broken out by category so degrading equipment stands out early.
03
Reactive vs Scheduled Work Ratio
The single number that tells a maintenance director whether the team is ahead of failures or constantly chasing them.
04
Cost-per-Asset-Category Report
Total spend split across BHS, lighting, HVAC, and GSE, so budget conversations use real numbers instead of estimates.
05
Safety & Repeat-Fault Pattern Report
Surfaces recurring fault codes on the same asset before a routine repair pattern becomes a reportable safety incident.

Before and After: What Changes When Data Becomes a Report

Before Analytics & Reporting
Reactive work orders run 55–60% of total volume
FAA audit prep takes two to three weeks of manual pulling
Safety patterns surface after the second or third repeat incident
Leadership reporting is rebuilt by hand every month
After Analytics & Reporting
Reactive work orders typically fall under 35% within two quarters
FAA audit prep becomes a same-day filtered export
Repeat faults are flagged after the first recurrence
Leadership dashboard refreshes automatically, no rebuild required

Expert Review

"

Airports get blamed for delays that weather or air traffic control actually caused, and they rarely get credit for the delays they quietly prevented. The maintenance variable is the one an airport authority can actually control, and it is also the one most boards have the least visibility into, because the data lives in a dozen disconnected work order logs instead of one report. I have sat in budget reviews where a director argued for a baggage system overhaul on a gut feeling, lost the argument, then watched the same system fail during a peak bank eighteen months later for exactly the reason he had predicted. Analytics does not replace maintenance judgment. It gives that judgment a number the board can act on, and it turns a repeat fault everyone half-remembers into a pattern someone can point to before it becomes the safety incident on next quarter's report.

Capt. Daniel Reyes (Ret.), CM
Former Director of Airport Maintenance Operations · 20 years in FAA Part 139 certificated airport facilities and safety compliance

Frequently Asked Questions

Q1 What's the real difference between a CMMS work order log and an analytics & reporting dashboard?
A work order log tells you what happened to one asset on one day. A reporting dashboard aggregates that history across every asset and surfaces the trend — a rising repair frequency, a worsening reactive ratio, a fault repeating on the same unit. Oxmaint's analytics & reporting module builds that trend view automatically from the work orders your team already closes.
Q2 Does this actually help with FAA Part 139 self-inspection compliance, or is it a separate system?
It runs on the same asset and inspection data your team already logs for pavement, markings, lighting, signage, and safety area checks, then turns it into an exportable, timestamped audit log ready for an inspector visit without a manual compilation scramble beforehand.
Q3 Can it pull from our existing baggage handling, BMS, and lighting control systems, or does it all need manual entry?
Oxmaint connects to existing sensor, SCADA, and building management data where it is available, and layers reporting on top of manually logged work orders where it is not. Book a demo to see it mapped against your specific systems.
Q4 How does analytics & reporting actually help reduce safety incidents, not just delays?
Most reportable safety incidents trace back to a fault that occurred before, often more than once, on the same asset. A reporting layer that flags repeat fault codes after the second occurrence, instead of the fourth, gives a maintenance team the chance to intervene while it is still a routine repair.
Q5 How long until our maintenance leadership team actually has a working dashboard?
Most teams have a functioning dashboard covering their highest-priority asset categories within two to three weeks of loading historical work order data and the current asset hierarchy. Start a free trial to see your own data populate the first reports.
Stop reporting on faith

Turn Every Closed Work Order Into Something the Board Can Act On

Oxmaint's analytics & reporting module connects your airport's maintenance history into dashboards, trend reports, and audit-ready compliance logs, so the next delay, or the next incident, is the one you saw coming.
Share This Story, Choose Your Platform!