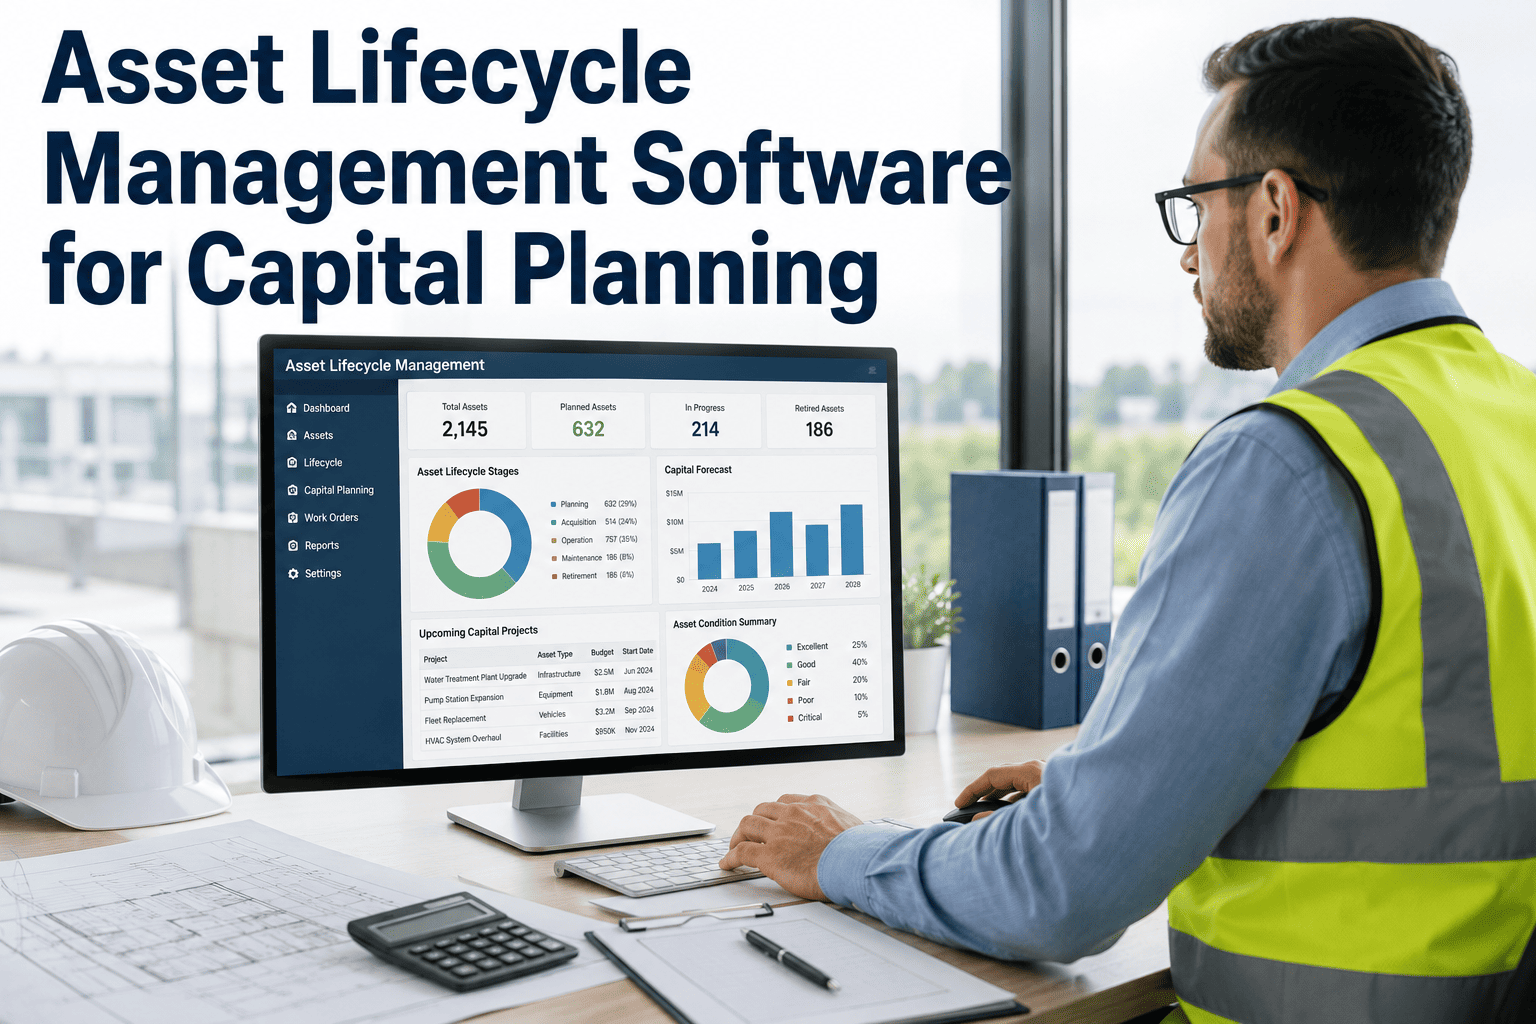
Every capital budget meeting has the same moment: someone asks whether to repair the old compressor again or approve a replacement, and the room falls back on gut feeling because nobody has the actual numbers. The purchase price of an asset only controls about 18% of its lifetime cost — the remaining 82% is decided by maintenance, energy, and downtime decisions made years after the invoice was paid. Sign in to OxMaint to see the true lifetime cost building up on every asset in your register right now. Book a demo to walk through a repair-vs-replace case built from your own maintenance history.
The Cost You See vs the Cost You Actually Pay
Purchase price is the visible tip. The far larger cost sits underneath, in years of maintenance, energy, and downtime that most budget spreadsheets never connect back to the asset.
Five Stages Every Asset Moves Through
Capital planning works best when each stage feeds cost data into the next one — instead of every asset being evaluated in isolation only when it breaks.
The 50% Rule Behind Every Repair-vs-Replace Call
When cumulative annual repair spend on an asset crosses half its current replacement value, continued repair investment starts delivering diminishing returns.
Age-Based Retirement vs Condition-Based Retirement
Most failure modes are driven by how an asset is treated, not simply how old it is — which is why age alone is an unreliable trigger for replacement.
| Dimension | Age-Based Retirement | Condition-Based Retirement |
|---|---|---|
| Trigger for replacement | Fixed number of years, regardless of condition | Actual repair cost trend and performance data |
| Risk of early replacement | Healthy assets retired prematurely, wasting capital | Capital released only when the data supports it |
| Risk of late replacement | Well-treated assets can run past the assigned age unnoticed | Rising repair-to-value ratio flags risk years in advance |
| Capital request defensibility | Based on a calendar assumption | Based on a documented cost and downtime history |
| Typical lead time before failure | Little to no advance warning | 12–18 months of visibility before projected failure |
Frequently Asked Questions — Asset Lifecycle Management for Capital Planning
A repair-vs-replace decision made on gut feeling is a coin flip with the CFO's budget. Made on lifecycle cost data, it becomes a documented case nobody has to debate.
Full acquisition-to-disposal cost tracking. Automatic 50% threshold alerts. Multi-year repair trend visibility. Capital request reports built from real history — not a spreadsheet rebuilt every budget season.






.png)