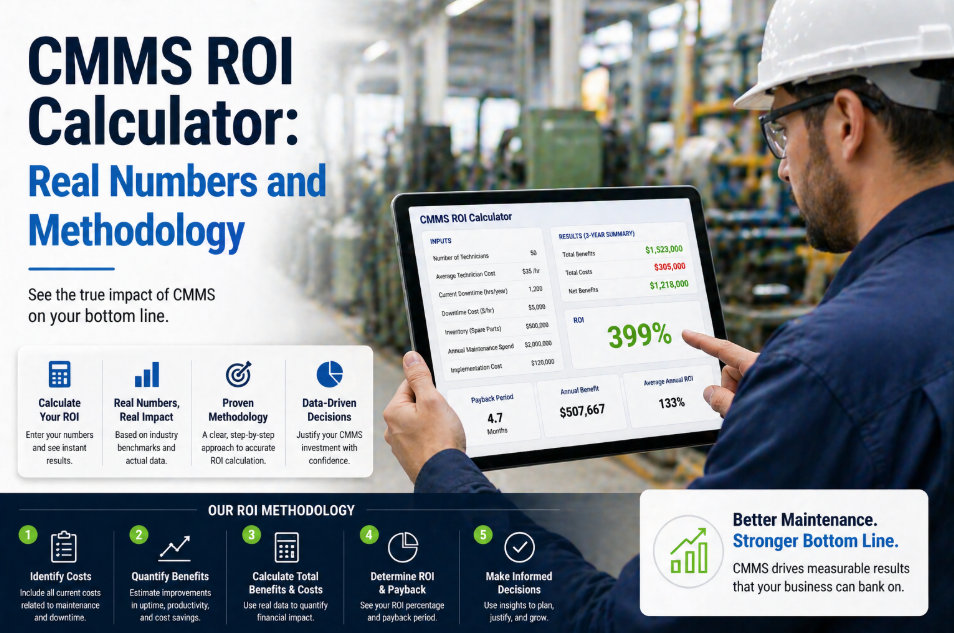
It is budget season. The maintenance manager at a 600-employee manufacturing plant has been asked — again — to justify the $45,000 annual cost of a CMMS platform. She knows the system has transformed her operation: unplanned downtime dropped 42%, spare parts inventory shrank by $180,000, and her team completes 85% of work orders on schedule instead of 35%. But when she sits down with the CFO, she struggles to translate these operational wins into the financial language the C-suite speaks — ROI percentage, payback period, net present value, cost avoidance vs. cost savings. The CFO sees a software subscription. The maintenance manager sees a production lifeline. The gap between them is not disagreement — it is a missing framework for quantifying maintenance value in financial terms. This scenario repeats at thousands of facilities every budget cycle — not because CMMS doesn't deliver value, but because maintenance teams lack the structured methodology to prove it. Talk to our team about building an airtight ROI case for your CMMS investment.
Maintenance Finance Guide — 2026 Edition
How to Calculate Maintenance ROI and Justify CMMS Investment
Master the financial formulas, benchmark data, and executive presentation framework to prove CMMS value — from payback period and NPV to cost avoidance quantification and board-ready business cases.
5:1
Average ROI ratio for CMMS implementations across manufacturing
14 Mo
Median payback period for properly implemented CMMS platforms
28%
Average maintenance cost reduction within first 24 months
$12.9
Saved for every $1 invested in preventive maintenance programs
Why Maintenance ROI Is So Hard to Prove
Maintenance delivers value primarily through prevention — and the financial language of most organizations is built to measure what happened, not what didn't happen. When a CMMS prevents a $200,000 kiln failure through predictive bearing monitoring, that event never appears on the income statement. The CFO sees only the software subscription cost. This asymmetry between visible costs and invisible savings is the fundamental challenge of maintenance ROI — and it's why the majority of CMMS business cases either fail to get funded or get funded with inadequate budget that undermines implementation success.
The Six ROI Quantification Barriers in Maintenance
Invisible Savings
$0
Prevented failures never appear in financial reports. A bearing replacement that averts a $200K breakdown shows up only as a $3K work order — the $197K in avoided cost is invisible without structured tracking.
No Baseline Data
Blind
Facilities without a CMMS lack the very data needed to calculate ROI — downtime hours, emergency repair costs, parts waste, and labor overtime aren't tracked systematically. You can't measure improvement from an unknown starting point.
Cost vs. Investment
Framing
Finance teams categorize maintenance software as an operating expense. Maintenance teams see it as a capital investment in production reliability. This framing mismatch derails budget conversations before ROI is even discussed.
Lagging Returns
6–18 Mo
CMMS ROI compounds over time — the biggest returns come in Year 2 and 3 as predictive capabilities mature. But budget decisions demand immediate payback projections that undervalue the long-term compounding effect.
Soft Benefits
Ignored
Safety improvements, regulatory compliance, employee morale, and knowledge retention are real CMMS benefits but resist dollar quantification. Business cases that rely on "soft" benefits get rejected by financially-rigorous CFOs.
Attribution Problem
Mixed
When downtime drops, was it the CMMS, the new technician, or the equipment upgrade? Isolating CMMS contribution from simultaneous improvements is methodologically difficult — and skeptics exploit the ambiguity.
The Maintenance ROI Calculation Framework
A rigorous CMMS ROI calculation requires a structured, multi-layer approach that separates hard savings, cost avoidance, and productivity gains — then presents each in the financial metrics that budget decision-makers actually use. The framework below provides the complete calculation methodology from baseline measurement through five-year NPV projection.
7-Stage Maintenance ROI Calculation Pipeline
From cost baseline through executive presentation
Document current total maintenance cost: labor, parts, contractors, downtime, overtime, and emergency repairs.
Foundation
›
Quantify the costs that don't appear on maintenance budgets: production losses, scrap, expedited shipping, safety incidents.
Discovery
›
Total cost of ownership: software licenses, implementation, training, data migration, and ongoing administration.
Year 1–5
›
Project hard savings (labor, parts, energy) and cost avoidance (prevented failures, compliance) using industry benchmarks.
Quantification
›
Calculate ROI %, payback period, NPV, and IRR using conservative, moderate, and aggressive savings scenarios.
Financial
›
Apply probability-weighted estimates and sensitivity analysis. Present the "worst case" that still justifies investment.
Validation
›
Package into a board-ready business case: executive summary, financial projections, risk analysis, and implementation timeline.
Presentation
Get Your Plant-Specific ROI Calculation
Oxmaint's team will build a customized ROI model using your facility's actual maintenance costs, downtime data, and workforce size — delivering a board-ready financial case within 48 hours of your initial consultation.
The Core ROI Formulas Every Maintenance Leader Needs
Finance teams evaluate investments using a specific set of metrics. Presenting your CMMS business case in these terms — not in maintenance jargon — is the single most important factor in getting funded. Below are the four financial formulas that translate maintenance improvement into capital allocation language, with worked examples based on a typical 500-employee manufacturing facility.
Four Financial Metrics for CMMS Justification
Formula: ROI = (Net Benefits – Total Investment) / Total Investment × 100
Net Annual Benefit: $285,000Annual CMMS Cost: $48,000Implementation: $25,000Year 1 ROI: 290%Target: >100%
ROI percentage is the most universally understood metric. Present three scenarios: conservative (150%), moderate (290%), aggressive (420%). CFOs respect the range — it shows analytical rigor, not salesmanship. Always lead with the conservative number.
Formula: Payback Period = Total Investment / Annual Net Savings (in months)
Total Year 1 Cost: $73,000Monthly Net Benefit: $23,750Payback: 3.1 MonthsIndustry Median: 14 MonthsMax Acceptable: 24 Months
Payback period answers the CFO's first question: "When do we get our money back?" For CMMS investments, payback under 18 months is typical. Under 12 months is compelling. Under 6 months makes the decision obvious. Include a month-by-month cash flow chart.
Formula: NPV = Σ (Net Cash Flow / (1 + r)^t) – Initial Investment | r = discount rate, t = year
5-Year Net Benefits: $1.42MDiscount Rate: 10%Present Value: $1.07MInvestment: $73KNPV: +$997K
Net Present Value accounts for the time value of money — a dollar saved next year is worth less than a dollar saved today. Positive NPV means the investment creates value. For CMMS, 5-year NPV is typically 10–20x the initial investment. Use your company's standard discount rate.
Formula: IRR = Discount rate at which NPV = 0 (solve iteratively)
Typical CMMS IRR: 150–400%Company Hurdle Rate: 15%CMMS Exceeds by 10x+Strongest for Capital CommitteesCompare to Other Projects
Internal Rate of Return lets the CFO compare your CMMS investment directly against every other project competing for capital. When your IRR is 200% and the company's hurdle rate is 15%, the investment decision becomes mathematically obvious. Always include IRR for capital committee presentations.
Where the Savings Come From: The 8 ROI Categories
CMMS ROI is not a single number — it's the aggregate of savings across eight distinct categories, each with different measurement methods, realization timelines, and confidence levels. Quantifying each category separately — and labeling them as "hard savings," "cost avoidance," or "productivity gains" — gives your business case the granularity that survives CFO scrutiny. Book a Demo to see how Oxmaint tracks ROI across all eight categories automatically.
8 CMMS ROI Categories with Industry Benchmarks
01
Downtime Reduction
Benchmark: 25–45% reduction in unplanned downtime
Formula: Hours saved × production value/hour
Type: Hard savings — directly measurable on P&L
02
Labor Efficiency
Benchmark: 20–30% increase in wrench time
Formula: Hours recovered × fully-loaded labor rate
Type: Productivity gain — more work with same headcount
03
Parts Inventory
Benchmark: 15–25% reduction in spare parts spend
Formula: Reduced carrying cost + eliminated stockouts
Type: Hard savings — visible in inventory accounts
04
Energy Savings
Benchmark: 5–15% energy reduction from optimized equipment
Formula: kWh saved × energy rate per kWh
Type: Hard savings — visible in utility bills
05
Equipment Life Extension
Benchmark: 15–25% extension of asset useful life
Formula: Deferred replacement cost / years extended
Type: Cost avoidance — CapEx deferral
06
Overtime Reduction
Benchmark: 30–50% reduction in emergency overtime
Formula: OT hours eliminated × OT premium rate
Type: Hard savings — visible in payroll
07
Compliance / Safety
Benchmark: 40–70% reduction in safety incidents
Formula: Avoided penalties + insurance premium reduction
Type: Cost avoidance — risk mitigation
08
Contractor Spend
Benchmark: 10–20% reduction in outside contractor use
Formula: Contractor hours replaced × rate differential
Type: Hard savings — visible in vendor invoices
Manual vs. CMMS-Driven ROI Tracking
The irony of maintenance ROI is that the very system you're trying to justify — the CMMS — is also the system that enables accurate ROI measurement. Manual tracking methods undercount savings, miss cost avoidance entirely, and cannot provide the real-time financial dashboards that sustain executive support beyond the initial purchase decision.
Build Your Board-Ready Business Case in 48 Hours
Oxmaint's implementation team will use your facility's actual cost data to build a customized ROI model with conservative, moderate, and aggressive scenarios — including payback period, NPV, and IRR calculations ready for your CFO's desk.
Building the CFO-Ready Business Case
The difference between a funded CMMS project and a rejected one is rarely the ROI numbers — it's the presentation framework. CFOs evaluate hundreds of investment proposals. The business cases that get funded follow a specific structure that addresses financial rigor, risk mitigation, and implementation credibility simultaneously. Here is the six-component framework that wins budget approval. Book a Demo to receive our executive business case template pre-populated with your plant data.
6-Component Executive Business Case Framework
01
Executive Summary
One-page overview: problem, solution, cost, ROI, payback
Lead with the conservative ROI scenario
State the "do nothing" cost explicitly
02
Current State Analysis
Documented maintenance cost baseline with sources
Downtime hours and production loss quantified
Comparison to industry benchmarks (show the gap)
03
Financial Projections
3-scenario model: conservative, moderate, aggressive
ROI %, payback period, NPV, and IRR for each
Month-by-month cash flow projection for Year 1
04
Risk Analysis
Sensitivity analysis: "What if savings are only 50%?"
Implementation risk mitigation plan
"Do nothing" risk: escalating costs, compliance exposure
05
Implementation Plan
Phased rollout timeline with resource requirements
Quick wins identified for Months 1–3
Success metrics and review milestones
06
Ongoing ROI Tracking
Monthly ROI dashboard commitment to leadership
Quarterly business review with actual vs. projected
Annual ROI report for budget renewal justification
Expert Perspective: Proving ROI at Scale
"
We manage maintenance across 11 manufacturing plants with a combined annual maintenance budget of $38 million. When we proposed CMMS implementation to the board, we didn't lead with features — we led with the cost of doing nothing. We calculated that reactive maintenance was costing us $6.2 million per year in preventable downtime, emergency overtime, and expedited parts. The CMMS investment was $420,000 for Year 1 including implementation. Even our conservative model showed a 4.8:1 return ratio. The board approved it in one meeting. Twenty-four months in, our actual results exceeded the aggressive scenario. Unplanned downtime dropped 38% across all sites. Parts inventory carrying costs fell by $1.1 million. Overtime was cut 44%. Our insurance carrier reduced our premiums by 12% based on the safety improvement data the CMMS produced. The total quantified benefit in Year 2 was $4.9 million against a recurring cost of $280,000. But the most important number was one we didn't have before: cost avoidance. The CMMS tracked 147 predictive maintenance interventions that prevented failures — and we could assign a dollar value to each one. That's the data that made the CFO a believer. He now cites our maintenance ROI as a benchmark for other departments.
— VP of Operations, Multi-Site Industrial Manufacturer
$4.9M
Year 2 quantified benefit across 11 plants
17:1
Year 2 return on recurring CMMS investment
147
Tracked predictive interventions with dollar values
Facilities that build structured, data-driven CMMS business cases don't just get funded — they get funded faster, with more budget, and with sustained executive support that ensures successful implementation. Every month spent debating the investment is another month of accumulating the preventable costs that the CMMS would eliminate. Start your free trial today and begin building the ROI data that makes your business case undeniable.
Prove Your Maintenance ROI — Definitively
Oxmaint CMMS provides the complete digital infrastructure to not only deliver maintenance ROI but to measure, track, and report it continuously — from downtime reduction and parts savings to cost avoidance logging and executive dashboard reporting. Build the business case that gets funded and the tracking system that proves it was right.
Frequently Asked Questions
What is a realistic ROI expectation for CMMS implementation?
Industry research consistently shows CMMS ROI ratios of 3:1 to 10:1 within the first three years, with a median of approximately 5:1. The variance depends on your starting point — facilities with highly reactive maintenance cultures (>50% emergency work orders) typically see the largest returns because they have the most waste to eliminate. A facility that is already running 70% planned maintenance will still see positive ROI, but the magnitude will be smaller. The key variables are: facility size (more assets = more savings), current downtime cost (higher-value production = greater downtime savings), and implementation quality (poor adoption kills ROI regardless of the software's capability). Conservative first-year targets should assume 60–70% of the full potential savings, as the system and team are still maturing.
How do I calculate the cost of downtime for my facility?
Downtime cost has four components that must be captured separately. Direct production loss: multiply your hourly production value (revenue per hour minus variable costs) by downtime hours — this is the biggest number and the one most CFOs focus on. Labor waste: maintenance technician and operator wages during unproductive downtime. Material waste: scrap, spoiled product, and restart material consumed. Consequential costs: expedited shipping to meet delayed orders, customer penalties, and overtime to recover lost production. For most manufacturing facilities, total downtime cost ranges from $5,000 to $50,000+ per hour depending on the production value. Oxmaint's ROI calculator can model your specific facility using your production rates, labor costs, and historical downtime data to produce an accurate hourly downtime cost figure for your business case.
How do I quantify cost avoidance vs. hard savings?
This distinction is critical because CFOs treat them differently. Hard savings are actual cost reductions that show up in the budget — lower parts spend, reduced overtime hours, fewer contractor invoices. These are directly verifiable from financial records and are the strongest component of any business case. Cost avoidance is the value of prevented negative events — a bearing replacement that prevents a $200K failure, a compliance inspection that avoids a $50K fine. Cost avoidance is real but requires documentation methodology: for each preventive intervention, record what was found, what would have happened without intervention (based on failure history or engineering judgment), and the estimated cost of the avoided failure. Oxmaint's CMMS logs each predictive maintenance intervention and allows maintenance managers to assign an estimated avoided cost — building a running cost avoidance register that converts invisible savings into documented value.
What should I include in total cost of CMMS ownership?
Honest TCO calculation includes every cost associated with the system over a 3–5 year horizon. Software costs: annual subscription or license fees — for cloud-based systems like Oxmaint, this is a predictable annual cost with no surprise infrastructure expenses. Implementation: data migration, system configuration, integration with existing systems (ERP, IoT sensors), and initial asset register setup. Training: initial training for all users plus ongoing training for new hires. Administration: internal time spent managing the system (typically 0.25–0.5 FTE for mid-size facilities). Change management: the often-overlooked cost of driving adoption — this may include dedicated project management time during the first 6 months. Do NOT include sunk costs or costs that would exist regardless of CMMS (like existing IT infrastructure). A complete TCO allows you to calculate an honest ROI that survives scrutiny — inflated ROI from understated costs destroys credibility when discovered.
How soon should we expect to see measurable ROI after implementation?
CMMS ROI follows a predictable maturity curve. Months 1–3 (Foundation): ROI is negative — you're investing in setup, data entry, and training. However, immediate wins are available: digitizing work orders reduces administrative time, and simply tracking downtime reveals previously invisible losses. Months 4–8 (Early Returns): Planned maintenance ratio improves, reducing emergency repairs. Parts inventory optimization begins. First cost avoidance events are documented. Most facilities cross the break-even point during this window. Months 9–18 (Acceleration): Predictive capabilities activate as data accumulates. Repeat failure patterns identified and eliminated. Work order costs drop measurably. This is where the majority of Year 1 ROI materializes. Year 2+ (Compounding): Full predictive maintenance capability, optimized asset lifecycle decisions, and mature cost avoidance tracking produce returns that typically exceed Year 1 by 40–60%. The CMMS becomes a competitive advantage, not just a compliance tool.