Condition-based maintenance reduces unplanned downtime by 70–85% compared to reactive operations and eliminates 25–35% of unnecessary preventive maintenance tasks triggered by calendar schedules regardless of actual equipment condition. In 2026, CBM has become financially accessible to operations of all sizes — wireless sensors cost $50–$200 per monitoring point, AI anomaly detection is built into modern CMMS platforms at no extra cost, and the first prevented breakdown typically pays back the entire sensor investment. Yet 73% of industrial facilities still rely on fixed-interval PM schedules that service equipment whether it needs it or not. This complete implementation guide covers CBM sensor types, threshold configuration, alert workflows, auto-generated work orders, ROI validation, and the 90-day deployment timeline that gets condition monitoring live on your most critical assets. If you are running calendar PM and ready to move to data-driven maintenance decisions, start a free trial with OxMaint or book a demo to see sensor-triggered work orders in action.
Condition-Based Maintenance Guide 2026
CBM Implementation
Condition-Based Maintenance Implementation Guide 2026
Complete CBM deployment guide — sensor selection, threshold automation, alert workflows, auto-generated work orders, and 90-day implementation timeline with documented ROI benchmarks.
70–85%
Downtime reduction with condition-based maintenance vs reactive baseline
25–35%
Reduction in unnecessary PM tasks — CBM services assets only when needed
$50–$200
Per wireless sensor monitoring point in 2026 — 80% cost reduction vs 2019
90 Days
Typical timeline from sensor install to measurable downtime reduction
Sensor-Triggered Work Orders with Threshold Automation
OxMaint connects vibration, temperature, pressure, and acoustic sensors directly to your CMMS. When sensor data crosses degradation thresholds, the system auto-generates prioritized work orders with full condition context. No manual alert monitoring required. Free for 30 days.
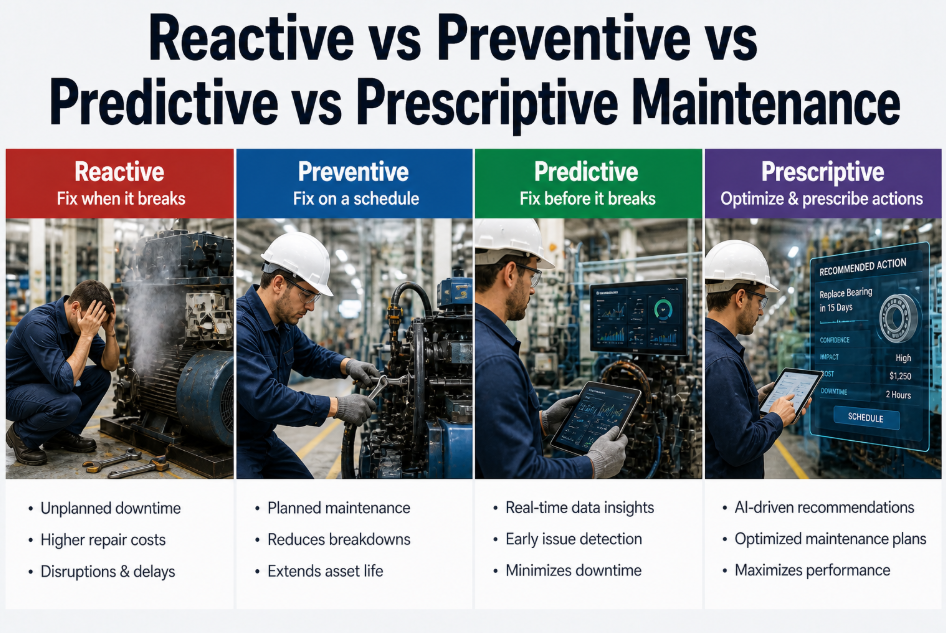
What Is Condition-Based Maintenance — Core Definition
Condition-based maintenance triggers maintenance interventions based on real-time equipment condition measured by sensors — not calendar dates or runtime hours. A motor is serviced when vibration data indicates bearing degradation, not because 3 months have passed. A compressor receives attention when discharge temperature exceeds baseline patterns, not because it hit 2,000 operating hours. The shift from time-based to condition-based eliminates two costly failure modes: over-maintenance (servicing healthy equipment unnecessarily) and under-maintenance (missing failures that happen between scheduled PM intervals). For operations teams evaluating whether CBM fits their assets and budget, start a free trial to test sensor integration with your existing equipment, or book a demo for a guided CBM feasibility assessment.
Condition-Based Maintenance (CBM)
Maintenance strategy where interventions are triggered by measured changes in equipment condition — vibration, temperature, pressure, acoustic emissions, electrical current, oil analysis, or other sensor data — rather than fixed time intervals or usage metrics.
Trigger Mechanism
Sensor data crossing threshold or AI-detected anomaly
Decision Basis
Actual measured equipment condition in real time
Primary Technologies
Vibration analysis, thermography, ultrasonic monitoring, oil analysis, motor current signature analysis
Typical Lead Time
2–12 weeks advance warning before failure
Failure Detection Rate
85–91% of failures caught before occurrence
Over-Maintenance Rate
Under 5% — services only when condition warrants
The Six CBM Sensor Technologies — What Each Detects
Condition-based maintenance is not one technology — it is six sensor types, each optimized for different failure modes. Selecting the right sensor for each asset depends on the failure mechanism you are trying to detect. This breakdown shows which sensor catches which failure type and the typical cost per monitoring point.
Detects:
Bearing wear, misalignment, imbalance, looseness, gear tooth wear, belt defects, shaft eccentricity
Common Assets:
Motors, pumps, fans, compressors, gearboxes, conveyors, spindles
Lead Time:
4–12 weeks advance warning
Detection Accuracy: 88–92%
Detects:
Electrical connection degradation, motor winding failure, bearing overheating, thermal runaway, insulation breakdown, cooling system failure
Common Assets:
Electrical panels, motor windings, bearings, transformers, circuit breakers, HVAC systems
Lead Time:
2–8 weeks advance warning
Detection Accuracy: 82–89%
Detects:
Pump cavitation, seal leakage, filter clogging, valve degradation, piping blockage, compressor inefficiency
Common Assets:
Pumps, compressors, hydraulic systems, pneumatic systems, process piping, filtration systems
Lead Time:
1–6 weeks advance warning
Detection Accuracy: 80–87%
Detects:
Air leaks, steam leaks, valve leakage, bearing lubrication failure, electrical arcing, compressed gas leaks
Common Assets:
Compressed air systems, steam systems, valves, bearings, electrical switchgear, pneumatic lines
Lead Time:
1–4 weeks advance warning
Detection Accuracy: 78–85%
Detects:
Rotor bar defects, stator winding faults, air gap eccentricity, load variations, power quality issues, phase imbalance
Common Assets:
3-phase motors, VFD-driven motors, pump motors, fan motors, compressor motors
Lead Time:
3–10 weeks advance warning
Detection Accuracy: 84–90%
Detects:
Bearing wear particles, contamination, viscosity breakdown, additive depletion, water ingress, oxidation, fuel dilution
Common Assets:
Gearboxes, hydraulic systems, diesel engines, turbines, transformers, large compressors
Lead Time:
4–16 weeks advance warning
Detection Accuracy: 75–88%
Threshold Configuration — The Three Alert Methods
Condition-based maintenance systems use three methods to determine when sensor data indicates a problem requiring intervention. Understanding which method fits which asset type prevents both false positives (unnecessary alerts) and missed failures (thresholds set too wide). Most mature CBM programs use all three methods across different asset classes.
Method 1
Absolute Threshold Alerts
Alarm triggers when sensor reading crosses a fixed value — temperature above 85°C, vibration above 0.5 in/sec, pressure below 40 PSI. Simple to configure, works well for assets with consistent operating conditions.
Best For:
Critical safety limits (temperature, pressure), equipment with narrow operating windows, compliance-driven monitoring (refrigeration, HVAC, compressed air)
Easy to configure — single threshold value
Immediate alerting — no learning period required
Clear pass/fail criteria for compliance reporting
High false positive rate if operating conditions vary
Requires manual threshold tuning per asset
Method 2
Baseline Deviation Alerts
System learns normal operating range over 2–4 weeks. Alarm triggers when sensor reading deviates X% from learned baseline — typically 15–25% deviation threshold. Adapts to load variations and seasonal changes.
Best For:
Assets with variable loads (production equipment, HVAC systems), seasonal operations, equipment where "normal" varies by operating mode
Self-tuning — adapts to actual operating patterns
Lower false positive rate vs absolute thresholds
Detects gradual degradation trends
Requires 2–4 week learning period before alerting
Baseline can drift if degradation is gradual
Method 3
AI Anomaly Detection
Machine learning models analyze multi-sensor patterns — vibration + temperature + current draw — to detect anomalies that single-parameter thresholds miss. Identifies failure modes the system has never seen before.
Best For:
Complex rotating equipment, multi-component systems, high-value assets where missed failures are catastrophic, assets with unpredictable failure modes
Highest detection accuracy — 85–91%
Detects novel failure patterns
Multi-parameter correlation catches complex faults
Requires quality training data (30+ days)
More complex to explain to non-technical stakeholders
The CBM Workflow — From Sensor Alert to Work Order Completion
Effective condition-based maintenance is not just sensor monitoring — it is the complete workflow from data collection through alert generation, work order creation, technician assignment, intervention execution, and outcome tracking. This workflow shows how OxMaint automates every step from sensor threshold breach to closed work order with documented outcomes.
Step 1
Continuous Sensor Data Collection
Wireless sensors transmit vibration, temperature, pressure, and acoustic data to OxMaint platform via Modbus, MQTT, or OPC-UA protocols. Data streams continuously — no batch uploads or manual logging.
Frequency: Every 15–60 seconds per sensor depending on criticality
Step 2
Real-Time Threshold Monitoring
Platform compares live sensor data against configured thresholds (absolute, baseline deviation, or AI anomaly detection). Statistical analysis identifies degradation patterns invisible to manual inspection.
Processing: Real-time — alerts generated within 60 seconds of threshold breach
Step 3
Severity-Scored Alert Generation
When threshold is crossed, system generates severity-scored alert: Low (monitor), Medium (schedule intervention within 7 days), High (schedule within 48 hours), Critical (immediate action required). Severity based on threshold margin and degradation rate.
Alert Routing: High and Critical alerts trigger immediate notifications; Low and Medium queue for review
Step 4
Auto-Generated Work Order Creation
OxMaint auto-generates work order with asset context, sensor data trend, probable failure mode, recommended action, and required parts. No manual work order entry by planner or supervisor.
Work Order Priority: Inherits alert severity — Critical alerts create emergency work orders
Step 5
Technician Assignment and Scheduling
Work order assigned to technician with required skills. For non-critical alerts, intervention scheduled at optimal production window. Critical alerts bypass scheduling — immediate technician dispatch.
Assignment Logic: Skills-based + availability + workload balancing
Step 6
Intervention Execution and Documentation
Technician receives mobile work order with full sensor context, completes intervention, documents findings (bearing replaced, coupling misalignment corrected, etc.), attaches photos, logs parts used, and closes work order.
Mobile Interface: Technicians never touch desktop — full workflow on phone/tablet
Step 7
Post-Intervention Validation
After intervention, platform monitors sensor data for 48–72 hours to validate that condition returned to baseline. Failed interventions (sensor still showing anomaly) trigger follow-up alerts.
Validation Window: 72 hours post-completion for rotating equipment, 48 hours for electrical/thermal
Step 8
AI Model Feedback and Learning
Technician findings feed back into AI model — if alert was accurate, model reinforces that pattern; if false positive, model adjusts thresholds. Detection accuracy improves with every completed work order.
Learning Loop: Continuous — model updates nightly based on prior day's outcomes
90-Day CBM Implementation Timeline
This timeline represents the proven deployment path for condition-based maintenance on 15–25 critical assets in a manufacturing, facilities, or industrial operation. Each phase delivers measurable value before the next investment — avoiding the common failure mode of attempting full-scale digital transformation with no baseline data. Teams ready to start this implementation can follow the guided workflow built into OxMaint — start a free trial to access phase-by-phase checklists, or book a demo to map this timeline to your specific facility.
Score all assets on criticality matrix (downtime cost × failure frequency)
Select 15–25 highest-criticality assets for CBM pilot
Identify failure modes per asset and required sensor types
Calculate CBM ROI for pilot asset set
Procure wireless sensors (2–3 week lead time — order immediately)
Deliverable: 20-asset CBM deployment plan with sensor list and documented $150K+ annual downtime savings target
Install wireless sensors on pilot assets (vibration, temp, pressure)
Connect sensor data streams to OxMaint via Modbus/MQTT/OPC-UA
Validate data flow — confirm sensor readings appearing in platform
Configure asset registry with sensor mapping and baseline metadata
Train 2–3 technicians on CBM alert response workflow
Deliverable: All sensors installed, data streaming to CMMS, zero alerts active (learning mode only)
AI models learn normal operating baselines for each asset (30-day minimum)
Configure threshold alerts: absolute limits for safety-critical parameters
Enable baseline deviation alerts (15–25% from learned normal)
Activate AI anomaly detection for rotating equipment
Test alert workflow with simulated threshold breach
Deliverable: Baselines learned, thresholds configured, alert system ready for live operation
Enable live alerts — auto-generated work orders from sensor thresholds
Track alert accuracy: true positives vs false positives
Measure prevented failures and downtime reduction vs baseline
Adjust thresholds based on first 30 days of live alert data
Calculate actual ROI and build business case for scale-up to additional assets
Deliverable: 85%+ alert accuracy, measurable downtime reduction, validated ROI, expansion plan approved
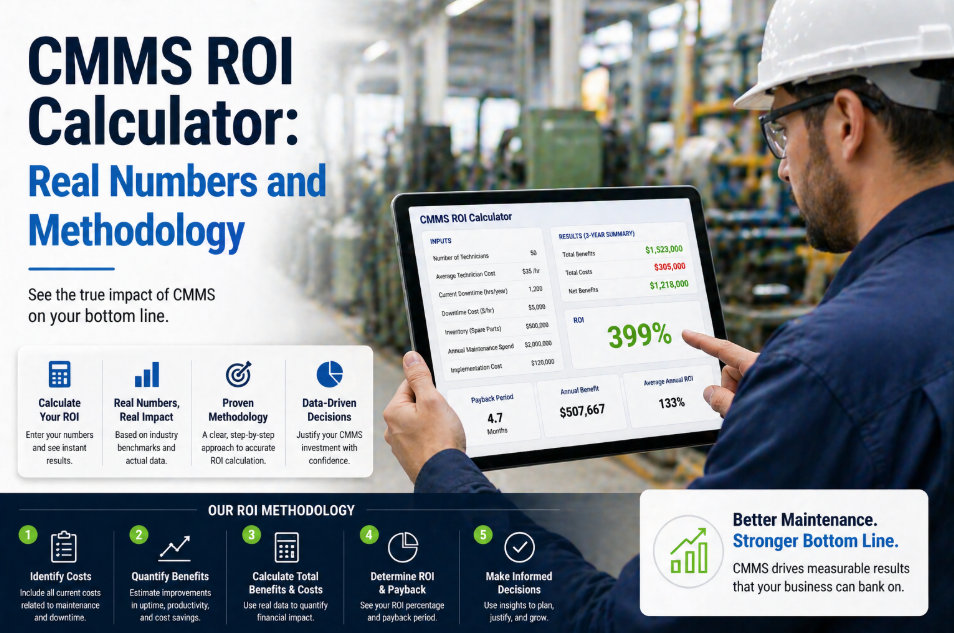
CBM ROI — Real Cost and Savings Benchmarks
This ROI model uses a 50-asset manufacturing facility deploying CBM on the 20 highest-criticality assets. Cost and savings data represent 2024–2026 benchmarks from SMRP, Plant Engineering, and Deloitte manufacturing analytics. Numbers are conservative — many operations achieve 40–60% higher savings than shown here.
CBM Implementation Cost — First Year
CMMS platform (20 users × $8/month)$1,920
Wireless sensors (20 assets × 2 sensors × $120 avg)$4,800
Sensor installation labor (20 assets × 2 hours × $75/hr)$3,000
Platform configuration and training (40 hours × $85/hr)$3,400
Total First-Year Implementation Cost$13,120
Annual Operating Savings — Recurring
Downtime reduction (9 prevented failures × 4.2 hours × $8,500/hr)$321,300
Eliminated over-maintenance (25% reduction in unnecessary PM)$28,000
Parts cost reduction (condition-based ordering vs emergency rush)$18,000
Asset life extension (deferred CapEx on monitored assets)$42,000
Total Annual Savings$409,300
Annual Operating Cost — Recurring
CMMS platform subscription$1,920
Sensor battery replacement (10% of sensors annually × $25)$100
Alert review and threshold tuning (2 hours/month × $85/hr)$2,040
Total Annual Operating Cost$4,060
31x
First-Year ROI
Total savings ($409K) divided by total cost ($13K) — payback in 11 days
$405K
Net Annual Benefit
Annual savings minus annual operating cost — pure operational value
11 Days
Payback Period
First prevented failure ($38K downtime) covers 290% of implementation cost
$1.21M
3-Year Cumulative Savings
Compounding value as detection accuracy improves and additional assets migrate to CBM
How OxMaint Delivers Sensor-Triggered Work Orders
OxMaint is not a bolt-on analytics dashboard — it is a unified CMMS with IoT sensor integration, AI anomaly detection, and auto-generated work orders built into the core platform. When a sensor crosses a threshold, the system does not send an email to a shared inbox. It creates a prioritized work order, assigns the right technician, attaches the sensor context, and schedules the intervention at the optimal time.
S
Multi-Protocol Sensor Integration
Connect wireless vibration, temperature, pressure, and acoustic sensors via Modbus TCP/RTU, MQTT, OPC-UA, or REST API. No middleware required — native protocol support built into platform.
T
Three-Tier Threshold Configuration
Configure absolute thresholds, baseline deviation alerts (auto-learned), and AI anomaly detection on the same asset. Use the right alert method for each failure mode.
A
AI Baseline Learning Engine
Machine learning models learn normal operating patterns over 2–4 weeks. Baseline adapts to load variations, seasonal changes, and production schedule shifts — no manual threshold tuning required.
W
Auto-Generated Work Orders
Threshold breach auto-creates work order with asset context, sensor trend data, probable failure mode, recommended action, required parts, and severity-based priority. Zero manual work order entry.
M
Mobile CBM Alert Interface
Technicians receive condition-triggered work orders on mobile with full sensor context — vibration trend graphs, temperature history, threshold margins. Complete intervention and document findings without touching desktop.
V
Post-Intervention Validation
After work order closure, platform monitors sensor data for 48–72 hours to validate condition returned to baseline. Failed interventions trigger automatic follow-up alerts and escalation workflows.
Frequently Asked Questions
What percentage of our assets should have condition-based monitoring?+
Industry benchmark: 15–25% of total asset count on CBM, representing 60–80% of total downtime risk. Use asset criticality scoring (downtime cost × failure frequency) to identify the top 20% of assets — these are your CBM candidates. A 100-asset facility typically monitors 18–25 highest-criticality assets with sensors, maintains calendar PM on the remaining 75–82 assets, and allows 5–10 low-criticality assets to run to failure by design. Most facilities achieve 70%+ of total downtime reduction by monitoring just their top 20% most-critical equipment. Want to score your assets and identify CBM candidates —
start a free trial and use OxMaint's built-in criticality calculator.
How accurate is condition-based maintenance — what is the false positive rate?+
Industry-validated detection accuracy: 85–91% of actual failures caught with 2–12 weeks advance warning. False positive rate: 3–8% after 30 days of baseline learning. Early alerts (first 2–4 weeks of operation) show 12–18% false positives as the AI model learns normal operating variation. False positive rate drops below 4% by day 60 for most equipment types. OxMaint's machine learning models improve continuously — technician feedback (marking alerts as true positive or false positive) tunes the model. By day 90, well-trained systems achieve under 3% false positive rate on rotating equipment and under 5% on thermal monitoring.
Can we run condition-based monitoring alongside existing preventive maintenance schedules?+
Yes — and this is the recommended deployment approach. CBM does not replace calendar PM — it layers on top for critical failure modes while PM continues for routine servicing. Example: A production motor might have quarterly lubrication PM (calendar-triggered) plus continuous vibration monitoring (condition-triggered for bearing wear). The calendar PM handles routine maintenance; the vibration sensor catches bearing degradation between PM intervals. OxMaint manages both trigger types on the same asset — technicians see unified work order queue combining calendar PM and sensor alerts. Over 6–12 months, teams progressively shift critical assets from time-based to condition-based as confidence in sensor accuracy builds.
What is the typical payback period for condition-based maintenance sensor investment?+
Industry average: 4–8 months for high-criticality assets with $5,000+ hourly downtime cost. Single prevented failure often pays back entire sensor deployment. Example calculation: $6,000 total sensor investment on 20 critical assets. First prevented breakdown (4.2 hours downtime at $8,500/hour = $35,700 avoided cost) covers 595% of sensor investment. Industry data shows facilities prevent 7–12 failures in first 12 months of CBM operation — compounding ROI to 680%+ by year three. For assets with under $2,000 downtime cost per event, payback extends to 18–30 months — often making calendar PM the better financial choice. Ready to calculate payback for your specific assets —
book a demo and we will run the ROI model with your actual facility data.
Sensor-Triggered Work Orders — OxMaint CBM Platform
Move Beyond Calendar PM. Service Assets When Condition Warrants.
OxMaint connects vibration, temperature, pressure, and acoustic sensors to auto-generated work orders. When sensor data crosses thresholds, the system creates prioritized interventions with full condition context — no manual alert monitoring, no spreadsheet tracking. Deploy on your 20 most critical assets in 90 days. Free for 30 days.
85–91%
Failure detection accuracy
90 Days
Implementation timeline
$8/mo
Per user — sensors included