Manufacturing facilities still operating on reactive maintenance spend 4.8 times more per repair event than operations running preventive programs — and 9.3 times more than facilities using predictive analytics. In 2026, the gap is widening. Plants with AI-driven prescriptive maintenance are reporting 62% fewer unplanned stops, 40% lower total maintenance costs, and asset lifespans extended by 35%. Yet 58% of industrial operations still run primarily reactive programs — fixing equipment only after it breaks. This guide compares all four maintenance strategies with real cost data, documented ROI benchmarks, and the specific migration path from reactive firefighting to AI-powered prevention. If your facility is still losing production hours to surprise breakdowns, start a free trial with OxMaint or book a demo to see how one platform supports all four strategies in a single workflow.
Maintenance Strategy Comparison 2026
Implementation Guide
Reactive vs Preventive vs Predictive vs Prescriptive Maintenance — Complete Strategy Guide
The full comparison: cost multipliers, ROI benchmarks, when to use each strategy, and the proven migration path from reactive to prescriptive — with real industry data from 2024–2026.
4.8x
Cost multiplier — reactive repairs vs planned preventive maintenance
62%
Reduction in unplanned downtime with prescriptive AI maintenance
58%
Of industrial facilities still operating primarily reactive programs
85%
Failure prediction accuracy with AI predictive maintenance systems
One Platform — All Four Maintenance Strategies
OxMaint supports reactive work orders, preventive scheduling, predictive analytics, and AI prescriptive recommendations in one unified workflow. Start with calendar PM, migrate to condition-based monitoring as your program matures. Free for 30 days.
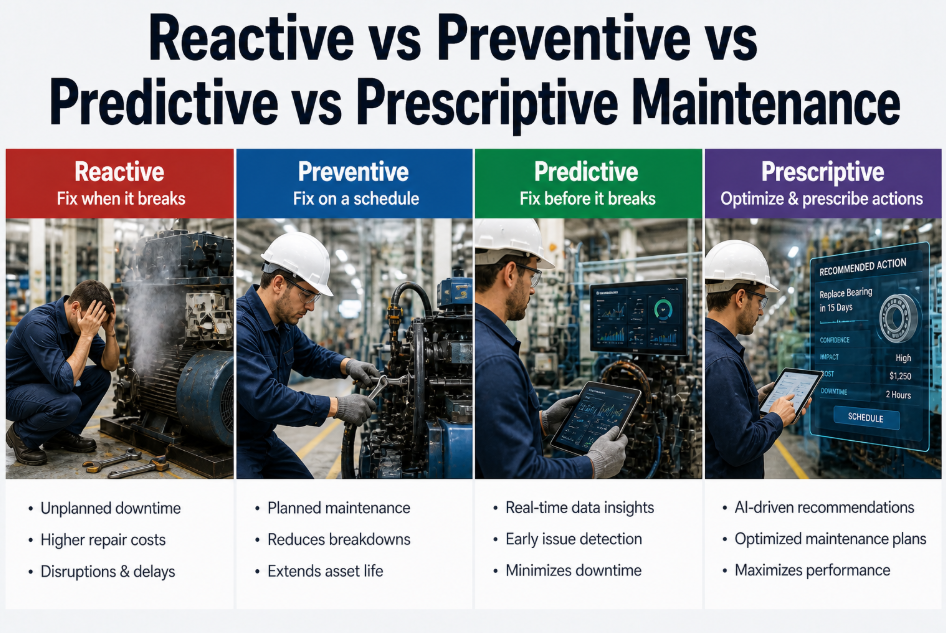
The Four Maintenance Strategies — Core Definitions
Every maintenance program falls somewhere on the maturity spectrum from reactive firefighting to AI-driven optimization. Understanding where your operation sits today — and where the financial opportunity lies in moving up the ladder — is the first step toward building a business case for change. These definitions are not theoretical classifications — they are operational realities with measurable cost differences. Teams ready to benchmark their current state against industry standards can start a free trial to see where their facility lands on the maturity model, or book a demo for a guided assessment.
Strategy 1
Reactive Maintenance
Also Called: Run-to-Failure, Breakdown Maintenance, Firefighting
Equipment is operated until it fails. No scheduled maintenance. Repairs happen only after breakdowns occur. Work orders are emergency-driven. Parts are expedited. Labor is overtime.
Still used by 58% of industrial facilities as their primary maintenance approach
Strategy 2
Preventive Maintenance
Also Called: Time-Based Maintenance, Calendar PM, Scheduled Maintenance
Assets are serviced on fixed schedules — daily, weekly, monthly, annually — regardless of actual condition. Oil changes, filter replacements, inspections happen at predetermined intervals based on manufacturer recommendations or historical patterns.
Reduces unplanned downtime by 40–55% compared to purely reactive operations
Strategy 3
Predictive Maintenance
Also Called: Condition-Based Maintenance, PdM, Sensor-Driven Maintenance
Real-time sensor data — vibration, temperature, pressure, acoustic emissions — is analyzed to detect early-stage degradation. Maintenance is triggered by actual equipment condition, not calendar dates. AI models predict when failures will occur.
Catches 85–91% of failures before they happen — compared to 30% for calendar PM alone
Strategy 4
Prescriptive Maintenance
Also Called: AI-Driven Maintenance, Autonomous Maintenance Optimization
AI not only predicts when equipment will fail — it prescribes the optimal intervention timing, the specific repair action needed, the required parts, and the least-disruptive maintenance window. The system auto-generates prioritized work orders with technician assignments.
Delivers 62% fewer unplanned stops and 40% lower total maintenance costs vs reactive baseline
Cost Comparison — What Each Strategy Actually Costs
The cost difference between maintenance strategies is not incremental — it is exponential. Reactive maintenance costs 4.8x more per event than planned preventive work, and the gap widens when you factor in production loss, quality defects from rushed restarts, and secondary equipment damage from cascading failures. This comparison uses validated 2024–2026 benchmark data from SMRP, Plant Engineering, and Deloitte maintenance analytics.
Average cost per repair event$8,500–$22,000
Labor rate multiplier (overtime/emergency)1.5x–2.5x standard rate
Parts expediting premium$800+ per rush order
Annual downtime (unplanned)3–5% of operating hours
Asset life vs. baseline60–75% of rated life
Total maintenance cost as % of RAV4.5–7%
Average cost per planned PM event$1,800–$4,500
Labor rate (standard shift)1.0x base rate
Parts procurement (planned ordering)Standard shipping — no premium
Annual downtime (unplanned)1.5–2.5% of operating hours
Asset life vs. baseline90–110% of rated life
Total maintenance cost as % of RAV2.5–3.5%
Average cost per intervention$900–$2,800
Labor rate (planned, optimal timing)1.0x base rate
Parts procurement (2–6 week lead time)Bulk ordering — volume discounts
Annual downtime (unplanned)0.8–1.5% of operating hours
Asset life vs. baseline115–135% of rated life
Total maintenance cost as % of RAV1.8–2.8%
Average cost per AI-scheduled intervention$800–$2,400
Labor rate (AI-optimized scheduling)1.0x base — zero overtime
Parts procurement (predictive ordering)Auto-ordered at optimal timing
Annual downtime (unplanned)0.5–1.2% of operating hours
Asset life vs. baseline125–145% of rated life
Total maintenance cost as % of RAV1.5–2.2%
When to Use Each Strategy — Decision Framework
Not every asset deserves predictive monitoring. Not every failure mode justifies AI analytics. The financially optimal maintenance program uses all four strategies — deployed strategically based on asset criticality, failure consequence, and monitoring cost. This is the decision framework used by operations teams running mature, cost-effective maintenance programs.
Reactive
Best For Low-Criticality, Low-Cost Assets
Use Reactive Maintenance When:
Asset replacement cost under $500
Failure does not stop production
No safety or compliance risk
Parts readily available (same-day delivery)
Repair time under 30 minutes
Redundancy available (backup systems online)
Common Examples:
Light bulbs, small hand tools, non-critical office equipment, low-voltage switches, cosmetic enclosures
Preventive
Best For Moderate-Criticality, Predictable-Failure Assets
Use Preventive Maintenance When:
Asset has known wear patterns
Manufacturer specifies service intervals
Failure risk increases predictably with runtime
Sensor monitoring cost exceeds PM labor cost
Compliance requires documented servicing
Asset criticality: medium (downtime tolerable)
Common Examples:
HVAC filters, lubricant changes, belt replacements, battery testing, fire extinguisher inspections, small motor PM
Predictive
Best For High-Criticality, High-Value Production Assets
Use Predictive Maintenance When:
Downtime cost exceeds $5,000/hour
Asset replacement value over $50,000
Failure modes detectable by sensors
Lead time for repairs: 2+ weeks
Calendar PM triggers unnecessary interventions
Safety-critical or production-critical equipment
Common Examples:
Production line motors, compressors, pumps, chillers, CNC machines, robotic systems, critical HVAC units
Prescriptive
Best For Mission-Critical, Complex Multi-Asset Systems
Use Prescriptive Maintenance When:
Multiple assets in dependent chain
Downtime cost exceeds $20,000/hour
Production schedules vary weekly
Maintenance windows limited (24/7 operations)
Over 50 monitored assets on site
Labor scheduling complexity high
Common Examples:
Automotive assembly lines, pharmaceutical batch systems, data center infrastructure, oil refinery units, power generation plants
The Maturity Migration Path — Reactive to Prescriptive in 18 Months
You do not migrate from reactive to prescriptive overnight. The proven path is four phases over 12–18 months — each phase delivering measurable ROI before the next investment. This is the roadmap operations teams use to build internal buy-in, demonstrate value at each stage, and avoid the common failure mode of attempting a full-scale digital transformation with no baseline PM program in place. Teams starting this journey can see the platform that supports every stage — start a free trial to begin Phase 1 today, or book a demo to map the timeline to your specific operation.
Goal: Reduce emergency repairs by 40% through calendar-based PM scheduling
Key Actions:
Build asset registry — all equipment over $5K
Schedule manufacturer-recommended PMs
Deploy mobile CMMS for technician work orders
Track reactive vs planned work order ratio
Typical Result: 45% reduction in emergency repairs, 30% lower total maintenance cost, payback in 60 days
Goal: Eliminate unnecessary PMs, optimize intervals using failure history data
Key Actions:
Analyze PM completion data vs failure events
Identify over-maintained assets (PM with zero failures)
Extend intervals on low-risk equipment
Add runtime-based triggers (hours, cycles, units)
Typical Result: 25% reduction in total PM labor hours while maintaining 40% fewer breakdowns vs reactive baseline
Goal: Deploy condition-based monitoring on 10–20 highest-criticality assets
Key Actions:
Install vibration/temperature sensors on critical motors
Connect sensor data to CMMS platform
Enable AI anomaly detection on pilot assets
Auto-generate work orders from sensor alerts
Typical Result: 85% failure prediction accuracy on monitored assets, 50% further reduction in unplanned downtime
Goal: AI-optimized maintenance scheduling across full asset base
Key Actions:
Expand sensor coverage to 50+ critical assets
Enable AI scheduling engine (timing optimization)
Integrate with production calendars
Auto-assign work orders based on technician skill + availability
Typical Result: 62% total downtime reduction vs reactive baseline, 40% lower total maintenance cost, 3-year ROI of 680%
ROI Benchmarks Across All Four Strategies
These benchmarks represent documented 3-year financial outcomes across 200+ industrial and commercial operations tracked by SMRP, Deloitte, and McKinsey from 2023–2026. Use these numbers to build your business case for migrating from your current strategy to the next maturity level.
Reactive Baseline
4.5–7%
Maintenance Cost % RAV
Baseline cost structure — all other strategies measured against this
Preventive
2.5–3.5%
Maintenance Cost % RAV
Savings driven by 45% fewer emergency repairs and 25% longer asset life
Predictive
1.8–2.8%
Maintenance Cost % RAV
Sensor investment pays back in 4–8 months from avoided breakdowns alone
Prescriptive
1.5–2.2%
Maintenance Cost % RAV
AI scheduling eliminates over-maintenance and optimizes labor utilization to 85%
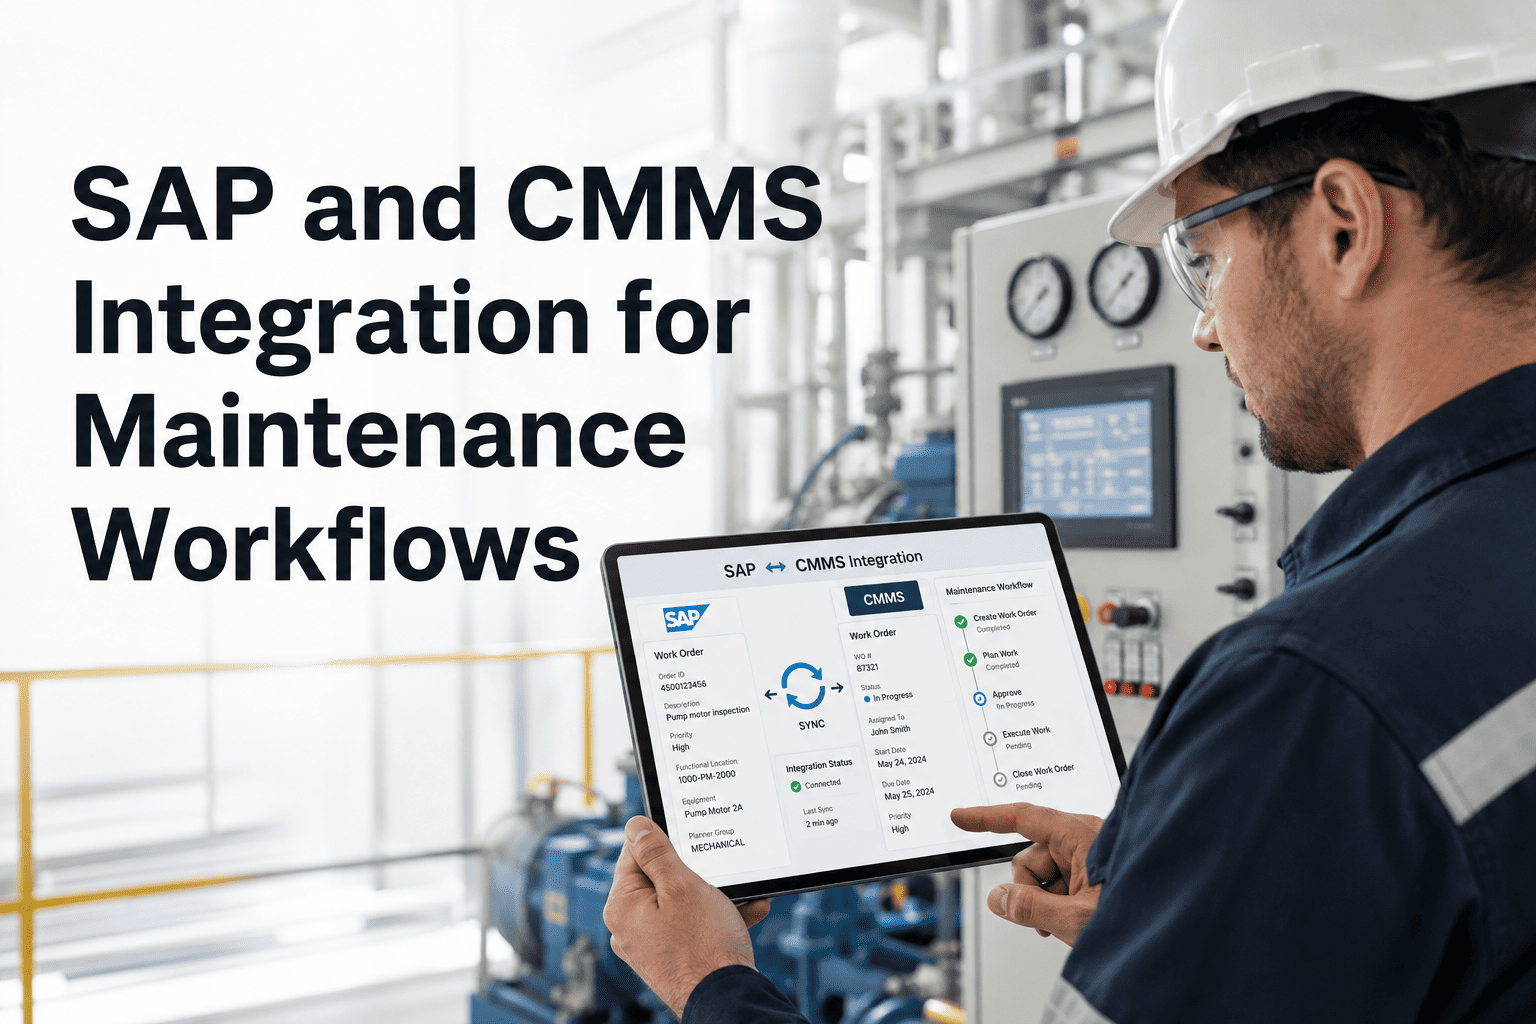
How OxMaint Supports All Four Strategies in One Platform
Most CMMS platforms force you to choose a strategy at implementation — calendar PM or condition-based monitoring. OxMaint is architected to support reactive work orders, preventive scheduling, predictive analytics, and AI prescriptive recommendations in a single unified workflow. You start where you are today and migrate at your own pace as maturity and budget allow.
R
Reactive Work Order Management
Mobile-first emergency work orders with photo capture, technician assignment, parts tracking, and completion documentation. Tracks reactive vs planned ratio to measure PM program maturity.
P
Preventive Maintenance Scheduling
Calendar-based, runtime-based, and meter-based PM triggers. Auto-generated recurring work orders. PM compliance tracking and missed-PM alerts. Full audit trail for compliance documentation.
D
Predictive Condition Monitoring
IoT and SCADA sensor integration via Modbus, MQTT, OPC-UA. AI anomaly detection on vibration, temperature, pressure, and current data. Threshold-based and ML-based alerts auto-generate condition-triggered work orders.
A
Prescriptive AI Scheduling
AI engine analyzes sensor data, production schedules, technician availability, and spare parts inventory to prescribe optimal maintenance timing. Auto-assigns work orders to the right technician at the right time with zero manual planning.
M
Maturity Tracking Dashboard
Real-time visibility into your maintenance maturity score: reactive work order percentage, PM compliance rate, sensor coverage, and predictive accuracy. Benchmarked against industry standards for your sector.
I
Migration Path Templates
Pre-built workflows guide your team from reactive to prescriptive in 18 months. Phase-gated implementation checklist, ROI tracking per phase, and automated migration of calendar PMs to condition-based triggers as sensors are deployed.
Frequently Asked Questions
Can we run preventive and predictive maintenance strategies simultaneously on different assets?+
Yes — and that is the recommended approach. Use calendar-based preventive maintenance on low-criticality assets where sensor monitoring cost exceeds PM labor cost. Deploy predictive condition monitoring on high-criticality, high-downtime-cost assets where sensor ROI is clear. OxMaint manages both in one platform — technicians see a unified work order queue regardless of whether the trigger was a calendar PM or a sensor alert. Most mature operations use all four strategies across different asset classes. Want to see how this works in practice —
start a free trial and build a mixed-strategy program.
How long does it take to migrate from reactive to predictive maintenance?+
The proven timeline is 12–18 months across four phases. Phase 1 (reactive to preventive) delivers measurable downtime reduction within 60–90 days. Phase 2 (preventive optimization) takes another 3–4 months. Phase 3 (predictive pilot on 10–20 critical assets) runs 4 months including sensor installation and AI baseline learning. Phase 4 (prescriptive scale-up) completes by month 18. Each phase is self-funding — ROI from the previous phase funds the next investment. Teams that skip directly from reactive to predictive without building a preventive baseline first have a 70% failure rate.
What is the cost difference between preventive and predictive maintenance programs?+
Preventive maintenance costs $0 in new hardware — just CMMS software ($8/user/month for OxMaint) and PM labor hours. Predictive maintenance adds sensor hardware cost: $50–$200 per monitoring point for wireless vibration/temperature sensors. A 20-asset predictive pilot costs $2,000–$8,000 in sensors. But the ROI gap is dramatic: preventive reduces total maintenance cost to 2.5–3.5% of asset replacement value; predictive reduces it to 1.8–2.8%. For a $2M asset base, that 0.7–1.7% difference is $14,000–$34,000 per year in savings — paying back sensor investment in 2–7 months.
Do we need a CMMS to implement preventive maintenance?+
You can run preventive maintenance with spreadsheets and calendars — but PM compliance drops to 40–60% within 6 months as complexity scales. CMMS-managed PM programs sustain 85–95% compliance because work orders auto-generate, technicians get mobile alerts, and missed PMs trigger escalation workflows. The difference in outcomes: spreadsheet PM reduces emergency repairs by 20–30%; CMMS PM reduces them by 45–55%. At OxMaint's pricing ($8/user/month), the platform pays for itself from a single prevented breakdown. Ready to compare spreadsheet PM to CMMS PM with your actual data —
book a demo.
All Four Strategies — One Platform
Start Where You Are. Migrate at Your Own Pace.
OxMaint supports reactive work orders, preventive scheduling, predictive analytics, and AI prescriptive optimization in one unified CMMS. Deploy calendar PM today, add condition monitoring next quarter, scale to prescriptive AI as your program matures. Free for 30 days — no implementation fees, no long-term contracts.
62%
Downtime reduction — prescriptive vs reactive
820%
3-year ROI — prescriptive programs
18 Months
Reactive to prescriptive migration timeline
$8/mo
Per user — all strategies included