Time-based preventive maintenance catches about 30% of equipment failures before they happen. Condition-based predictive maintenance catches 85–91%. The difference is $120,000 to $480,000 in avoided downtime costs per year for a typical 50-asset manufacturing facility. In 2026, the cost barrier that kept predictive maintenance out of reach for most operations has collapsed — wireless sensors now cost $50–$200 per monitoring point, down 80% from five years ago, and AI anomaly detection is built into modern CMMS platforms at no additional cost. Yet 67% of industrial facilities still rely purely on calendar-based PM schedules, servicing equipment on fixed intervals regardless of actual condition. This guide compares preventive and predictive maintenance with real cost data, ROI benchmarks, implementation timelines, and the specific decision criteria that determine which strategy fits your assets, budget, and team capabilities. If you are running calendar PM and wondering whether predictive monitoring is worth the investment, start a free trial with OxMaint or book a demo to see how one platform supports both strategies with a smooth migration path from PM to PdM.
PM vs PdM Comparison 2026
Strategy Guide
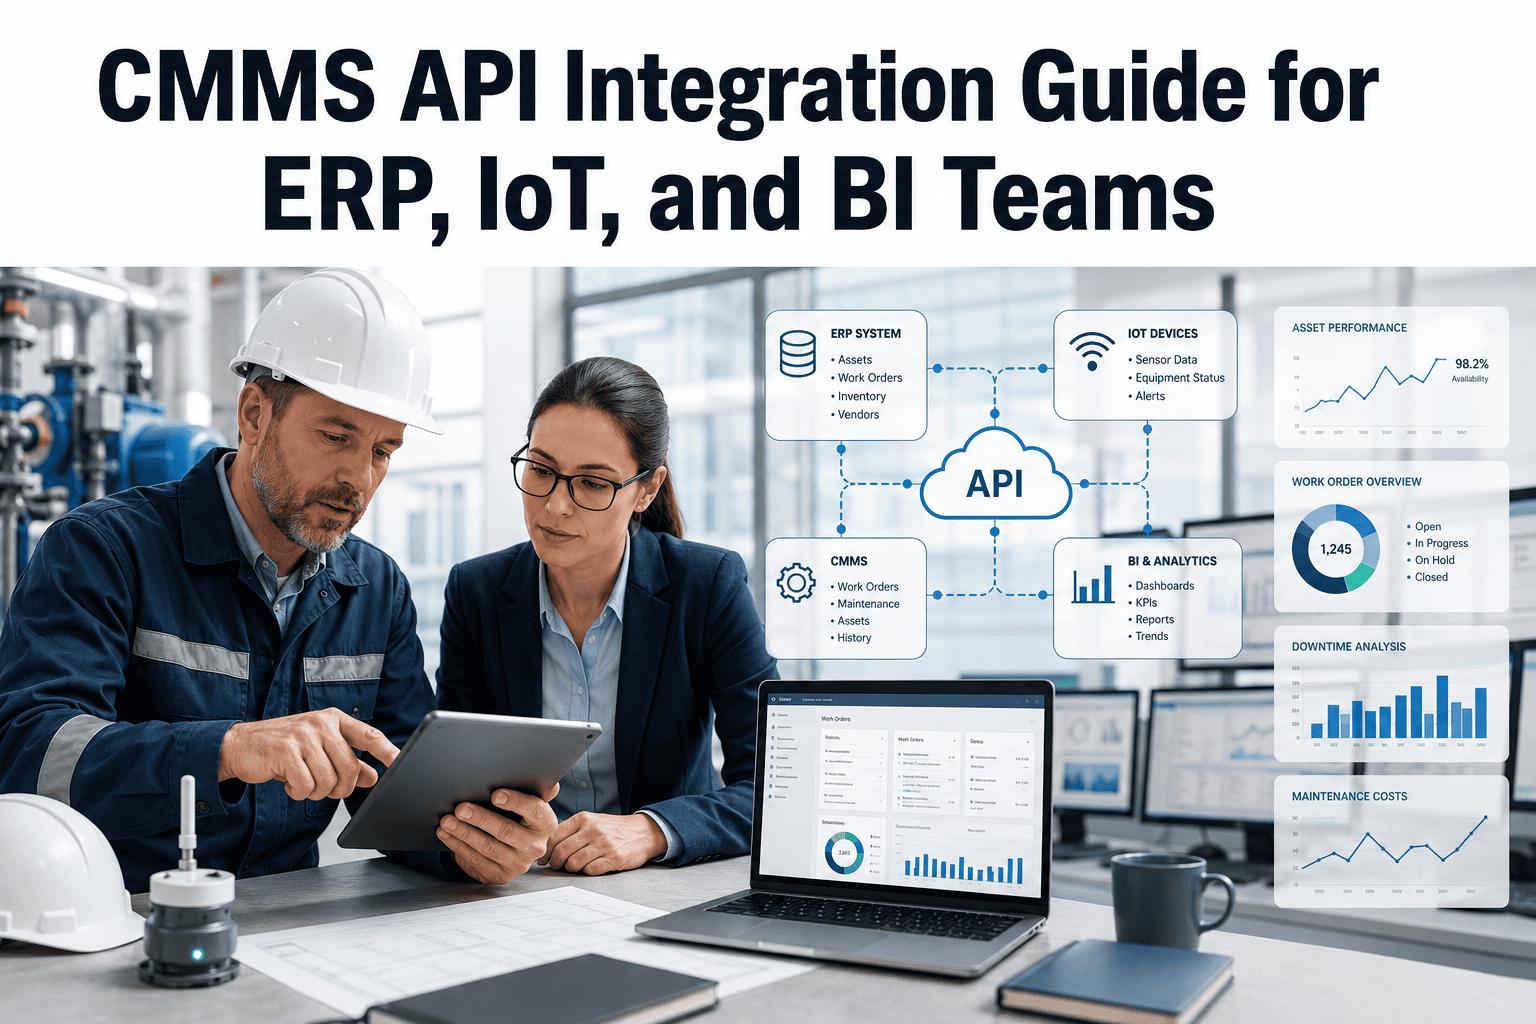
Preventive vs Predictive Maintenance: Which Strategy Fits Your Operation?
The complete comparison — cost structures, failure detection rates, ROI benchmarks, asset selection criteria, and the proven migration path from time-based PM to condition-based PdM.
30% vs 85%
Failure detection rate — preventive maintenance vs predictive maintenance
67%
Of industrial facilities still using only calendar-based preventive maintenance
$50–$200
Cost per wireless sensor monitoring point in 2026 — down 80% from 2019
4–8 Months
Typical payback period for predictive maintenance sensor investment
One Platform — Both Strategies, Smooth Migration Path
OxMaint supports calendar-based preventive maintenance and AI-driven predictive analytics in one unified CMMS. Start with PM schedules today, add condition monitoring to critical assets next quarter, migrate at your own pace. Free for 30 days.
Preventive vs Predictive Maintenance — Core Definitions
The difference between preventive and predictive maintenance is not just technology — it is the fundamental trigger that initiates maintenance action. Preventive maintenance services assets on fixed schedules regardless of condition. Predictive maintenance services assets only when sensor data indicates degradation. Understanding this core distinction drives every cost, ROI, and implementation decision that follows. Teams evaluating which strategy fits their operation can benchmark their current approach and see both options in action — start a free trial to compare PM and PdM workflows side by side, or book a demo for a guided comparison using your actual asset data.
Trigger Mechanism
Calendar, runtime hours, production units, or other fixed interval
Decision Basis
Manufacturer recommendations, historical failure patterns, industry standards
Condition Awareness
None — asset serviced regardless of actual condition
Hardware Required
CMMS only — no sensors needed
Typical Schedule
Daily, weekly, monthly, quarterly, annually — fixed intervals
Common Examples
Oil changes every 3,000 hours, filter replacement monthly, belt inspection quarterly
Trigger Mechanism
Real-time sensor data crossing degradation thresholds or AI anomaly detection
Decision Basis
Actual equipment condition measured by vibration, temperature, pressure, acoustic, or current sensors
Condition Awareness
Continuous — real-time monitoring of asset health
Hardware Required
CMMS + IoT sensors + data connectivity (wireless, SCADA, BMS integration)
Typical Schedule
Event-driven — maintenance triggered only when condition degrades
Common Examples
Bearing replacement triggered by vibration spike, motor service when thermal signature changes
Cost Comparison — What Each Strategy Actually Costs
Preventive maintenance costs less to implement but more to operate. Predictive maintenance costs more upfront but delivers higher operational savings. The ROI crossover point depends on asset criticality, downtime cost, and failure frequency. This comparison uses validated 2024–2026 cost data from SMRP benchmarking studies and Plant Engineering surveys across manufacturing, facilities, and industrial operations.
Implementation Cost — First Year
Preventive Maintenance
CMMS platform (20 users)$1,920/year
Implementation and training$0 (OxMaint)
Asset registry build (50 hours)$3,500
PM schedule development$2,000
Sensors and hardware$0
Total First-Year Cost$7,420
Predictive Maintenance
CMMS platform (20 users)$1,920/year
Implementation and training$0 (OxMaint)
Asset registry build (50 hours)$3,500
Sensors (20 critical assets, 2 points each)$4,000–$8,000
Sensor installation labor$2,500
Total First-Year Cost$11,920–$15,920
Annual Operating Cost — Years 2+
Preventive Maintenance
CMMS platform$1,920/year
PM labor (calendar-triggered)$45,000–$65,000
Parts (scheduled replacements)$18,000–$28,000
Over-maintenance (unnecessary PMs)$8,000–$15,000
Unplanned downtime (failures PM missed)$40,000–$120,000
Total Annual Operating Cost$112,920–$229,920
Predictive Maintenance
CMMS platform$1,920/year
Condition-triggered interventions$28,000–$38,000
Parts (condition-based ordering)$12,000–$18,000
Over-maintenance (eliminated)$0
Unplanned downtime (85% fewer events)$6,000–$18,000
Total Annual Operating Cost$47,920–$75,920
Performance Comparison — Failure Detection and Downtime Reduction
The financial difference between preventive and predictive maintenance is driven by one core performance metric: failure detection rate. Preventive maintenance catches about 30% of failures before they happen because calendar intervals do not align with actual degradation rates. Predictive maintenance catches 85–91% of failures because interventions are triggered by measured condition changes. This 55–61 percentage point difference translates directly into avoided downtime costs.
Failure Detection Rate
PdM catches failures PM misses because condition changes are detected weeks before calendar PM schedules trigger
Unplanned Downtime Reduction
Both percentages measured against reactive baseline — PdM delivers 30–45% further reduction beyond PM alone
Over-Maintenance Rate
PM triggers maintenance at fixed intervals even when equipment is healthy — PdM intervenes only when needed
Asset Life Extension
PdM maintains assets at optimal condition — neither over-maintained nor under-maintained — maximizing useful life
When to Use Preventive Maintenance — Asset Selection Criteria
Preventive maintenance delivers strong ROI on assets where failure patterns are predictable, downtime cost is moderate, and sensor monitoring cost exceeds PM labor cost. These are the specific criteria operations teams use to decide which assets should stay on calendar PM schedules rather than migrate to condition-based monitoring.
Use Preventive Maintenance When:
$
Low Asset Value
Equipment replacement cost under $10,000 — sensor monitoring hardware cost approaches or exceeds asset replacement value
C
Predictable Wear Patterns
Failure rate increases linearly with runtime hours or production units — manufacturer PM intervals proven reliable
D
Low Downtime Cost
Unplanned failure costs under $2,000 per event — PdM sensor ROI does not close within 12 months
R
Redundancy Available
Backup systems online — failure does not stop production — real-time monitoring not critical
M
Easy Manual Inspection
Condition observable through visual/audible/tactile checks — sensor provides no additional insight
L
Low PM Labor Cost
Scheduled service takes under 30 minutes — labor cost of calendar PM under $50 per event
Common Preventive Maintenance Examples:
HVAC filter replacements, lubricant changes, belt inspections, battery testing, small motor PM, lighting maintenance, fire extinguisher inspections, emergency lighting tests, low-voltage electrical panel checks
When to Use Predictive Maintenance — Asset Selection Criteria
Predictive maintenance delivers 680%+ ROI on assets where downtime cost is high, failure is catastrophic, and sensor monitoring provides weeks of advance warning that calendar PM cannot match. These criteria identify the 15–25% of your asset base where PdM investment pays back in 4–8 months.
Use Predictive Maintenance When:
H
High Downtime Cost
Unplanned failure costs $5,000+ per hour — single prevented breakdown pays back sensor investment
V
High Asset Value
Equipment replacement cost over $50,000 — optimizing asset life delivers significant CapEx deferral value
U
Unpredictable Failure Timing
Degradation rate varies with load, ambient conditions, or process variation — calendar PM triggers too early or too late
S
Safety-Critical Equipment
Failure creates injury risk or compliance violation — continuous monitoring provides safety-layer redundancy
E
Early Detection Possible
Vibration, temperature, acoustic, or pressure signatures change 2–12 weeks before failure — sensors provide actionable lead time
A
Access Constraints
Equipment in hazardous locations, at height, or in continuous-operation zones — sensor monitoring safer than manual inspection
Common Predictive Maintenance Examples:
Production line motors, industrial compressors, pump systems, chiller plants, CNC machines, robotic systems, conveyor drives, critical HVAC equipment, boiler systems, hydraulic systems, gearboxes, turbines
ROI Comparison — Real Cost-Benefit Analysis
This ROI comparison uses a 50-asset manufacturing facility with 8 maintenance technicians and $8,500/hour downtime cost — a typical mid-size operation. The analysis compares three scenarios: reactive baseline, preventive maintenance, and predictive maintenance on the 20 highest-criticality assets. Numbers are based on 2024–2026 SMRP and Deloitte benchmarking data.
Annual unplanned downtime events
18
8 (55% reduction)
3 (83% reduction)
Avg hours per downtime event
4.5
3.2
1.8
Total annual downtime cost
$688,500
$217,600
$45,900
Annual maintenance labor cost
$520,000
$468,000
$390,000
Annual parts cost
$180,000
$144,000
$108,000
Platform cost (CMMS + sensors)
$0
$1,920
$1,920 + $6,000 sensors
Total Annual Cost
$1,388,500
$831,520
$551,820
Annual Savings vs Reactive
—
$556,980
$836,680
Migration Path — Preventive to Predictive in 6 Months
You do not replace preventive maintenance with predictive — you layer predictive monitoring onto your highest-criticality assets while maintaining calendar PM on everything else. This phased approach delivers measurable ROI at each stage and avoids the common failure mode of attempting full-scale digital transformation without a proven PM baseline. Teams ready to start this migration can see both strategies working together in one platform — start a free trial to run PM and PdM simultaneously, or book a demo to map the migration timeline to your specific assets.
Month 1–2
Baseline Preventive Maintenance Program
Build complete asset registry in CMMS
Schedule manufacturer-recommended PMs on all assets
Deploy mobile work orders for technicians
Track PM completion rate and reactive work order percentage
Target: 85%+ PM compliance, 40% reduction in reactive work orders vs pre-CMMS baseline
Month 2–3
Asset Criticality Analysis
Score all assets on downtime cost, replacement value, failure frequency
Identify 15–25 highest-criticality assets for PdM pilot
Confirm sensor types needed per asset (vibration, temp, pressure)
Calculate PdM ROI for pilot asset set
Target: 20-asset pilot list with documented $200K+ annual downtime cost — justifying $6K–$8K sensor investment
Month 3–4
Predictive Pilot Deployment
Install wireless sensors on 20 pilot assets (2 monitoring points each)
Connect sensor data streams to OxMaint platform
Configure AI anomaly detection baselines (2–4 week learning period)
Enable auto-generated work orders from sensor alerts
Target: Sensors installed, data flowing, AI baselines learned — system ready for live alerts
Month 4–6
Dual-Strategy Operation and Validation
Run PdM on 20 pilot assets, PM on remaining 30 assets
Track PdM alert accuracy, lead time, and intervention outcomes
Measure downtime reduction on PdM assets vs PM-only assets
Calculate actual ROI and build business case for scale-up
Target: 85%+ PdM prediction accuracy, 50%+ further downtime reduction on monitored assets, payback achieved
How OxMaint Supports Both Strategies in One Platform
Most CMMS platforms are built for either preventive maintenance or predictive analytics — forcing you to choose at implementation. OxMaint supports calendar PM, runtime-based PM, and AI-driven condition monitoring in one unified workflow. Technicians see a single work order queue regardless of whether the trigger was a calendar schedule or a sensor alert.
PM
Calendar and Runtime-Based PM Scheduling
Auto-generated recurring work orders triggered by calendar dates, runtime hours, production units, or meter readings. Full PM compliance tracking with missed-PM alerts and completion history.
PdM
AI Condition Monitoring and Anomaly Detection
IoT sensor integration via Modbus, MQTT, OPC-UA. Machine learning models detect vibration, temperature, pressure, and acoustic anomalies. Threshold-based and AI-based alerts auto-generate condition-triggered work orders.
U
Unified Mobile Work Order Interface
Technicians receive PM work orders and PdM alerts in the same mobile queue. No system-switching. Work order includes full context — whether triggered by calendar, meter, or sensor data.
M
Migration Workflow Templates
Pre-built asset criticality scoring, PdM ROI calculator, and phase-by-phase implementation checklists guide your migration from PM to PdM. Track performance gains as monitoring coverage expands.
B
Benchmarking Dashboard
Real-time comparison: PM-only assets vs PdM-monitored assets. Downtime hours, failure rate, intervention cost, and asset life tracked separately to validate PdM ROI.
S
Hybrid Strategy Reporting
Executive dashboards show total maintenance cost broken down by strategy: reactive, preventive, predictive. Track the financial impact as your program matures from PM to PdM.
Frequently Asked Questions
Can we run preventive and predictive maintenance on the same asset?+
Yes — and this is a common hybrid approach. Run calendar-based PM on consumables and routine services (filter changes, lubrication) while using predictive monitoring for critical failure modes (bearing wear, motor degradation). For example: a production motor might have monthly lubrication PM plus continuous vibration monitoring. The calendar PM handles routine service; the vibration sensor catches bearing degradation between PM intervals. OxMaint manages both triggers on the same asset — technicians see a unified maintenance schedule combining calendar and condition-based work orders.
What percentage of our assets should use predictive vs preventive maintenance?+
Industry benchmark: 15–25% of assets on predictive monitoring, 60–75% on preventive maintenance, 5–15% run-to-failure (by design, on non-critical equipment). Use asset criticality scoring to identify the top 20% of assets by downtime cost — these are your PdM candidates. The remaining 80% stay on calendar PM. Most operations achieve 70%+ of total downtime reduction by monitoring just the top 15–25% most-critical assets. Want to score your assets and see which qualify for PdM —
start a free trial and use OxMaint's built-in criticality calculator.
How accurate is predictive maintenance — what is the false positive rate?+
Well-trained AI anomaly detection systems achieve 85–91% accuracy with 3–8% false positive rate after 30 days of baseline learning. Early alerts (first 2–4 weeks) may show 12–18% false positives as the model learns normal operating variation. False positive rate drops below 4% by day 60 on most equipment types. OxMaint's ML models learn from technician feedback — when a technician marks an alert as false, the system adjusts. Accuracy improves continuously as the model accumulates more operational data. The 85–91% detection rate means PdM catches 85–91 out of every 100 actual failures before they happen — compared to 30 out of 100 for calendar PM.
What is the payback period for predictive maintenance sensor investment?+
Industry average: 4–8 months for high-criticality assets with $5,000+ hourly downtime cost. A single prevented breakdown typically pays back the entire sensor investment. Example: $6,000 sensor deployment on 20 critical assets. First prevented failure (4.5 hours downtime at $8,500/hour = $38,250 avoided cost) covers the full $6,000 investment. Additional prevented failures over the next 12 months compound ROI to 680%+ by year three. For assets with under $2,000 downtime cost, payback extends to 18–24 months — often making calendar PM the better financial choice. Ready to calculate payback for your specific assets —
book a demo and we will run the ROI model with your actual data.
PM and PdM — Same Platform, Smooth Migration
Start With Preventive. Scale to Predictive. One Unified CMMS.
OxMaint supports calendar-based preventive maintenance and AI-driven predictive analytics in one platform. Deploy PM schedules across all assets today, add condition monitoring to your top 20 critical assets next quarter, measure the performance difference, and scale at your own pace. Free for 30 days — no implementation fees, no contracts.
85–91%
PdM failure detection rate
6 Months
PM to PdM migration timeline
$8/mo
Per user — both strategies included