Every maintenance leader knows a CMMS will save money. The problem is proving it — with numbers specific enough to survive a CFO review, a board presentation, or a capital expenditure approval meeting. Generic claims like "CMMS reduces downtime" do not get budgets approved. What gets budgets approved is a calculation showing that your facility's 14 emergency repair events last year cost $187,000, and a CMMS with preventive maintenance scheduling would have prevented 9 of them, saving $120,000 against a $9,600 annual platform cost — a 12.5x return. This guide provides the complete ROI calculation methodology, real benchmark data across industries, and the specific cost categories you need to quantify to build a CMMS business case that finance teams approve. No vague percentages. No theoretical savings. Every number tied to a measurable operational metric your team already tracks — or should be tracking. For teams ready to calculate their specific ROI and see the platform behind the numbers, start a free trial with OxMaint or book a demo to walk through the ROI calculator with your actual facility data.
CMMS Buying Guide 2026 ROI Calculator Business Case Builder
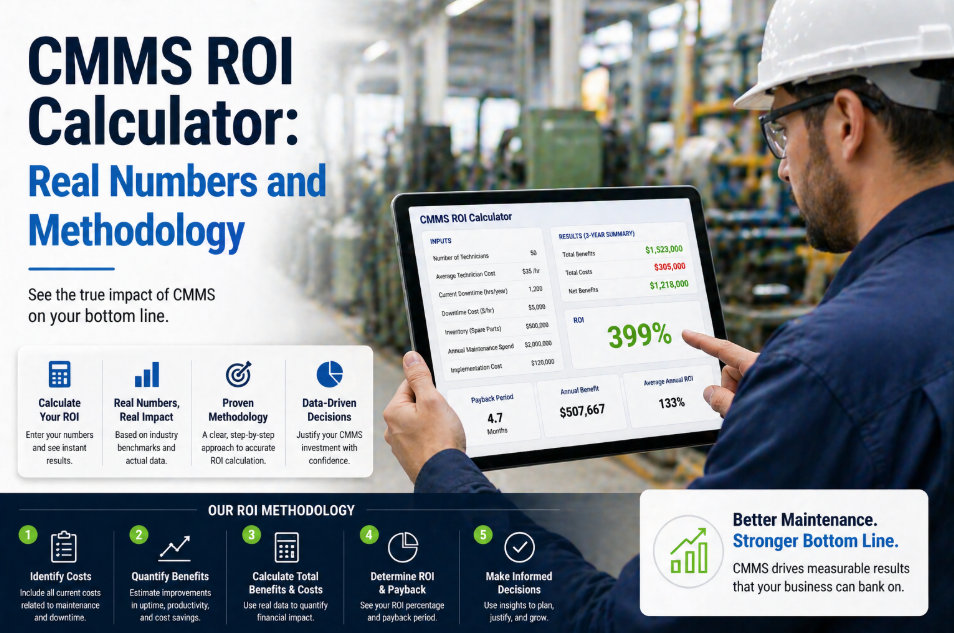
CMMS ROI Calculator: Real Numbers and Methodology
Downtime cost savings, labor productivity gains, parts optimization, asset life extension — the complete methodology to calculate and prove your CMMS return on investment with real industry benchmarks.
4.8x
Emergency repair cost vs. the same job done as planned maintenance
545%
Average 3-year CMMS ROI across manufacturing and facilities sectors
78%
Of unplanned downtime events preventable with scheduled PM programs
$9,600
Annual OxMaint cost for 100 users — the denominator in your ROI equation
OxMaint ROI Calculator — Plug In Your Numbers, Get Your Business Case
OxMaint includes industry ROI benchmarks built into the platform. Input your facility's downtime hours, emergency repair count, asset inventory, and team size — get a boardroom-ready ROI projection in minutes. Free for 30 days.
The CMMS ROI Formula — How the Math Actually Works
CMMS ROI is not a single number — it is the sum of savings across five distinct cost categories divided by total platform cost. Most business cases fail because they only calculate one or two categories and understate the total return. Here is the complete formula used by operations teams that get CMMS budgets approved on the first submission.
The Five ROI Categories — Benchmarks and Calculation Methods
Each of these five savings categories has industry-validated benchmarks. Apply the percentages to your facility's actual spending data to build a site-specific ROI projection. These benchmarks are drawn from Plant Engineering surveys, SMRP data, and Deloitte maintenance analytics across 2023–2026 reporting periods.
Average cost of unplanned downtime$260,000/hr (manufacturing) — $5,000–$15,000/hr (commercial facilities)
PM program impact on unplanned downtimeReduces unplanned events by 45–78%
Your calculation(Annual unplanned downtime hours) x (Hourly cost) x (Reduction % from PM)
Example: 120 hours unplanned downtime x $8,000/hr x 50% reduction = $480,000 annual savings
Technician wrench time without CMMS28–35% of shift (rest is travel, searching, waiting, admin)
Wrench time with CMMS and mobile work orders55–65% of shift
Your calculation(Technician count) x (Annual labor cost) x (Productivity % increase)
Example: 8 technicians x $65,000/yr x 25% productivity gain = $130,000 equivalent labor value recovered
Parts overstocking reduction with CMMS tracking18–25% reduction in carrying cost
Emergency parts expediting cost2.5–4x standard procurement cost per rush order
Your calculation(Annual parts spend) x (Carrying cost reduction %) + (Rush orders avoided x premium cost)
Example: $200K parts budget x 20% carrying reduction + 15 rush orders avoided x $800 premium = $52,000 savings
Asset life extension from preventive maintenance20–40% longer useful life vs. run-to-failure
CapEx deferral valueDelaying a $50K replacement by 3 years saves $12K–$18K in capital cost of money
Your calculation(Replacement cost of PM-covered assets) x (Life extension %) / (Original life years)
Example: $2M in critical assets x 25% life extension = $500K deferred CapEx over 5 years ($100K/year)
Industry ROI Benchmarks — What Real Facilities Achieve
ROI varies by industry, asset intensity, and starting maintenance maturity level. Operations moving from purely reactive maintenance to a CMMS-managed preventive program see the highest initial returns. Here are validated benchmarks across four major sectors.
Manufacturing
High asset density and high downtime cost per hour drive the strongest absolute returns. A single prevented line stoppage often exceeds the entire annual CMMS cost.
Commercial Real Estate
35%
Maintenance Cost Reduction
Multi-property portfolios see compounding returns from centralized asset data and standardized PM programs across sites. CapEx forecasting accuracy improves by 40%.
Healthcare Facilities
Regulatory compliance requirements (Joint Commission, CMS) make audit-ready documentation a direct cost avoidance. Non-compliance penalties range from $10K–$100K per finding.
Food and Beverage
44%
Fewer Emergency Repairs
Equipment failures in food production create both downtime cost and product loss (spoilage). GMP compliance documentation through CMMS reduces audit preparation time by 60%.
The Cost Side — What CMMS Actually Costs in 2026
A fair ROI calculation requires accurate cost inputs. Many CMMS buyers underestimate total cost by only considering license fees. Here is the complete cost picture — and where OxMaint differs from the market.
| Cost Component | Market Average | OxMaint |
| Per-User License (Annual) | $240–$900/user/year | $96/user/year ($8/month) |
| Implementation / Onboarding | $2,000–$250,000 | $0 — self-service setup |
| Training | $500–$15,000 | $0 — in-app guidance, 2-hour onboarding |
| Annual System Admin Labor | $15,000–$80,000 (0.25–1.0 FTE) | $0 — zero admin required |
| Integration / Middleware | $5,000–$50,000 | $0 — native protocol support |
| Total 3-Year Cost (100 users) | $95,000–$620,000 | $28,800 |
Sample ROI Calculation — A 50-Person Manufacturing Plant
Here is a fully worked example for a mid-size manufacturing plant with 50 employees, 8 maintenance technicians, and 200 tracked assets. This is the format that gets CFO approval.
Annual Savings Calculation
Downtime reduction (50% of events prevented)$249,900
Labor productivity (25% wrench time improvement)$130,000
Parts optimization (20% carrying cost reduction)$36,000
Asset life extension (deferred CapEx)$90,000
Total Annual Savings$505,900
Annual OxMaint Cost (20 users at $8/mo)$1,920
263x
First-Year ROI
Total savings divided by total platform cost
1.4 days
Payback Period
Platform cost recovered from first prevented downtime event
$504K
Net Annual Benefit
Savings minus platform cost — pure operational value
$1.51M
3-Year Cumulative Savings
Compounding value as PM maturity increases year over year
Three Mistakes That Kill CMMS Business Cases
Only Calculating Downtime Savings
Downtime reduction is the most visible savings category — but it is only 40–60% of total ROI. Business cases that ignore labor productivity, parts optimization, and asset life extension understate the return by 40–60%, making borderline cases look negative when they are actually strongly positive.
Fix: Quantify all five ROI categories — even conservative estimates across five categories outperform aggressive estimates on one.
Underestimating Emergency Repair Premium
Many teams calculate savings using standard repair costs. But emergency repairs cost 4.8x more than the same repair done as planned maintenance — after-hours labor rates, expedited parts shipping, overtime, and production loss penalties. Using standard repair cost in ROI calculations understates savings by 3–4x on prevented emergencies.
Fix: Use emergency-loaded cost (4.8x standard) for every unplanned event your CMMS would have prevented.
Ignoring Hidden Platform Costs
License cost is often 30–50% of total CMMS ownership cost. Implementation, training, system administration labor, integration middleware, and annual support contracts add 50–200% to the sticker price. Business cases that compare only license fees produce misleading vendor comparisons and understate the ROI advantage of platforms like OxMaint with $0 implementation costs.
Fix: Calculate total 3-year cost of ownership — not just annual license fees — for accurate ROI and vendor comparison.
No Baseline Measurement Before Implementation
Without pre-CMMS baseline data — unplanned downtime hours, emergency repair count, wrench time percentage, parts rush orders — you cannot prove post-implementation improvement. 35% of CMMS projects that deliver real savings cannot demonstrate ROI to leadership because they never measured the starting point.
Fix: Document 90 days of baseline metrics before CMMS go-live — OxMaint's reporting templates include pre/post comparison dashboards.
Frequently Asked Questions
How quickly can a CMMS deliver measurable ROI?+
At OxMaint's pricing ($8/user/month), a 10-user team pays $80/month — $960/year. The first prevented emergency repair event typically saves $3,000–$25,000 depending on asset criticality and industry. Most facilities experience their first prevented breakdown within 30–60 days of activating a preventive maintenance schedule. That single event covers 3–25 years of platform cost. Measured ROI is typically demonstrable within 90 days. For a specific timeline based on your facility data,
start a free trial and import your asset and downtime history.
What baseline data should we collect before implementing a CMMS?+
Four critical baselines: (1) Unplanned downtime events per month — count and duration. (2) Emergency repair spend — total cost including labor, parts, and overtime. (3) Technician wrench time — percentage of shift spent on actual repair work vs. admin, travel, and waiting. (4) Parts rush orders — count and premium cost per event. Collect 90 days of this data before CMMS go-live. OxMaint's reporting dashboard includes pre/post comparison templates that automatically calculate improvement once post-implementation data accumulates.
Does CMMS ROI differ for facilities that already do some preventive maintenance?+
Yes — but it is still strongly positive. Facilities moving from zero PM to CMMS-managed PM see 545%+ average ROI. Facilities that already do informal PM (calendars, spreadsheets, tribal knowledge) see 180–320% ROI from the CMMS — driven primarily by labor productivity gains, reduced missed PMs, better parts management, and audit-ready documentation. The shift is from "we do some PM" to "we have data-driven, consistently executed, fully documented PM." That gap is worth 180–320% return even for teams that are already trying.
How do I present CMMS ROI to a CFO who is skeptical of software investments?+
CFOs respond to three things: (1) Specific dollar amounts tied to specific operational events — "We had 14 emergency repairs last year costing $187,000. PM scheduling would have prevented 9 of them." (2) Payback period — "At $1,920/year, the platform pays for itself from a single prevented breakdown. Payback is under 2 days." (3) Risk framing — "Without a CMMS, our next major equipment failure costs $50,000–$120,000. With a CMMS, the probability of that event drops by 50%." Use your actual numbers, not industry averages. Ready to build your specific business case?
Book a demo and we will walk through the ROI calculator with your facility data.
CMMS ROI with OxMaint
The ROI Is Not Theoretical. It Is Arithmetic.
At $8/user/month with zero implementation fees, OxMaint makes the denominator in your ROI equation so small that even conservative savings estimates produce triple-digit returns. Calculate your specific ROI with your actual facility data — free for 30 days.
545%
Average 3-year CMMS ROI
1.4 days
Typical payback period
$8/mo
Per user — smallest denominator in the industry
$0
Implementation and training cost