Energy is the second largest operating expense in most industrial facilities — averaging 25-40% of total plant costs — yet fewer than 12% of maintenance teams track energy consumption at the individual asset level. The result is a massive blind spot: facility managers know their total utility bill but cannot identify which specific motors, compressors, or HVAC units are consuming disproportionate power. A single degraded 100HP motor operating at 82% efficiency instead of its rated 95% wastes $4,700 in electricity annually. Multiply that across 50-200 motors in a typical plant, and energy waste from poorly maintained equipment reaches $180,000-$470,000 per year. Facilities using platforms like OxMaint's energy monitoring CMMS are identifying these hidden energy drains by tracking per-asset consumption alongside maintenance records — achieving 15-30% energy cost reductions within the first 12 months of deployment.
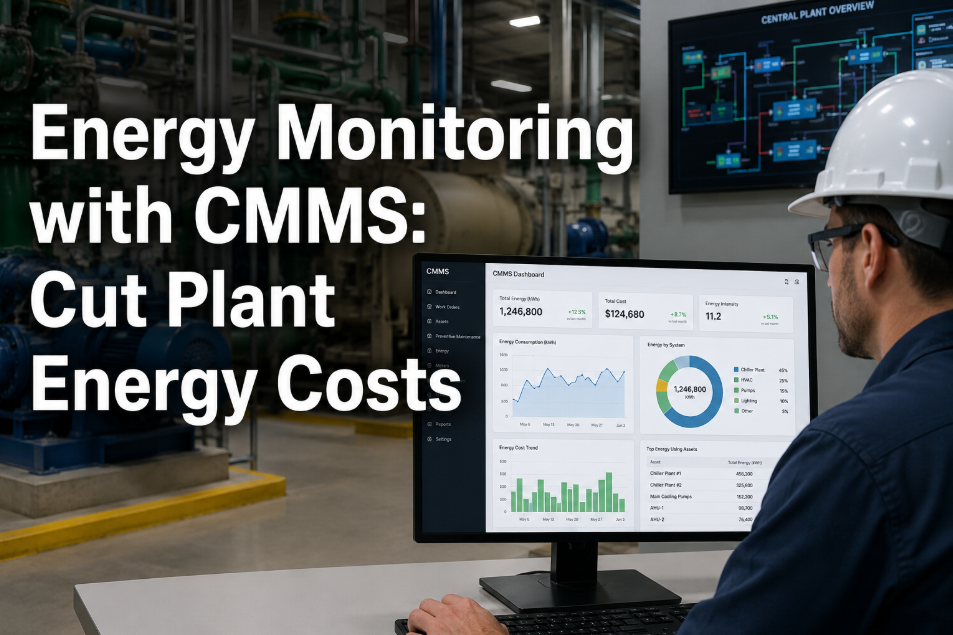
Energy Monitoring with CMMS: Cut Plant Energy Costs by 15-30%
How tracking per-asset energy consumption through your maintenance platform reveals hidden inefficiencies, prioritizes equipment upgrades, and delivers measurable utility cost reductions across your entire facility.
The Energy Visibility Problem in Maintenance Operations
Most facilities manage energy as a bulk utility cost — a single monthly bill divided roughly by square footage or production volume. This approach hides the real problem: a small number of assets consuming a disproportionate share of total energy.
Bearing wear, winding degradation, and misalignment reduce motor efficiency by 5-15% over time. Without per-asset monitoring, this degradation is invisible until the motor fails.
The average compressed air system loses 25-30% of generated air through leaks. At $0.25 per 1,000 cubic feet, a medium plant wastes $18,000-$35,000 annually on leaked air alone.
Dirty filters, refrigerant leaks, and sensor drift cause HVAC systems to run 30-40% more cycles than necessary. Each unnecessary cycle wastes energy and accelerates component wear.
Failed steam traps, degraded insulation, and heat exchanger fouling waste thermal energy equivalent to 12-18% of boiler output in a typical industrial plant.
How Energy Monitoring Works Inside OxMaint CMMS
OxMaint integrates energy monitoring directly into the maintenance workflow — not as a separate utility management tool, but as a core dimension of asset health tracking. Here is how the system architecture works.
Connect sub-meters or IoT energy sensors (as low as $42 per point) to individual motors, compressors, HVAC units, and production equipment. OxMaint ingests kWh data via MQTT, Modbus, or REST API at intervals from 1-minute to hourly — depending on asset criticality. Each reading is linked to the specific asset record in your CMMS.
After 30 days of data collection, OxMaint establishes energy consumption baselines for each monitored asset — accounting for production volume, ambient temperature, and operating mode. Deviations from baseline trigger alerts. A motor that normally draws 74 kWh/day suddenly drawing 89 kWh/day is flagged automatically.
When energy consumption exceeds configured thresholds, OxMaint creates a diagnostic work order linked to the specific asset. The work order includes the energy anomaly data, consumption trend chart reference, asset maintenance history, and suggested diagnostic steps — giving technicians everything needed to investigate.
Real-time dashboards show energy consumption by asset, by system, by building, and across the entire portfolio. Rank assets by energy intensity (kWh per unit output) to identify your worst performers. Compare consumption before and after maintenance interventions to quantify savings achieved by each repair.
OxMaint correlates PM completion rates with energy efficiency trends for each asset. Assets with deferred maintenance show predictable energy consumption increases — typically 3-5% per missed PM cycle. This correlation provides financial justification for PM compliance investment.
When an asset's energy waste exceeds the annualized cost of replacement, OxMaint flags it for CapEx evaluation. The platform calculates energy payback periods for replacement scenarios — helping you prioritize equipment upgrades that deliver the fastest return through energy savings alone.
Energy Impact by Equipment Category
Different equipment types offer vastly different energy savings potential from maintenance optimization. Focus monitoring resources where the energy impact is highest — these categories typically account for 85% of total plant energy consumption.
| Equipment Category | Share of Plant Energy | Typical Waste from Poor Maintenance | Savings from CMMS Monitoring | Annual Savings (Mid-Size Plant) |
|---|---|---|---|---|
| Electric Motors | 35-45% | 8-15% efficiency loss | $28,000 - $67,000 | High Priority |
| Compressed Air Systems | 15-25% | 25-30% air leakage | $18,000 - $35,000 | High Priority |
| HVAC Systems | 10-20% | 20-35% overcycling | $12,000 - $42,000 | High Priority |
| Steam and Boiler Systems | 8-15% | 12-18% heat loss | $9,000 - $24,000 | Medium Priority |
| Lighting and Building Systems | 5-10% | 15-25% schedule waste | $4,000 - $12,000 | Medium Priority |
| Process Heating and Cooling | 5-12% | 10-20% fouling losses | $6,000 - $18,000 | Medium Priority |
A mid-size industrial plant with $1.2M in annual energy costs can realistically target $180,000-$360,000 in savings through systematic per-asset energy monitoring and maintenance optimization. Want to calculate your facility's specific savings potential? Start a free trial and connect your first energy meters, or book a demo for a walkthrough of the energy dashboard.
Before vs After: Plant Energy Management
The difference between managing energy as a bulk cost and managing it per-asset through CMMS is not a marginal improvement — it is the difference between guessing and knowing exactly where your money goes.
Six High-Impact Energy Wins Through Maintenance Optimization
These are the maintenance actions that deliver the largest energy cost reductions — ranked by typical savings magnitude and implementation difficulty. Each is fully executable and trackable through OxMaint.
Schedule quarterly ultrasonic leak surveys as PM tasks in OxMaint. Log leak locations and repair completion. The average plant has 20-30 leaks at any time — each costing $200-1,500 annually. OxMaint tracks leak-repair-verify cycles and calculates energy recovered per repair.
Use current monitoring sensors to track motor load profiles. Compare actual consumption against nameplate efficiency. Motors running below 85% efficiency for more than 90 days are flagged for rewinding or replacement. OxMaint calculates the energy payback period for each replacement decision.
Dirty filters increase fan energy by 15-25%. Fouled coils reduce heat transfer by 20-35%. OxMaint schedules condition-based filter replacements using differential pressure sensor data — replacing filters when actually needed, not on arbitrary calendar intervals.
A single failed steam trap wastes $3,000-$6,000 in energy annually. The average plant has a 15-25% trap failure rate. OxMaint schedules annual trap surveys, tracks repair history per trap, and calculates steam loss prevented — providing clear ROI on the inspection program.
VFDs reduce motor energy by 20-50% — but only when properly maintained. Cooling fan failures, capacitor degradation, and harmonic filter issues reduce VFD effectiveness. OxMaint tracks VFD-specific PM tasks and monitors motor energy to verify VFD performance.
Heat exchanger fouling increases energy consumption by 10-20% as approach temperatures rise. OxMaint monitors temperature differential across exchangers and schedules cleaning based on actual performance degradation — not arbitrary intervals that often result in cleaning too late or too often.
Energy Monitoring ROI Calculator: Your Facility
Use these benchmarks to estimate your facility's energy savings potential. The calculation is straightforward: identify your total energy spend, estimate the percentage attributable to maintainable equipment, and apply the typical improvement range.
These are conservative estimates based on facilities that implement systematic per-asset energy monitoring with automated maintenance triggers. The actual savings depend on current maintenance maturity — facilities starting from a reactive maintenance model typically achieve the higher end of these ranges. Calculate your exact savings potential with OxMaint's energy dashboard — start a free trial and connect your energy data, or book a demo to see the platform in action with your facility type.
Frequently Asked Questions
Do we need to install sub-meters on every asset to start energy monitoring?
How does OxMaint differentiate between normal load variations and energy waste?
Can energy monitoring data feed into our ESG and sustainability reporting?
What is the typical payback period for implementing energy monitoring through CMMS?
Stop Paying for Energy Your Equipment Wastes
Every facility has hidden energy waste locked inside poorly maintained equipment. OxMaint's energy monitoring dashboard reveals exactly which assets are costing you the most — and automatically generates the maintenance work orders to fix them. Most facilities identify their first $10,000 in annual energy savings within 30 days of deployment. See your facility's savings potential in a 30-minute walkthrough.